
Research Article
Austin Chem Eng. 2020; 7(1): 1069.
Experimental Investigations on Shifting Order Behavior of Ethyl Acetate Hydrolysis Using Integral Shifting Order Analysis Approach in Batch Reactor at Constant Stirring
Asghar U1*, Ahmed Khan W1, Masoom A1 and Ali Khan W2
1Department of Chemical Engineering, Wah Engineering College, Pakistan
2Department of Chemical Engineering, NFC- IE & FR, Pakistan
*Corresponding author: Usman Asghar, Department of Chemical Engineering, Wah Engineering College, Wah Cantt., Pakistan
Received: November 23, 2019; Accepted: January 23, 2020; Published: January 30, 2020
Abstract
Reaction kinetics play a vital role for the development of optimized design of a reactor. Due to significance of saponification process, a number of investigations had been done on its different aspects. It is evident from previous studies that maximum yield can be attained when equimolar flow of the both reactants is charged to the reactor. Due to Industrial importance of the products ethanol and sodium acetate, it is utmost desire for the process improvements to maximize its conversion, and economical utilization of raw materials. The objective this research is experimental study of shifting order kinetics for alkaline hydrolysis of ethyl acetate reaction (Saponification reaction) at constant stirring using integral shifting order analysis. For this purpose, experiments are carried out in the batch reactor at constant stirring speed and change in concentrations are determined with the time. Detailed kinetic study has been studied. It is concluded that hydrolysis of ethyl acetate reaction in alkaline medium is a shifting order, and due to its exothermic nature, low reaction temperature promotes high conversion and reaction rate. The values of rate constants k1 and k2 are found to be 0.1867 min-1 and -6.280 min-1 respectively and order shifts at concentration equal to 0.032 M.
Keywords: Reaction Kinetics; Shifting Order; Saponification Reaction; Conductivity; Rate Constant; Hydrolysis
Introduction
A reaction is said to occur when a number of molecules of one or more chemical species have changed their identity and assumed a new form due to change in their kind or configuration or number of atoms in the newly formed compound. Kinetics of a reaction is the interpretation of our insight about chemical process in the form of a mathematical rate expression that can be employed for design and rating of a reactor. Detailed Kinetics emerges as key aspect of Research and Development (R&D) in chemical process industries when a performance model is tested using simulations [1].
Saponification is the hydrolysis of a fatty acid in a basic medium. The base in the saponification reaction breaks the ester bonding, as a result, releases the glycerol and fatty acid salt. Esters are generally present as triglycerides. Saponifiable substances can be precisely defined as those that can be transformed into soap after some kind of chemical treatment. Sodium hydroxide (NaOH) is generally used for producing hard soaps whereas the Potassium Hydroxide (KOH) is usually used to manufacture soft soaps.
Reaction kinetics is the part of physical chemistry that studies rates of reactions. The rate of reaction can be defined as “how fast or slow a reaction takes place” or may be defined as the changes in the number of molecules of reacting species per unit volume per unit time [2]. Rate of a chemical reaction can be influenced by a number of variables, for instance, larger the surface area of solid reactants greater is the reaction rate, higher the concentration of reactants higher is the reaction rate. For gaseous phase reactants and the products, rate of reaction is directly proportional to the partial pressures. Catalysts also influence the rate of reaction, i.e., increases the reaction rate, however the negative catalysts (Inhibitors) may decrease the chemical reaction rates. Elevated temperatures normally favor high reaction rates. Rate equation is the combination of two terms, i.e., concentration depending term and the temperature depending term for homogeneous reactions. Saponification is a reaction in which hydrolysis of acarboxylic acid in basic (alkaline) conditions. Hydrolysis is actually the chemical decomposition that involves the breaking of an ester bond and the glycerol and fatty acid are produced as a result in the alkaline medium. The importance of the product sodium acetate is not limited to its use for cleaning purposes but it has a extensive industrial applications such as in paint, pharmaceutical, as food additive, dying industry, in electroplating industry, photography, purification of glucose and as a meat preservative etc. while the ethanol being a by-product can be utilized as a bio fuel.
In spite of its importance, no research has been made for process improvements like to maximize its conversion, the economical and eco-friendly utilization of raw material for the saponification reaction [3-6]. Reaction of ethyl acetate with sodium hydroxide (saponification) is a 2nd order reaction overall, and 1st order with respect to reactants. Moreover, reaction order drops and become sequential instead of been 2nd order when both reactants are used in the equimolecular concentrations. This reaction is a homogeneous (liquid-liquid), non-catalytic, and the constant density system. Its exothermic in nature [7].
CH3COOC2H5 + NaOH → CH3COONa + C2H5OH
The reaction of ethyl acetate with sodium hydroxide is a well-known reaction in chemistry and it is exemplified as a model reaction of the 2nd order in literature when dealing with chemical kinetics [8-10].
Past research reveals that high conversion is achieved when both reactants are used in equimolecular concentration, the same can be also noticed from the reaction stoichiometry. The overall rate of reaction is retarded by addition of products, however it is too small to demonstrate the variations from the 2nd order kinetics. The deviation is more significant when the concentrations of both ester and base are close. All the earlier studies indicate that in a continuous process, rise in the reactant flow rates would cause decrease in residence time and as a result of which overall conversion dropped. Conversely, rate constant (k) increases initially and then declines with the flow rate of reactants. This considerably reduction in the conductivity can be noticed with stirring rate and results in attaining higher conversion as reaction continues.
Hence, agitation is essential to provide effective mixing and to achieve uniform temperature distribution in the reactor. As the past research reveals that the hydrolysis reaction of ethyl acetate under basic conditions is 2nd order, but during experiments, we noticed that saponification of ethyl acetate with sodium hydroxide does not comply with the 2nd order reaction kinetics. It was essential to investigate the reaction more carefully. The previous studies on this particular reaction did not study the reaction rates thoroughly. Mostly only the average initial rate constant has been found. The variation from the 2nd order kinetics has never been studied in detail. Thus, we investigate the shifting order kinetics this reaction using integral analysis approach.
The same reaction has been studied by many researchers at different temperatures with various measurement techniques in order to determine the reaction order and the activation energies [11,13]. Daniels et al [14]. And Levenson [15] employed a volumetric titration method in which composition of reaction mixture is analyzed by the withdrawal of samples after same time intervals. The major disadvantages are the errors related with the titration employing color indicators. The second technique was reported by Walker [16], who measured the composition at different time intervals using “Conductometric measurement” method. These measurements are carried out manually. But the accuracy of results greatly depends on the response time in Conductometric measurement. Another technique reported by Stead et al [17]. This technique is based on the continuous flow systems and generally for the substantial volumes of fluids. In this approach, the reactants are charged to a Continuous Stirred Tank Reactor (CSTR) at constant temperature. Jensen et al [18] used high frequency titrimetry. This technique does not require the insertion of any external indicator or electrodes in the reaction vessel. But the precaution about the calibration of the equipment must be taken for the nonlinearity of the equipment. This method involves a number of manual operations in methodology as compared with the proposed method. Shui-Yuan et al. and Ge-Li et al. [19,20] employed Acidometry and Micro Calorimetry techniques respectively to find the rate constant (k) for the saponification of esters. However, these modern techniques are not as simple as compared to proposed methods. Zhanjun et al. and Young-Tao et al. [21,22] concentrated their attention to online data using the Conductometric measurement technique in order to make the methodology substantially simpler.
Experimental setup and method
Experimental setup consists of a Batch reactor with a conductometer, which is inserted into the reactor vessel to observe the variations in conductivity of key component (i.e., NaOH in our experiment) after fixed time intervals, Stopwatch, graduated cylinder, burette and pipettes of various sizes for solution preparations.
The operating conditions are maintained at STP in the batch reactor and constant stirring is provided (350 rpm).
The chemicals or reactants necessary to accomplish this reaction are Sodium Hydroxide (NaOH) and Ethyl acetate (CH3COOC2H5) and distilled water is used for solution preparations.
Introduce the equal volumes of each reactant with 0.1M initial concentrations of both reactants.
Before the start of reaction, both the reactants must be at the same temperature.
Note the initial conductivity of key component (i.e., NaOH in our case) at the start of reaction and then on conductometer inserted in reactor vessel after the intervals of two minutes.
The same procedure is continued till no change is being observed on conductometer or two same consecutive readings were found.
The observed conductivity readings from conductometer are converted to concentration (in Molarity units) by using equation (2.1).
The schematics diagram of experimental set up is shown in Figure 2.1.
Where
CAo = Conc. of sodium hydroxide in mixed feeds (M) at t=0.
CA = Conc. of sodium hydroxide in reactor at time t (M).
CA∝ = Conc. of sodium hydroxide in reactor after infinite time (M).
=Conductivity of key component (NaOH) at time t=0 ( ).
=Conductivity of key component (NaOH) at time t ( ).
=Conductivity of key component (NaOH) after infinite time ( ).
Schematic diagram of experimental set up
Results and Discussion
Instantaneous and overall conversion
Conversion is described as “the percentage transformation of reactants into products in a single pass” in multi pass system. Conversion is divided into instantaneous conversion and the overall conversion for a reaction. Both have same meanings for a continuous process but when it comes to batch and semi-batch processes, they have considerable difference. Both overall and Instantaneous conversions are based on initial concentration of the reactant (key component), and the Instantaneous conversion which is based on variable concentration is calculated by following equations. The results are presented in Table 1.
      Sr. No.

      Time

      Conductivity

      Concentration

        (CA)

      Instantaneous

        Conversion

        (XA)t


    (min)
    (µs)
    (M)
    --


    1
    0
    1747
    0.1
    0


    2
    2
    1421
    0.065
    0.35


    3
    4
    1120
    0.034
    0.66


    4
    6
    963
    0.0178
    0.82


    5
    8
    894
    0.0105
    0.91


    6
    10
    874
    0.0084
    0.89


    7
    12
    841
    0.0050
    0.95


    8
    14
    827
    0.0035
    0.96


    9
    16
    823
    0.0031
    0.96


    10
    18
    793
    0.0023
    0.97


    11
    20
    793
    0.0023
    0.97
Table 1: Time Vs Concentration data.
    Sr.    No.
    CAo

      CA=XACAo

      tF

      log(tF)

      Log(CAo)


    M
    M
    sec


    1
    0.065
    0.063
    12
    1.08
    -1.19


    2
    0.0178
    0.0173
    25
    1.40
    -1.75


    3
    0.0084
    0.0081
    38
    1.57
    -2.07


    4
    0.0035
    0.0033
    49
    1.70
    -2.46


    5
    0.0023
    0.0022
    57
    1.76
    -2.64
Table 2: Data for Fractional life Method.
Order of the reaction
Order of Reaction is the dependence of the rate of reaction on the concentration of each reactant. The order of reaction is an experimentally determined parameter and can take on a fractional value.
Sr. No.


Time
(min)


Concentration
(M)


-rA


1


2


0.065


4.8×10⁻⁴


57.14


12.30


2


4


0.034


4.5×10⁻⁴


60.60


16.34


3


6


0.0178


3.9×10⁻⁴


73.17


20.99


4


8


0.0105


3.58×10⁻⁴


89.39


25.18


5


10


0.0084


3.45×10⁻⁴


109.17


27.04


6


12


0.0050


3.34×10⁻⁴


126.32


31.53


7


14


0.0035


3.26×10⁻⁴


145.08


34.74


8


16


0.0031


3.18×10⁻⁴


165.11


35.85


9


18


0.0023


3.12×10⁻⁴


184.24


38.61
Table 3: Calculations for Shifting Order Analysis.
It provides the detail of the stoichiometry of rate determining step of a reaction. A chemical reaction may have more than one order based on variations in the concentrations of reactants but order must remain within a range of (+3,-3). It shows that to what extent the reactant concentration can affects the rate of reaction and which component has highest effect. We have used integral method to determine the order of reaction to find out either saponification reaction satisfy the 2nd order kinetics or a shifting order kinetics. For this purpose, Fractional Life Method (one the integral method) is employed. The equation of Fractional Life Method is
Data required for determination of order of reaction using fraction life method is tabulated in Table 2. Figure 1 is a graph plotted between (CA) and (Time) to determine the tF in order to determine the order of reaction by Fractional Life Method. Figure 2 is a graph plotted between (log CAo) and (log tF) which provide us the straight-line equation. By comparing the equation (3.4) with the straight-line equation obtained from the graph, we found that the order of reaction is 1.468. The earlier researches states that this reaction follows the 2nd order kinetics. But we have found the order of reaction as 1.468, Therefore this reaction cannot be satisfactorily express as a 2nd order reaction. The difference in the value of experimentally found order and literature cited order clearly shows that this reaction is a shifting order reaction, so to verify this, we will make shifting order analysis.
Shifting order analysis
It is quite possible that the data are well fitted by one reaction order at higher concentrations but by another reaction order at the lower concentrations. Shifting order reactions are those reaction whose order changes with the changing concentration of the key component (i.e., reactant).
The general rate equation for a shifting order reaction is:
Order provides us the detail about the stoichiometry of rate determining step for a reaction. A reaction may have more than one orders subject to varying concentrations of reactants. It is actually a relationship between the rate of reaction concentration of reactants/ products. It also reveals that “to what extent the concentration of reactant affects the rate of reaction”, as well as which component has the greatest effect. Likewise, shifting order is a reaction that may have more than one order depending upon varying concentration of reactants. For instance, a reaction is found to have a zero order in the beginning when reactants are at high concentrations, then as the time passes by, the reaction shifts to first order at the end of reaction when reactants concentration is very low. There is certain criteria against which we select the values of m and n for a reaction.
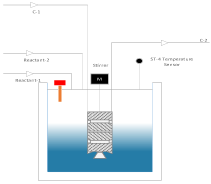
Figure 1: Schematic diagram of experimental set up.
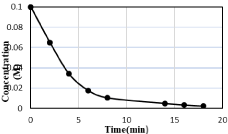
Figure 2: Concentration Vs Time Curve.
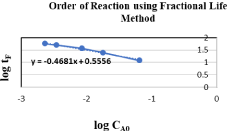
Figure 3: Concentration Vs fractional time.
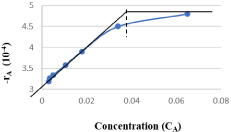
Figure 4: Shifting order Behavior.
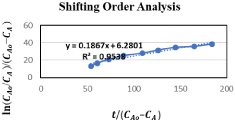
Figure 5: Shifting order Analysis.
At higher concentrations, the order will be m-n
At lower concentrations, the order will be m
Guess any values of m and n in the hit and trial method (for which order should be lies within the range of -3 ≤ order ≤ +3).
The shifting order behavior of this reaction is proved by verifying the equation (3.6) by a straight-line graph after it is plotted. Calculations for shifting order analysis are shown in Table 3.
The results demonstrate that graph (Figure 3.4) is almost a straight line and therefore it is proved that this is a shifting order reaction, whose order is shifted from 2 to 1.46 and order shift is found to be at concentration CA=0.032M, above this concentration, the order of reaction tends to be pseudo first and below this it tends to be second order.
Therefore, it cannot be expressed as 2nd order reaction especially when both reactants are used in equimolar concentrations. Moreover, the values of rate constants k1 and k2 are determined from slope and intercept from graph in Figure 3.4 respectively.
y = 0.1867x + 6.2801
By comparing it with a straight-line equation (y=mx + c) we will get:
m=slope= k1=0.1867 min-1
c=intercept =- k2=-6.2801min-1
At higher concentration of the key component, k2CA>>1 the reaction is of 1st order with rate constant (k) =k1/k2. On the Contrary, as the concentration of the key component becomes low, k2CA<<1, the reaction will be of 2nd order. Thus, transition takes place at k2 ≅ 1.
Conclusions
In this research, hydrolysis of ethyl acetate was studied at constant agitation using integral shifting order analysis approach. it is concluded that alkaline hydrolysis of ethyl acetate is a shifting order reaction and order shifts at molar concentration equal to 0.032 M. The order shift was calculated within the order range of “1-2”. Values of k1 and k2 are found to be 0.1867 and -6.280 respectively.
Moreover, its overall order found to be 1.46, so it cannot be expressed satisfactorily as a 2nd order reaction especially when both reactants are used in equimolar concentrations.
The low reaction temperature favors the high overall conversion, it is due to the low energy barrier for reactant molecules to make an effective collision and less temperature sensitive.
Acknowledgement
All praises to ALMIGHTY ALLAH, who provided me with the strength to accomplish this research work. All respects are for His HOLY PROPHET (PBUH), whose teachings are true source of knowledge & guidance for whole mankind.
I want to express my sincere thanks and deep gratitude to Dr. Waqar Ali Khan for providing me their invaluable help, encouragement, guidance, motivation, and constructive criticism during this project. Finally, I would like to thank all the faculty members for their help.
References
- Wijayarathne UPL, Wasalathilake KC. Aspen Plus Simulation of Saponification of Ethyl Acetate in the Presence of Sodium Hydroxide in a Plug Flow Reactor. Journal of Chemical Engineering and Process Technology. 2014; 5: 1062-1069.
- Kim YW, Barid JK. Reaction Kinetics and Critical Phenomenon: Saponification of Ethyl Acetate at the Consolute Point of 2-Butoxyethanol + Water, International Journal of Thermophysics. 2004; 25: 1025.
- Danish M, Al Mesfer M, Rashid M. Effect of Operating Conditions on CSTR Performance: An Experimental Study, International Journal of Engineering Research and Applications. 2015; 5: 74-78.
- Arman Mohammed Abdalla Ahmed. “Modeling and Measurement of Performance of Batch Reactor using Electrical Conductivity Saponification”, Sudan University of Science and Technology-College of Engineering. 2010.
- Danish M, Al Mesfer MK. “A Comparative Study of Saponification Reaction in a PFR and CSTR”, Research Journal of Chemical Sciences. 2015; 5: 46-50.
- Ahmad A, Ahmad MI, Younas M, Khan H, Shah MH. A Comparative Study of Alkaline Hydrolysis of Ethyl Acetate using Design of Experiments. Iranian Journal of Chemistry and Chemical Engineering. 2013; 32: 33-47.
- Ikhazuangbe, Prosper Monday Ohien, Oni, Aisosa Babalola. “Reaction Rate and Rate Constant of the Hydrolysis of Ethyl Acetate with Sodium Hydroxide”, American Journal of Scientific and Industrial Research. 2015.
- Zia-Ul-Haq, Suneela Sardar, S Zafar, M Awais. “Kinetic Law Parameters Study of Saponification Reaction using Integral Method”, NFC-IEFR Journal of Engineering and Fertilizer Research. 2014.
- Malik SR, Awan BA, Shafiq U, Mukhtar A. Investigation of the Agitation Effect on the Conversion of Saponification Reaction in a Batch Reactor at STP Conditions. International Journal of Applied Sciences and Engineering Research. 2015; 4: 461-466.
- Mukhtar A, Shafiq U, Khan FA, Qadir HA, Qizilbash M. Estimation of Parameters of Arrhenius Equations for Ethyl Acetate Saponification Reaction. Research Journal of Chemical Sciences. 2015; 5: 46-50.
- HirooTsujikawa, HakuaiInone. The Reaction Rates of Alkaline Hydrolysis of Ethyl Acetate, Bulletin of Chemical Society of Japan. 1966; 39: 1837-1842.
- Schneider MA, Stoessel F. Determination of the Kinetic Parameters of Fast Exothermal Reactions using a Novel-Micro Reactor Based Calorimeter, Chemical Engineering Journal. 2005; 115: 73-83.
- Das k, Sahoo P, Sai Baba M, Murali N, Swaminathan P. Kinetic Studies on Saponification of Ethyl Acetate using an Innovative Conductivity-Monitoring Instrument with a Pulsating Sensor, International Journal of Chemical Kinetics. 2011; 1-9.
- Daniels F, Matthews J, Williams J. Experimental Physical Chemistry, McGraw-Hill, New York. 1941; 167-169.
- Hilton AS, Levenson HS. Kinetics of Saponification of Ethyl Esters of Normal Aliphatic Acids. Journal of American Chemical Society. 1939; 61: 1172-1175.
- Walker J. A Method for Determining the Velocities of Saponification, Proceedings of the Royal Society of London. 1906; 78: 157-160.
- Stead B, Page FM, Denbigh KG. Experimental Technique. An Experimental Method to use in Chemical Kinetics and in the Study of Transient Intermediates, Discuss Faraday Society. 1947; 2: 263-270.
- Jensen FW, Watson GM, Beckham JB, Study of Saponification Reaction Rate of Ethyl Acetate by High Frequency Titrimetry, Analytical Chemistry. 1951; 23: 1770-1773.
- Shui-Yuan, Xiang-Rong S, Li-Xia L, Lu-Yao PM. Xi’an Keji Xueyuan Xuebao. 2004; 24: 196-198.
- Ge-Li, Wan-Ying K, Li-Li H, Daxue Xuebao MJ. ZiranKexueban (Jinan, China). 2007; 21: 361-364.
- Zhanjun, Wenwei Y, Qingyun Z, Liaoning R, Xuebao SD, ZiranKexueban. 2006; 29: 511-514.
- Yong-Tao, Wen-Qing W, Ruo-Bing Z, Xiang-Hui H, Fang Y, Guangxi F, et al. Ziran Kexueban. 2001; 19: 50-54.

