
Research Article
Austin Chem Eng. 2021; 8(1): 1084.
Design and Modeling of a Carbon Capturing Membrane for Integrated Gasification Combined Cycle Power Plant
Hashmi SAM1,2*
¹Department of Environmental Engineering, Karabuk University, Turkey
²Department of Chemical Engineering, University of Wah, Pakistan
*Corresponding author: Syed Abdul Moiz Hashmi, Department of Chemical Engineering, University of Wah, Pakistan
Received: March 01, 2021; Accepted: March 24, 2021; Published: March 31, 2021
Abstract
The main idea of this research paper is to provide an innovative way of capturing carbon dioxide emissions from a coal powered power plant. This research paper discusses the design and modeling of a carbon capturing membrane which is being used in an IGCC power plant to capture carbon dioxide from its exhaust gases. The modeling and design of the membrane is done using CFD software namely Ansys workbench. The design and modeling is done using two simulations, one describes the design and structure and the second one demonstrates the working mechanism of the membrane. This paper also briefly discusses IGCC which is environmentally benign compared to traditional pulverized coal-fired power plants, and economically feasible compared to the Natural Gas Combine Cycle (NGCC). IGCC power plant is more diverse and offers flexibility in fuel utility. This paper also incorporates a PFD of integrated gasification power plant with the carbon capturing membrane unit integrated in it.
Index Terms: Integrated gasification combined cycle power plant, Carbon capture and storage, Gas permeating membrane, CFD based design of gas permeating membrane.
Keywords: Integrated Gasification Combined Cycle (IGCC); Computational Fluid Dynamics (CFD); Natural Gas Combine Cycle (NGCC)
Introduction
The Integrated Gasification Combined Cycle (IGCC) technology allows the use of solid and liquid fuels in a power plant that has the environmental benefits of a natural gas fueled plant and the thermal performance of a combined cycle. In its simplest form, the solid or liquid fuel is gasified with either oxygen or air, and the resulting raw gas (called syngas, an abbreviation for synthetic gas) is cooled, cleaned of particulate matter and sulfur species, and fired in a gas turbine. By removing the emission-forming constituents from the gas under pressure prior to combustion in the power block, IGCC plants can meet extremely stringent air emission standards.
The hot exhaust from the gas turbine passes to a Heat Recovery Steam Generator (HRSG) where it produces steam that drives a steam turbine. Power is produced from both the gas and steam turbines. A block flow diagram of an IGCC system is shown in Figure 1.
There are many variations on this basic IGCC scheme, especially in the degree of integration. Four major commercial-sized, coal-based IGCC demonstration plants are in operation that each use a different gasification technology, gas cooling and gas cleanup arrangement, and integration scheme between the plant units. All of the current coal based plants integrate the steam systems of the gasification and power block sections. Typically Boiler Feed Water (BFW) is preheated in the HRSG and passed to the gasification section where saturated steam is raised from cooling of the raw syngas. The saturated steam passes to the HRSG for superheating and reheating prior to introduction, with additional HRSG superheated steam, to the steam turbine for power production.
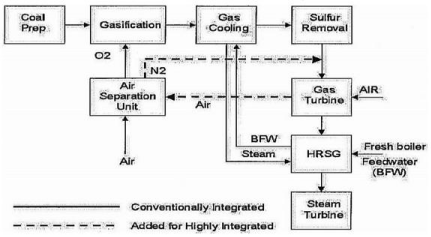
Figure 1: Block flow diagram of an IGCC power plant.
Electricity production from fossil fuel based power plants will be challenged by growing concerns that anthropogenic emission of greenhouse gases such as Carbon Dioxide are contributing to the event of global climate change. Today all coal fired power plants in the world emit approximately 2 billion tons of CO2 per year. The regulation of the carbon dioxide emissions implies the development of specific CO2 capture technologies that can be retrofitted to existing power plants as well designed into new plants with the goal to achieve 90% of CO2 capture limiting the increase in cost of electricity to no more than 35 percent [1].
Therefore the recovery of CO2 from large sources is a difficult task which has received considerable attention for several years and has seen a variety of advancements and discoveries throughout the years [2,3]. The IGCC power plant because of its design enables us to capture carbon dioxide from the flue gas. There are a variety of methods available to remove CO2 from a fossil fuel based power plant system [4,5].
A. Brunetti [6] investigated the use of membrane technologies to capture carbon dioxide emissions from coal fired power plants. Important take away from his work includes his study of polymeric membrane for CO2 separation and development of new polymeric membrane material with a selectivity of 100-160. He further discusses the advantage membrane system has over other forms and systems used for carbon capture. Shabbir Husain [7] did research on the performance of mixed matrix membranes used for gas separation and suggested multiple techniques which can be used to increase the performance of mixed matrix membrane for a gas separation operation.
Li Zhao [8] did a comparative investigation of two polymeric membrane materials for post combustion carbon capture. In their research two polymeric membrane materials were used integrated into a cascade membrane system which was used for a 600MW reference power plant. K. Sugiura [9] investigated the use of MCFC as a CO2 concentrator. In this work the experimental results of CO2 sequestration by use of an MCFC are given. Campanari [10] developed the idea of adopting a molten carbonate fuel cell to reduce CO2 emissions. In his research paper he presented an estimated reduction of 77% in CO2 emissions can be achieved in a steam turbine power plant.
Fuel cells work at temperatures ranging from 600 to 1,000ºC and potentially can achieve ultra-high efficiencies shown by the research work conducted by L. Blum [11].
The efficiencies of fuel cells becomes ultra-high especially when coupled with a gas turbine to form a molten carbonate fuel cell and gas turbine hybrid system [12,13]. A. Amorelli [14] described an experimental inquiry into the use of molten carbonate fuel cells to capture CO2 from gas turbine exhaust gases. They acquired an emission reduction of 50%.
M. Lusardi [15] investigated the use of a fuel cell system for separating CO2 from thermal plant exhaust. He found that, even without CO2 separation, the relative emission of carbon dioxide could be reduced to below the Kyoto Protocol limit. If a separator is used, emissions could be reduced by 68%.
Campanari [16] also investigated the possibility of separating CO2 from integrated combined cycle power plants by using molten carbonate fuel cell. The results that were obtained show that CO2 reduction can reach 80% while the electrical efficiency remains unchanged. While the power of cell contributed to 17% of the entire system.
Jung-Ho Wee [17] investigated the three fields (mobile application, transportation application and stationary application) in terms of CO2 emission reduction through the use of fuel cells. Only the last of them considered the possibility of using MCFC for the separation of CO2.
J Milewski and J Lewandowski described novel methods where carbonates were used as electrochemical pump in CO2 separation from gases.
Gang Xu [18] showed cryogenic separation of CO2 from integrated combined cycle power plant using cryogenic separation and distillation theory. The considered system gives the possibility to separate 80% CO2, while the increase in power as a result of the proposed solution is 22% with nearly unchanged efficiency (59% LHV).
Nansheng [19] Xu presented tests results of a new composite–a dual phase mixed carbonation and electron conducting membrane.
The above literature review provides an overview of the different non-conventional methods for capturing CO2 from a gas stream, typically flue gas. The conventional methods for CO2 separation are absorption [20] (using amines) and adsorption [21,22]. But in this paper we will discuss post-combustion CO2 capture with the use of membrane technology. So in conclusion this paper will be focused on development of membrane technology for post combustion capture of CO2 from a coal fired power plant.
Carbon Capture and Storage, IGCC Case Study
Carbon capture and storage, or CCS, is a process used to capture carbon dioxide gas (CO2) that is produced by power stations or other types of industrial facilities. To keep CO2 out of the atmosphere, it is captured from the power plant or industry, transported, and securely stored underground, permanently [23]. CCS technology involves three major steps:
- Capture: The separation of CO2 from other gases produced from facilities including coal and natural gas power plants, steel mills and cement plants.
- Transport: Once separated, the CO2 is compressed and transported, usually via pipelines, to a suitable site for deep underground storage.
- Storage: CO2 is injected into deep underground rock formations, normally at depths of two kilometers or more. The CCS storage process simply imitates how nature has stored oil, gas and CO2 for millions of years.
CCS is a vital technology for helping the world to meet the climate targets agreed at the 2015 Paris climate talks. The Intergovernmental Panel on Climate Change (IPCC) has found that achieving the deep cuts in CO2 emissions necessary to limit global warming to 2 degrees Celsius (°C) would cost 138 per cent more without CCS [24].
CO2 capturing techniques
Based on economic and environmental considerations, it is necessary to apply efficient and suitable technology for CO2 separation with low operating cost and energy consumption. Up to now, there are several gas separation technologies being investigated.
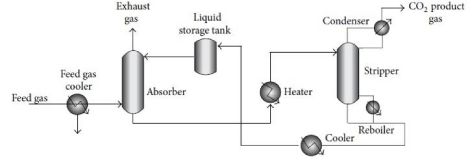
Figure 2: Schematic diagram of CO2 absorption plant.
Absorption: Absorption stripping is an important technology for CO2 capture from fuel gas in this technology desired component in mixed gases are dissolved in a solvent (bulk phase). The general scheme of the process is depicted in the Figure 2. The flue gas (containing CO2) is cooled (between 318 and 323K), and fed to the absorption column (scrubber) where the solvent absorbs CO2. The CO2-rich solution is fed into a heater to increase the temperature of solution, then to a stripper column to release the CO2. The released CO2 is compressed, and the regenerated absorbent solution is cooled and recycled to the absorber column.
Energy required for post-combustion CO2 capture is an important issue. Thus, recent studies suggest that reduction of the cost of this capture could be achieved by finding suitable solvents that could process larger amounts of CO2 for a given mass and require less energy for stripping stage [20].
Adsorption: Adsorption operation can reduce energy and cost of the capture or separation of CO2 in post combustion capture. To achieve this goal, it is necessary to find adsorbents with suitable properties. In general, CO2 adsorbent must have high selectivity and adsorption capacity and adequate adsorption/desorption kinetics, remain stable after several adsorption/desorption cycles, and possess good thermal and mechanical stability. The adsorbents used for CO2 separation placed into two main categories: physical and chemical adsorbents [24].
Cryogenic distillation: Cryogenic method utilized low temperatures for condensation, separation, and purification of CO2 from flue gases (freezing point of pure CO2 is 195.5K at atmospheric pressure). Therefore, under the cryogenic separation process, the components can be separated by a series of compression, cooling, and expansion steps. It enables direct production of liquid CO2 that can be stored or sequestered at high pressure via liquid pumping [25].
Membrane separation: The membrane separation method is a continuous, steady-state, clean and simple process, and ideal as an energy-saving method for CO2 recovery. Gas separation using membranes is a pressure-driven process. Due to the low pressure of flue gases, driving force is too low for membrane processes in post-combustion (low pressure and low CO2 concentration). Membrane processes offer increased separation performances when CO2 concentration in the feed mixture increases.
Membrane separation processes have several advantages over other CO2 separation technologies. The required process equipment is very simple, compact, relatively easy to operate and control, clear process and easy to scale up.
The energy required for the recovery of CO2 by membrane processes depends on the target purity, flue gas composition, and membrane selectivity for CO2. However membrane processes require too much energy for post-combustion CO2 capture; therefore, low partial pressure of CO2 in the flue gas is a possible disadvantage for the application of membranes. Another disadvantage of membrane process is that the membrane selectivity for the separation of CO2 from SOx and NOx is very low [26].
Membrane process is not useful for high flow rate applications. Therefore, the useful membrane for post-combustion CO2 capture should have some specification such as:
- High CO2 permeability
- High selectivity for CO2 separation from flue gases
- High thermal and chemical stability
- Resistant to plasticization
- Resistant to aging
- Cost effective
- Low production cost for different membrane modules.
Case study of IGCC
The presence of coal deposits in Pakistan was known before independence, but its economic value was highlighted in 1980 when large reserves of coal were discovered in the Lakhra and Sonda areas of Sindh Province. The discovery of another huge coal deposit of 175.5 billion tones in an area of 10,000sq.km in Thar Parkar District of Sindh has provided a quantum increase in the coal resources of Pakistan. Coal is found and being developed in all four provinces like Sind, Baluchistan, Punjab, Khyber-Pakhtunkhwa along with Azad Jammu Kashmir. The revised and updated and total coal reserves of Pakistan are 186288.05 million tones. The total coal resources of Sindh have been estimated to 184.6 billion tones whereas the coal deposits of Thar alone are estimated at 175.5 billion tones, which can ideally be utilized for power generation. In addition to Thar, the other coalfields of Sindh are at Lakhra, Sonda, Jherruck and Indus East. The Lakhra coalfield is fully developed, and contains mineable coal reserves of 146 million tones. Sindh coal is classified as ‘Lignite’ with calorific value ranging from 5,219 to 13,555 Btu/lb. Thar coal has low sulfur and low ash content but high moisture, whereas Lakhra coal contains high sulfur content (Table 1).
Selecting thar coal as our feed stock we have designed an integrated gasification combined cycle 300MW power plant for producing electricity with the carbon capturing membrane. We have selected block 3 as our feed source from that coal reserve [27]. The coal required per hour to run a 300MW per hour electric plant is our basis. Which is 2259.0216lbmol/hr of coal (Figure 3).
    Coal    field
    Total    reserve (mt)
    Moisture content %
    Volatile    matter %
    Fixed    carbon %
    Ash    %
    Sulphur content %
    Heating    value BTU/lb.
    Rank


    Lakhra
    1328
    9.7-38.1
    18.3-38.6
    9.8-38.2
    4.3-49
    1.2-14.8
    5503-9158
    LigB-SubC


    Meting-Jhimpir
    161
    26.6-36.6
    25.2-34.0
    24.1-32.2
    8.2-16.8
    2.9-5.1
    7734-8612
    LigA-SubC


    Sonda-Thatta
    3700
    22.6-48.0
    16.1-36.9
    8.9-36.1
    2.7-52.0
    0.2-15.0
    8878-13555
    SubC-hvBb


    Jherruck
    1823
    9.0-39.5
    20.0-44.2
    15.0-58.8
    5.0-39.0
    0.4-7.7
    8800-12846
    SubC-hvCb


    Ongar
    312
    9.0-39.5
    20.0-44.2
    15.0-58.8
    5.0-39.0
    0.4-7.7
    5219-11172
    LigB-SubA


    Indus    East
    1777
    9.0-39.5
    20.0-44.2
    15.0-58.8
    5.0-39.0
    0.4-7.7
    7782-8660
    LigA-SubC


    Badin
    850
    9.0-39.5
    20.0-44.2
    15.0-58.8
    5.0-39.0
    0.4-7.7
    11415-11521
    LigB-SubA


    Thar
    175506
    29.6-55.5
    23.1-36.6
    14.2-34.0
    2.9-11.5
    0.4-2.9
    6244-11045
    LigB-SubA
Table 1: Properties of sindh coal.
Tag no: Equipment; G-101: Gasifier; CS-101,102: Cyclone Separator; C-201, C-202: H2S absorber and stripper; R-301, R-302: HT and LT shit reactor; M-401: Membrane separation unit; V-501: Deaerator; E-501: HRSG; C-501: Combustor; GT-501: Gas turbine.
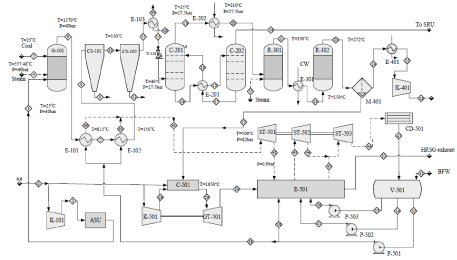
    Figure 3: Process flow diagram of integrated gasification combined cycle power plant.

Tag no: Equipment; G-101: Gasifier; CS-101,102: Cyclone Separator; C-201, C-202: H2S absorber and stripper; R-301, R-302: HT and LT shit reactor; M-401:
Membrane separation unit; V-501: Deaerator; E-501: HRSG; C-501: Combustor; GT-501: Gas turbine.
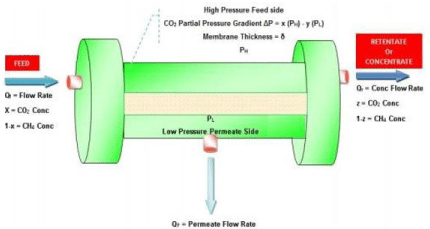
Figure 4: Principle of gas permeation and separation.
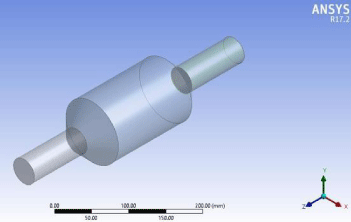
Figure 5: Membrane geometry.
Material Selection and Methodology
Gas permeation
The driving force for gas separation is partial pressure gradient which is the product of total pressure and mole fraction. Most membranes used for gas separation are non-porous. Separation takes place according to the morphology of the membrane which is based on different transport mechanisms. Porous polymer membranes have a pore size ranging from 0.5 to 10 µm and non-porous membranes with a polymer chain gap of 10-3 to 10-4 µm induced by thermal vibrations. Depending on the porosity of the membrane matrix, various transport mechanisms including Poiseuille (viscous) flow, Knudsen’s diffusion, molecular sieving, capillary condensation and solution diffusion mechanism for gas transport through membranes are proposed (Figure 4) [26].
Membrane selection
The sole purpose is to separate carbon dioxide from the other flue gases. The flue gas also contains methane so, to get our desired product we first have to separate methane from the carbon dioxide. So for the process two different membranes will be used and two different separation operations will take place.
For the modeling and design of this membrane of we have chosen a computer aided design method. Ansys fluent (workbench) was used to design and model this membrane and simulate it. Two separate design and simulations were done.
- The simulation for the design of membrane and its structure and choice of its material of construction.
- Simulation to show case in real time the CO2 separating action across the membrane layer.
First membrane (design and construction of the membrane)
The first step towards modeling the membrane was to design a structure for the membrane for that we chose a shape that is highly efficient in operation due to its large surface area and simple in construction. The membrane geometry is simple and efficient consisting of an inlet section, the main body and an outlet section (Figure 5).
Meshing of the geometrical structure
After the basic geometry of the membrane has been created the next step is meshing of the basic structure. Before the meshing can be stated the geometry was divided into named sections as follows (Figure 6).
The size function used for the meshing operation was curvature and the mesh was generated and the scoping method used was geometry selection (Figure 7).
The properties and the set perimeters of the mesh are expressed in the Table 2 below:
Setup: After the geometry has been made and meshing has completed successfully the next step is the setup. A pressure based solver was employed to solve this geometry, keeping the velocity formulation absolute we were able to solve this particular geometry.
The model used was standard viscous k and e model with wall friction and a single phase i.e. (gaseous phase).
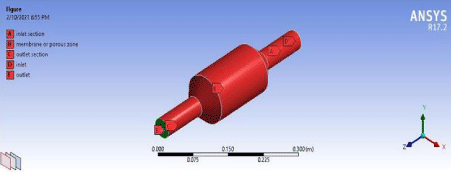
Figure 6: Named sections of the membrane.
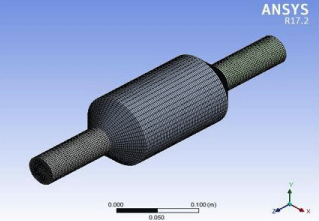
Figure 7: Membrane geometry after mesh generation.
The materials selected for the solution are as follows:
- For the fluid CO2 was selected.
- For the material for the membrane aluminum was selected for the inlet and outlet zone and for the membrane zone ash solid (that is carbon based graphite) was selected.
After setting the boundary conditions for each part of the structure the initial solution was initiated and it was as follows:
Domain Extents:
X-coordinate: min (m) = -5.000000e-02, max (m) = 5.000000e-02
Y-coordinate: min (m) = -4.992001e-02, max (m) = 4.993907e-02
Z-coordinate: min (m) = -3.000000e-01, max (m) = 1.000000e-01
Volume statistics:
Minimum volume (m3): 1.179418e-09
Maximum volume (m3): 1.068581e-07
Total volume (m3): 1.591723e-03
Face area statistics:
Minimum face area (m2): 6.127010e-07
Maximum face area (m2): 4.274386e-05
Checking mesh.........................
Done.
    Object Name
    Mesh


    State
    Solved


    Display


    Display Style
    Body    Color


    Defaults


    Physics    Preference
    CFD


    Solver    Preference
    Fluent


    Relevance
    0


    Export Format
    Standard


    Shape Checking
    CFD


    Target    Skewness
    Program Controlled


    Element    Midside Nodes
    Dropped


    Sizing


    Size Function
    Curvature


    Relevance    Center
    Coarse


    Initial Size    Seed
    Active Assembly


    Smoothing
    Medium


    Transition
    Slow


    Span Angle    Center
    Fine


    Curvature Normal    Angle
    Default    (18.0°)


    Min Size
    Default (2.1147e-004 m)


    Max Face Size
    Default (2.1147e-002 m)


    Max Tet Size
    Default (4.2294e-002 m)


    Growth Rate
    Default    (1.20)


    Automatic Mesh    Based Defeaturing
    On


    Defeature Size
    Default (1.0573e-004 m)


    Minimum Edge Length
    0.125660m


    Inflation


    Use Automatic Inflation
    None


    Inflation Option
    Smooth Transition


    Transition    Ratio
    0.272


    Maximum Layers
    5


    Growth Rate
    1.2


    Inflation Algorithm
    Pre


    View Advanced    Options
    No


    Assembly Meshing


    Method
    None


    Advanced


    Number of CPUs    for Parallel Part Meshing
    Program Controlled


    Straight Sided Elements


    Number of Retries
    0


    Rigid Body Behavior
    Dimensionally Reduced


    Mesh Morphing
    Disabled


    Triangle    Surface Mesher
    Program Controlled


    Topology    Checking
    No


    Pinch    Tolerance
    Default (1.9032e-004 m)


    Generate Pinch    on Refresh
    No


    Statistics


    Nodes
    62586


    Elements
    58480


    Mesh Metric
    None
Table 2: Properties of the mesh.
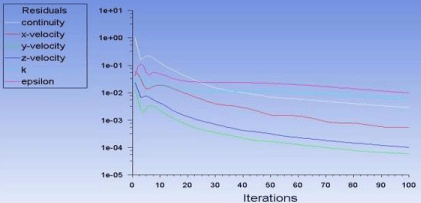
Figure 8: Variables and iteration values.
Mesh Quality:
Minimum Orthogonal Quality = 5.24182e-01
(Orthogonal Quality ranges from 0 to 1, where values close to 0 correspond to low quality).
Maximum Ortho Skew = 3.00198e-01
(Ortho Skew ranges from 0 to 1, where values close to 1 correspond to low quality).
Maximum Aspect Ratio = 6.47206e+00
Allocating 101x101=10201 pixel map.
8087 pixels filled, area = 0.0080756
Area of surfaces (6 0 1 5 9 7 8 2 3 4) projected onto plane (0, 0, 1): 0.008075604
In the reference values section the area used was calculated numerically it was calculated to be 3ft2 or 0.27m2. The mode and method of the numerical calculations will be discussed later in the mathematical modeling section. After the iterations were completed successfully and the solution converged some plots were plotted to represent the solution and the given data (Figure 8).
The following are the graphical representation of the results obtained from the calculations as a result. Different quantities such as dynamic pressure, velocity and density throughout the membrane are represented in the form of X-Y plots.
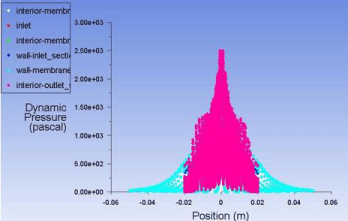
Figure 9: Plot of dynamic pressure vs position of molecules.
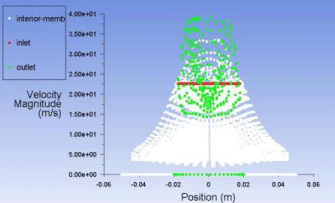
Figure 10: Plot of velocity magnitude vs. the position of molecule inside the membrane.
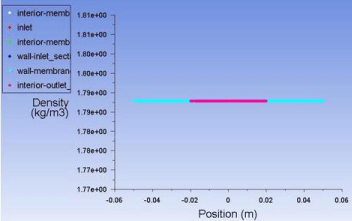
Figure 11: Plot of density vs. position inside the membrane.
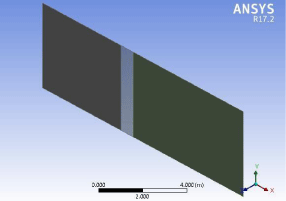
Figure 12: Geometry of a single layer of membrane.
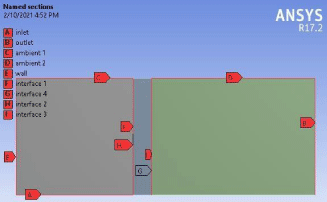
Figure 13: Visual representation of the named sections.
Plot for dynamic pressure (Figure 9)
Plot for velocity magnitude (Figure 10)
Plot for density (Figure 11)
Second simulation (simulating a single membrane layer and demonstrating its separating action)
The first step was to design a structure for the membrane for that we draw the geometry single layer of the membrane fiber in order to demonstrate its action and mode of working it consists of three parts (Figure 12).
Meshing of this geometrical structure
After drawing the basic geometrical shape the next step is meshing the structure but before meshing the structure named section have to be created for this membrane. The named sections are represented by the image below (Figure 13).
After the naming sections were named meshing was done using the standard meshing method with size structure set as curvature and relevance center set as fine.
Setup and solution
Again for the setup and solution the solver employed was pressure based solver and the velocity formation was absolute. The model used to solve this was viscous-SST k-omega. To demonstrate the separation action the material selected for fluid was a mixture of air and CO2 and for the solid it was again ash solid i.e. carbon based graphite (Figure 14).
After defining the mesh interface and selecting the porosity inlet and outlet the system solution was initialized. The iterations performed by the solver are illustrated in the figure given above.
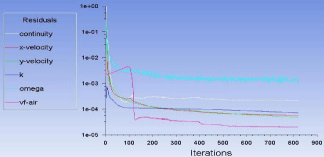
Figure 14: Variables and iterations.
Mathematical Modeling
The polymeric membranes used in most commercial applications operate on the solution-diffusion mechanism. The selection of the right polymeric membrane material for a given gas separation generally depends on the (i) cost, (ii) selectivity, (iii) permeability, (iv) process ability, (v) chemical, mechanical, and thermal stability, (vi) availability of material and (vii) glass (Table 3) [28].
For the mathematical modeling we used equations and data from a research publication and calculated the area of membrane analytically.
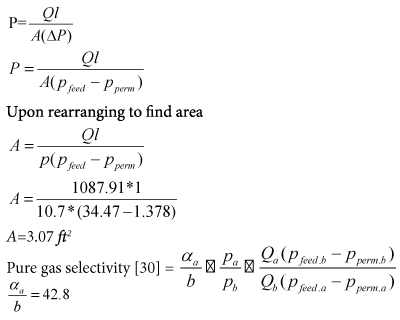
The membrane we have selected is PI (polyimide) membrane. To find area of membrane the equation employed was
Pure gas permeability [28]

Where
P = pure gas permeability coefficient
Q = flowrate
A = area of membrane
??? = pressure difference across the membrane
Pfeed & Pperm = feed and permeate pressure
l = thickness of the membrane layer
    Polymer
    Permeability at 30 1C/Barrer
    Selectivity
    Tg/1C


    H2
    N2
    O2
    CH4
    CO2
    H2-CO2
    CO2-CH4


    CA
    2.63
    0.21
    0.59
    0.21
    6.3
    0.41
    30
    80


    EC
    87
    8.4
    26.5
    19
    26.5
    3.33
    1.39
    43


    PC
    -
    0.18
    1.36
    0.13
    4.23
    -
    32.5
    150


    PDMS
    550
    250
    500
    800
    2700
    0.2
    3.38
    123


    PI
    28.1
    0.32
    2.13
    0.25
    10.7
    2.63
    42.8
    317


    PMP
    125
    6.7
    27
    14.9
    84.6
    1.49
    5.75
    30


    PPO
    113
    3.81
    16.8
    11
    75.8
    1.49
    6.89
    210


    PSf
    14
    0.25
    1.4
    0.25
    5.6
    2.5
    22.4
    190
Table 3: Permeability and selectivity of polymeric membranes for gas separations [29].
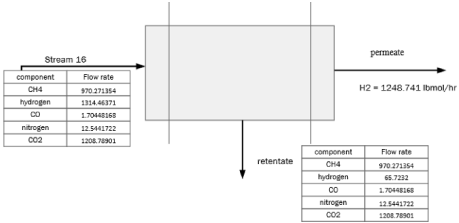
Figure 15: Material balance around the membrane.
The feed and permeate flowrate are determined by performing a material balance around the membrane (Figure 15).
From the table mentioned Table 3 above we know the permeability of CH4 and CO2 because we are finding the area of membrane required for CH4 and CO2 separation.
Feed flowrate = 2259.0216lbmol/hr
Permeate flowrate = 1087.91lbmol/hr
Feed pressure [30] = 500 psia = 34.5 bar
Permeate pressure [30] = 20 psia = 1.37 bar
Efficiency of a PI membrane [30] = 90%
Results
The results obtained are represented separately for the two CFD simulations and are represented through plotted graphs and graphical representations through contours and streamlines.
Results from the first simulation
The pressure profile of the whole membrane is observed as CO2 moves down the membrane a drop in pressure is observed because of the area of membrane and the structure the molecules are pulled apart creating a pressure drop across the membrane (Figure 16).
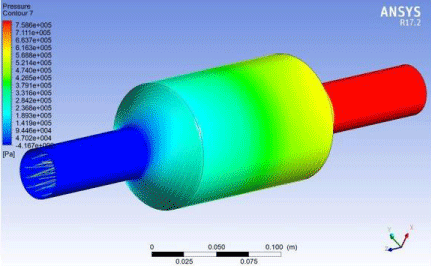
Figure 16: Pressure profile of CO2 molecules inside the membrane.
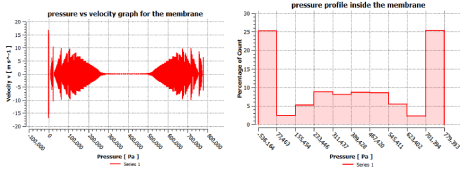
Figure 17: Pressure profile of the membrane.
To observe it graphically we can plot the data as a plot of velocity of CO2 molecules vs the pressure of the molecules inside the membrane to analytically observe the geometry and shape is capable of creating the pressure drop required. Upon obtaining the plot from the values obtained as a result of the solution of simulation we observe that the molecules have high pressure while entering the inlet zone and as soon as they enter the permeating membrane part a sudden pressure drop is observed and that pressure drop remains constant until the gas molecules reach the outlet section. In the outlet section we observe a rise in pressure again due to the decrease in cross sectional area of the membrane and thus this situation creates a pressure drop across the body of the membrane. So our designed membrane is capable of creating the necessary pressure drop required for the separation operation.
Now to check the pressure range of our designed membrane we have to obtain the pressure profile of the whole membrane for that we will plot a bar graph to check the pressure profile of the membrane so we can determine the range which is operable (Figure 17).
The operating pressure we selected for the permeate was 20 psia which is well within range of our modeled membrane separating unit. From this graphical data we have evidence that our modeled membrane can fulfill the required pressure conditions to perform the desired separation.
Now we have to account for the residence time can our modeled membrane provide enough time for the molecules for separation to take place effectively. For this we develop a contour of velocity vector of molecules inside the membrane and the contour of wall shear the molecules face from the membrane walls.
Results from the second simulation
The first simulation was done to design and model the membrane structure now that we have designed and modeled the membrane and proven through results that it is feasible and fulfills the required separation conditions we perform another simulation to demonstrate how the membrane actually selectively separates CO2 from a mixture of gases.
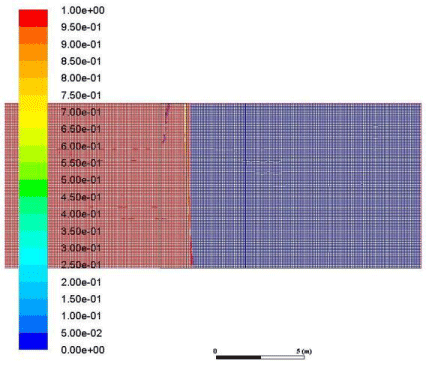
Figure 18: Volume fraction of air across the membrane.
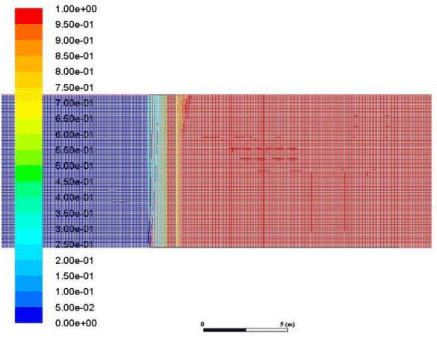
Figure 19: Volume fraction of CO2 across the membrane.
These results demonstrate how the membrane selectively separates CO2 from the rest of a gaseous mixture. A mixture of CO2 and air is used to perform this demonstration first we will demonstrate the volume fraction of air on both sides of the membrane. We used air to demonstrate this because air is a mixture of several gases of different density and different characteristics so separating CO2 from air is a tough task to perform and an excellent challenge to demonstrate the membrane action (Figure 18).
As we can observe from the volume fraction of air obtained from the results that upon passing a mixture of air and CO2 from the membrane the air is on the inlet and the intersection part of the membrane but in the outlet part the volume fraction of air is O. there is some amount of air near the interface on the outlet side but the quantity is not enough to cause some appreciable effect on the process.
This is evidence that the membrane did not allow the air molecules to pass through the interface although very minute quantity of air did pass through the membrane but it is not in appreciable amount.
Now we have to demonstrate that the CO2 was selectively separated for that we generate a graphical representation the volume fraction of CO2 across both sides of the membrane and the interface (Figure 19).
This volume fraction of CO2 is the assurance of our membrane course of action. Upon obtaining the volume fraction of the CO2 across the membrane we can observe that the CO2 molecules have passed from the interface of the membrane and travelled to the outlet side. There is some amount of CO2 present on the side of air molecules this is why because the efficiency of separation of the membrane was 90% so all the CO2 could not pass through the interface section. These results demonstrate the working action of the membrane and proof that it is indeed capable of selectively capturing CO2 from a mixture of gases.
Conclusion
In this research paper we have discussed how a membrane can be used for the separation of carbon dioxide from the post combustion gaseous mixture. We have used the membrane in a post combustion carbon capture arrangement in an integrated gasification combined cycle power plant. To prove the applicability of our idea we have designed and modeled the membrane on ansys workbench and proved that it is a feasible solution and the design can fulfill the required operating conditions, then we further used ansys to demonstrate the separating action of membrane to demonstrate how the membrane selectively separates CO2 from a mixture of different gases. This design is not just limited to power plant emissions this design can be used to capture carbon emissions in a variation of industrial applications. For each industrial application the material of membrane will have to be changed to suite best according to composition of the emitted gaseous mixture but the design and course of action will remain the same. This membrane can be used as a tool to drive the industrial emission sources towards emissions that have no part in increasing the carbon footprint that industries have caused in the past. Carbon Capture and storage is the best resistance against global warming.
References
- Ciferno JP, Fout TE, Jones AP, Murphy JT. Capturing carbon from existing coal-fired power plants. Chem Eng Prog. 2009; 105: 33-41.
- Herzog HJ. What future for carbon capture and sequestration? Environ Sci Technol. 2001; 35: 148-153.
- Belaissaoui B, Willson D, Favre E. Post-combustion carbon dioxide capture using membrane processes: A sensitivity Analysis. Procedia Eng. 2012; 44: 1191-1195.
- Göttlicher G, Pruschek R. Comparison of CO2 removal systems for fossil-fuelled power plant processes. Energy Convers Manag. 1997; 38: 173-178.
- Budzianowski WM. An oxy-fuel mass-recirculating process for H2 production with CO2 capture by autothermal catalytic oxyforming of methane. Int J Hydrogen Energy. 2010; 35: 7454-7469.
- Brunetti A, Scura F, Barbieri G, Drioli E. Membrane technologies for CO2 separation. J Memb Sci. 2010; 359: 115-125.
- Husain S, Koros WJ. Mixed matrix hollow fiber membranes made with modified HSSZ-13 zeolite in polyetherimide polymer matrix for gas separation. J Memb Sci. 2007; 288: 195-207.
- Zhao L, Weber M, Stolten D. Comparative investigation of polymer membranes for post-combustion capture. Energy Procedia. 2013; 37: 1125-1134.
- Sugiura K, Takei K, Tanimoto K, Miyazaki Y. The carbon dioxide concentrator by using MCFC. J Power Sources. 2003; 118: 218-227.
- Campanari S, Chiesa P, Manzolini G, Bedogni S. Economic analysis of CO2 capture from natural gas combined cycles using Molten Carbonate Fuel Cells. Appl Energy. 2014; 130: 562-573.
- Blum L, Deja R, Peters R, Stolten D. Comparison of efficiencies of low, mean and high temperature fuel cell Systems. Int J Hydrogen Energy. 2011; 36: 11056-11067.
- Wee JH. Molten carbonate fuel cell and gas turbine hybrid systems as distributed energy resources. Appl Energy. 2011; 88: 4252-4263.
- Zhang H, Lin G, Chen J. Performance analysis and multi-objective optimization of a new molten carbonate fuel cell system. Int J Hydrogen Energy. 2011; 36: 4015-4021.
- Amorelli A, Wilkinson MB, Bedont P, et al. An experimental investigation into the use of molten carbonate fuel cells to capture CO2 from gas turbine exhaust gases. Energy. 2004; 29: 1279-1284.
- Lusardi M, Bosio B, Arato E. An example of innovative application in fuel cell system development: CO2 segregation using Molten Carbonate Fuel Cells. J Power Sources. 2004; 131: 351-360.
- Campanari S, Chiesa P, Manzolini G. CO2 capture from combined cycles integrated with Molten Carbonate Fuel Cells. Int J Greenh Gas Control. 2010; 4: 441-451.
- Wee JH. Contribution of fuel cell systems to CO2 emission reduction in their application fields. Renew Sustain Energy Rev. 2010; 14: 735-744.
- Xu G, Liang F, Yang Y, Hu Y, Zhang K, Liu W. An improved CO2 separation and purification system based on cryogenic separation and distillation theory. Energies. 2014; 7: 3484-3502.
- Xu N, Li X, Franks MA, Zhao H, Huang K. Silver-molten carbonate composite as a new high-flux membrane for electrochemical separation of CO2 from flue gas. J Memb Sci. 2012; 401-402: 190-194.
- Songolzadeh M, Soleimani M, Takht Ravanchi M, Songolzadeh R. Carbon dioxide separation from flue gases: A technological review emphasizing reduction in greenhouse gas emissions. Sci World J. 2014; 2014.
- Zhao Y, Shen Y, Ma G, Hao R. Adsorption separation of carbon dioxide from flue gas by a molecularly imprinted adsorbent. Environ Sci Technol. 2014; 48: 1601-1608.
- Yu CH, Huang CH, Tan CS. A review of CO2 capture by absorption and adsorption. Aerosol Air Qual Res. 2012; 12: 745-769.
- Ã CC, Rubin ES. CO2 control technology effects on IGCC plant performance and cost. Energy Policy. 2009; 37: 915-924.
- Songolzadeh M, Soleimani M, Takht Ravanchi M, Songolzadeh R. Carbon dioxide separation from flue gases: A technological review emphasizing reduction in greenhouse gas emissions. Sci World J. 2014; 2014.
- Baxter L, Baxter A, Burt S. Cryogenic CO2 Capture as a Cost-Effective CO2 Capture Process. Int J Hydrogen Energy. 2011; 36: 10355-10365.
- Sridhar S, Bee S, Bhargava S. Membrane-based Gas Separation: Principle, Applications and Future Potential. Chem Eng Dig. 2014; 1: 1-25.
- Younas K, Hayat K, Asif M. Thermodynamic evaluation of IGCC (Integrated Gasification Combine Cycle) power plant using thar coal. Proc 2015 12th Int Bhurban Conf Appl Sci Technol IBCAST. 2015: 419-427.
- Basu S, Khan AL, Cano-Odena A, Liu C, Vankelecom IFJ. Membrane-based technologies for biogas separations. Chem Soc Rev. 2010; 39: 750-768.
- Koros W. Membrane Technology in the Chemical Industry SP Nunes and KV Peinemann (Eds.), Wiley-VCH, Weinhim, 2001, 299 Pp. 2001; 194: 277.
- Learning M, Cookbook R. Separation Process Principles. Chemical and Biochemical Operations.