Editorial
Austin Chromatogr. 2014;1(2): 3.
Assessing Venom: Antivenin Binding Using Sizeexclusion High Performance Liquid Chromatography
Charles G Sanny*
Department of Biochemistry and Microbiology, Oklahoma State University, USA
*Corresponding author: Charles G Sanny, Department of Biochemistry and Microbiology, Oklahoma State University Center for Health Sciences, 1111 W. 17th Street, Tulsa, USA
Received: August 29, 2014; Accepted: September 12, 2014; Published: September 17, 2014
Editorial
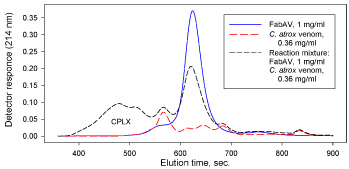
Size-Exclusion Chromatography (SEC) separates molecules based primarily on their size (e.g. hydrated volume in aqueous solutions). 1Larger components in a sample will elute earlier than smaller ones. This chromatographic method has many applications in assessing the magnitude of molecular interactions where the formation of larger molecular aggregates can be identified in mixtures as a shift in the SEC elution profile. Size-Exclusion High-Performance Liquid Chromatography (SE-HPLC) has been shown to be a useful tool in evaluating antigen-antibody interactions [1-5] including interactions of snake venoms with commercially available antivenin [6-9]. Figure 1 (unpublished data) is an example where a sample of western diamondback rattlesnake (Crotalus atrox) venom was mixed with a commercially available antivenin (Crotalidae Polyvalent Immune Fab (Ovine), Protherics; FabAV) used in the treatment of snake bites from North American pit vipers. Formation of high molecular weight venom: antivenin immune Complexes (CPLX) is accompanied by a proportional decrease in the antivenin region of the profile. The chromatography system and chromatographic method is summarized in Table 1.
Figure 1: SE-HPLC elution profiles of antivenin (FabAV), venom (C. atrox), and corresponding venom: antivenin mixture.
    Pump:
    Waters (Milford, MA) Model 515 HPLC pump


    Injector:
    Waters 717plus Autosampler


    Column:
    Bio-Sil SEC 250-5 (300 x    7.8 mm) size-exclusion column (Bio-Rad Laboratories)


    Detector:
    Waters 2996 Photodiode    Array Detector


    Column temperature:
    25oC (room    temperature).


    Elution buffer:
    0.05 M sodium phosphate (pH    7.4), 0.15 M sodium chloride


    Flow rate:
    1 ml/min.


    Injection volume:
    20 ml.


    Detector response:
    recorded using Waters data    acquisition hardware and software (Empower).


    Data acquisition rate:
    1/sec.
Table 1: Chromatography system and chromatographic method.
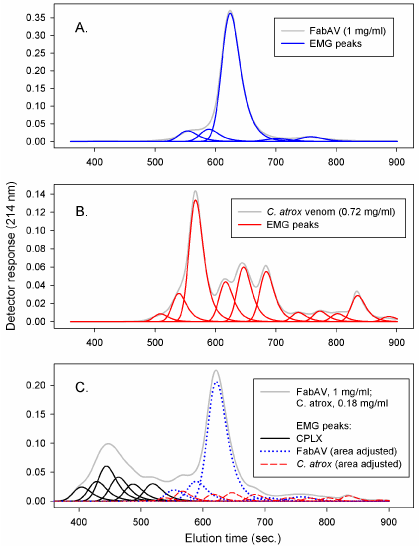
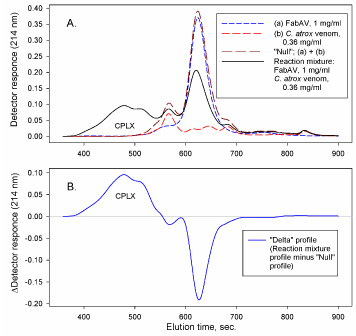
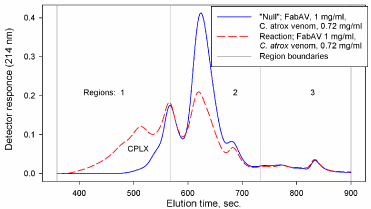
Various methods can been used to quantitate changes in the elution profiles based on control profiles compared to reaction profiles. The methods include empirical fit of a series of Exponentially Modified Gaussian (EMG) peak functions [3], constructing “synthetic” (“null”) and “delta” profiles [1,2], and sectioning profiles into distinct regions [8,9]. The methods are illustrated in Figures 2, 3 and 4.
Figure 2: EMG peaks: A. antivenin (FabAV): B. venom (C. atrox); C. venom: antivenin mixture.
Figure 3: A. antivenin (FabAV), venom (C. atrox), “synthetic” (“null”), and reaction mixture profiles; B. “Delta” profile.
Figure 4: Elution profile regions for integration.
Fitting elution profiles to peak functions (e.g. EMG, Figure 2) is limited by the uncertainty of where individual components may actually elute from the column. The method does, however, allow an empirical evaluation of profile changes where control and reaction mixture components may overlap. Constructing “synthetic” (“null”) profiles and “delta” profiles (Figure 3) provides a visual demonstration of the shift in elution profiles from lower molecular weight reactants to higher molecular weight aggregates. The increase in aggregate absorbance would, theoretically, be equal in magnitude to the decrease in reactant absorbance. A careful construction of “synthetic” (“null”) profiles aligned with reaction mixture profiles is required in order to generate the “delta” profile. Sectioning of profiles into distinct regions (Figure 4) allow the use of “null” profile regions to represent the theoretical profile of a venom: antivenin mixture where there is no interaction between components. Integration of the area under the elution profiles of “null” and reaction mixtures in each region (Figure 4) provides a quantitative estimate of CPLX formation (i.e. reaction CPLX region area – “null” CPLX region area: ΔArea1, or “null” antivenin region area – reaction antivenin region area: ΔArea2). The alignment of elution profiles is not as critical when using the region area method. Simply measuring peak height can provide an estimate of changes in component binding. Measuring peak height, however, assumes that peak shapes remain constant. Column performance can change, however, over an extended time of use. Profile areas are influenced less than peak heights by small changes in column performance (e.g. peak width could increase, peak height decrease, but peak area would not necessarily change).
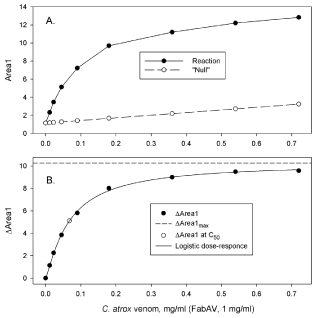
Changes in elution profiles can be used to estimate binding parameters such as C50 (concentration of reactant at half maximum binding) and ΔAreamax (maximum change in areas due to venom; antivenin binding). Figure 5A illustrates a dose response of region 1 area (CPLX, Area1) at constant FabAV (1 mg/ml) and varying concentrations of C. atrox venom (0-0.72 mg/ml). The increase in region 1 area due to CPLX formation, i.e. ΔArea1 (Figure 5B), was fit to a logistic dose-response function of the form:
A. Region 1 areas (Area1) of reaction mixture profiles and “Null” profiles;
B. ΔAreas of region 1 (ΔArea1).
Figure 5:A. Region 1 areas (Area1) of reaction mixture profiles and “Null” profiles;
B. ΔAreas of region 1 (ΔArea1).
ΔArea1= ΔArea1max{1/[1+(C/C50sf]}
Where C is the concentration of venom (mg/ml) and sf is a scale factor. This type of analysis has been used to compare binding parameters of FabAV and western diamondback rattlesnake, prairie rattlesnake, southern copperhead, and western cottonmouth venom [9].
SE-HPLC has an advantage over some other chromatographic methods. SE-HPLC can be performed under conditions, such as pH and ion concentrations, that preserve the native structure and binding characteristics of venoms and antivenins. Reverse phase HPLC, which is a valuable tool in venomics, often requires low pH and high organic phase eluants which can alter protein structure and function. Ion-exchange chromatography has been used to separate venom components, but has not specifically been applied to venom: antivenin binding studies. Ultra High Performance Liquid Chromatography (UHPLC) can enhance resolution and decrease data acquisition time and is available in size-exclusion column formats. UHPLC does, however, require specialized HPLC systems that can accommodate the higher pressures and special requirements to minimize extra-column effects.
In summary, SE-HPLC is a method that is readily available and can be applied using common HPLC system components. Samples can be analyzed under conditions that preserve the structure and function of antigens and antibodies. Immune complex formation can be quantified, and dose-response parameters can be determined that reflect binding affinity (e.g. C50) and maximum antibody reactivity (e.g. maximum CPLX area).
Footnotes
1Gel-Permeation Chromatography (GPC) is another term used for size-exclusion chromatography when primarily organic solutes, such as organic polymers, are analyzed using organic eluants.
References
- Stevens FJ, Carperos WE, Monafo WJ, Greenspan NS. Size-exclusion HPLC analysis of epitopes. J Immunol Methods. 1988; 108: 271-278.
- Stevens FJ. Size-exclusion high-performance liquid chromatography in analysis of protein and peptide epitopes. Methods Enzymol. 1989; 178: 107-130.
- Sanny CG, Price JA. Analysis of antibody-antigen interactions using size- exclusion high-performance (pressure) liquid chromatography. Anal. Biochem. 1997; 246: 7-14.
- Sanny CG, Price JA. Analysis of antibody-antigen interactions in mixtures containing reactive and nonreactive components using size-exclusion high-performance (pressure) liquid chromatography. Anal. Biochem. 2001; 295: 57-65.
- Sanny CG. Antibody-antigen binding study using size-exclusion liquid chromatography. J Chromatogr B Analyt Technol Biomed Life Sci. 2002; 768: 75-80.
- Price JA, Sanny CG. Chromatographic assessment of polyvalent antivenom activity. Res. Com. Pharm. Tox. 1997; 2: 51-67.
- Sanny CG, Benton RE, Price JA. Analysis of snake venom and antivenin interactions using size-exclusion HPLC. Pandalai SG, editor. In: Recent Research Developments in Analytical Biochemistry. Transworld Research Network. 2003; 3: 53-60.
- Price JA, Sanny CG. CroFabtrade mark total anti-venom activity measured by SE-HPLC, and anti-PLA (2) activity assayed in vitro at physiological pH. Toxicon. 2007; 49: 848-854.
- Sanny CG. In vitro evaluation of total venom–antivenin immune complex formation and binding parameters relevant to antivenin protection against venom toxicity and lethality based on size-exclusion high-performance liquid chromatography. Toxicon. 2011; 57: 871-881.
