
Research Article
Austin Chromatogr. 2015;2(2): 1031.
Stability-Indicating HPTLC Method for Simultaneous Quantification of Moxonidine and Amlodipine Besylate in Their Combined Pharmaceutical Dosage Form
Sindhav JR, Chhalotiya UK*, Shah DA, Mehta FA and Bhatt KK
Indukaka Ipcowala College of Pharmacy, India
*Corresponding author: Chhalotiya UK, Indukaka Ipcowala College of Pharmacy, Beyond GIDC, P.B. No. 53, and Vitthal Udyognagar- 388 121, Gujarat, India
Received: February 19, 2015; Accepted: April 20, 2015; Published: April 28, 2015
Abstract
A sensitive, selective and precise high performance thin layer chromatographic method has been developed and validated for simultaneous determination of moxonidine and amlodipine besylateboth as a bulk drug and in formulation. The method employed TLC aluminium plates pre-coated with silica gel 60F-254 as stationary phase while the solvent system was methanol: toluene: ethyl acetate: ammonia (10% v/v) (2: 3.5: 5: 1, v/v/v/v). The Rf values of moxonidine and amlodipine besylate were observed to be 0.46 ± 0.05 and 0.28 ± 0.03, respectively. The densitometric analysis was carried out in absorbance mode at 237 nm. The linear regression analysis data for the calibration plots showed a good linear relationship for moxonidine and amlodipine besylate over a concentration range of 100-3500 ng/band and 200–3500 ng/band, respectively. The method was validated for precision, robustness and recovery. The limit of detection and limit of quantification for moxonidine and amlodipine besylate were found to be 45.69 and 138.44 ng/band, 27.60 and 83.63ng/band respectively. Moxonidine and amlodipine besylate stock solutions were subjected to acid and alkali hydrolysis, chemical oxidation, dry heat degradation and photo degradation. The degraded product peaks were well resolved from the pure drug peak with significant difference in their Rf values. Stressed samples were assayed using developed HPTLC method. Sstatistical analysis showed that the method is repeatable, selective, and precise. Degradation products produced as a result of stress studies did not interfere with the detection of moxonidine and amlodipine besylate and the assay can thus be considered stability-indicating.
Keywords: Moxonidine; Amlodipine Besylate; High Performance Thin layer Chromatography; Stability study; Validation
Abbreviations
MOXO: Moxonidine; AML: Amlodipine besylate
Introduction
Moxonidine (MOXO) is a white or almost white powder. Chemically it is 4-chloro-N-(4,5-dihydro-1H-imidazol-2-yl)-6- methyl-2-methylpyrimidin-5-amine (Figure 1A) [1]. It is a selective agonist at the imidazoline receptor subtype 1 (I1) and therefore causes a decrease in sympathetic nervous system activity and therefore a decrease in blood pressure [2]. Amlodipine Besylate (AML) is white or almost white powder. Chemically, it is 3-ethyl 5-methyl (4RS)-2-[(2-aminoethoxy) methyl]-4-(2-chlorophenyl)- 6methyl-1,4-dihydropyridine-3,5-dicaarboxylate benzene (Figure 1: B). It is Freely soluble in methanol, sparingly soluble in ethanol (90 per cent), slightly soluble in 2-propanol and in water [3]. Amlodipine Besylatea calcium channel blocker class of drug and so it protect the tissue by inhibiting the entrance of calcium into cardiac and smooth muscle cells of the coronary and systemic arteriolar vasodilator that cause a decrease in smooth muscle tone and vascular resistance [4]. The combination of MOXO and AML is indicated in the treatment of hypertension.
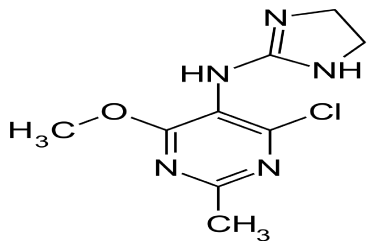
Figure 1a: Chemical Structure of MOXO.
Literature survey revealed that Moxonidine can be estimated by spectrophotometry [5], liquid chromatographic methods [6-11] and by HPTLC [12] individually or in combination with other drugs, and Amlodipine Besylate can be estimated by spectrophotometry [13-15], liquid chromatographic methods [16-19] and by HPTLC [20-23] individually or in combination with other drugs. LC/MS/MS method has been reported for the estimation of AML in API [24].
To our knowledge, no article related to the HPTLC determination of MOXO and AML in pharmaceutical dosage forms has appeared in the literature.Present study involves development of a high performance thin layer liquid chromatographic method for the determination of MOXO and AML in combination dosage form. A major advantage of HPTLC is its ability to analyze several samples simultaneously using a small quantity of mobile phase. This reduces the time and cost of analysis, minimizes exposure risks, and significantly reduces disposal problems of toxic organic solvents, thereby reducing the possibilities of environment pollution.
The aim of the present work was to develop an accurate, repeatable, and specific HPTLC method for the determination of MOXO and AMLboth as a bulk drug and in formulation.There is no HPTLC method reported for the estimation of MOXO and AML in combination so attempt have been made to develop stability indicating HPTLC method. The proposed method was validated according to ICH guidelines [25] and its updated international convention.
Experimental
HPTLC instrument
The samples were applied in the form of a bands of width 6 mm with a Camag 10 μl sample syringe (Hamilton, Switzerland) using CamagL inomat 5 (Switzerland) sample applicator on precoated silica gel aluminum plate 60 F254, (10 cm x 10 cm with 0.2 mm thickness, E. Merck, Germany). Camag TLC scanner was used for the densitometric scanning of the developed chromatogram. All the drugs and chemicals were weighed on Mettler Toledo electronic balance (ME 204, Mumbai, India).
Chemicals and reagents
Analytically pure MOXO and AML were obtained as gift samples from Sun Pharmaceutical Pvt. Ltd., Baroda, India. AR grade methanol, toluene, ethyl acetate were obtained from E. Merck Ltd., Mumbai, India while analytical reagent ammonia was obtained from S. D. Fine chemicals, Mumbai, India. Tablet formulation (Moxovas A, Macleods pharmaceuticals Ltd, Himachal Pradesh, India) containing labeled amount of 0.2 mg of moxonidine and 5 mg of amlodipine besylate were purchased from local market.
Chromatographic system
Sample application: Standards and formulation samples of MOXO and AML were applied on the TLC plates in the form of narrow bands of 6 mm length, 10 mm from the bottom and left edge, and with 9 mm distance between two bands. Samples were applied under a continuous drying stream of nitrogen gas.
Mobile phase and development: Plates were developed using a mobile phase consisting of methanol: toluene: ethyl acetate: ammonia (10% v/v) (2:3.5:5:1, v/v/v). Linear ascending development was carried out in a twin-trough glass chamber equilibrated with the mobile phase vapors for 20 min at 25 0C ± 2 0C. Ten milliliters of the mobile phase (5 mL in the trough containing the plate and 5 mL in the other trough) was used for each development and was allowed to migrate a distance of 80 mm. After development, the TLC plates were dried completely.
Densitometric analysis: Densitometric scanning was performed in the absorbance mode under control by win CATS planar chromatography software. The source of radiation was the deuterium lamp, and bands were scanned at 237 nm. The slit dimensions were 5 mm length and 0.45 mm width, with a scanning rate of 20 mm/s. Concentrations of the compound chromatographic were determined from the intensity of diffusely reflected light and evaluated as peak areas against concentrations using a linear regression equation.
Preparation of standard stock solution: Stock solutions were prepared by accurately weighing 10 mg of MOXO and 10 mg of AML transferring to 10 mL volumetric flask containing a few mL of methanol. The flask was swirled to dissolve the solids. Volume was made up to the mark with methanol to yield a solution containing 1000 μg/mL of MOXO and 1000 μg/mL of AML. Aliquot from the stock solution of MOXO and AML were appropriately diluted with mobile phase to obtain working standard solution of 100 g/mL of MOXO and 100μg/mL of AML.
Validation
Validation of the developed HPTLC method was carried out according to the International Conference on Harmonization (ICH) guidelines Q2 (R1) [25].
Linearity of calibration curves: Linearity of the method was evaluated by constructing calibration curves at eight concentration levels over a range of 100 – 3500 ng/band for MOXO and 200 – 3500 ng/band for AML. The calibration curves were developed by plotting peak area versus concentration (n = 5) with the help of the win CATS software.
Accuracy: The accuracy of the method was determined by calculating recoveries of MOXO and AML by method of standard additions. Known amount of MOXO (0, 250, 500, 750 ng/band) and AML (0, 500, 1000, 1500ng/band) were added to a pre quantified sample and the amount of MOXO and AML were estimated by measuring the peak area and by fitting these values to the straightline equation of calibration curve.
Precision: Precision was evaluated in terms of intraday and interday precisions. Intraday precision were determined by analyzing sample solutions of MOXO and AML at three levels covering low, medium, and high concentrations of the calibration curve three times on the same day (n = 3). Interday precision was determined by analyzing sample solutions of MOXO and AML at three levels covering low, medium, and high concentrations over a period of 3 days (n = 3). The peak areas obtained were used to calculate mean and RSD values.
Repeatability of measurement of peak area were determined by analyzing MOXO (100, 1500 and3500 ng/band) and AML (200, 1500 and 3500ng/band) sample seven times without changing the position of plate.
Specificity: The specificity was estimated by spiking commonly used excipients (starch, talc and magnesium stearate) into a pre weighed quantity of drug. The chromatogram was taken by appropriate dilutions. Developed spot area and Rf value of MOXO and AML were determined and effect of interfering compound was investigated.
Sensitivity: Sensitivity of the method was determined with respect to LOD and LOQ. Noise was determined by scanning a blank band (methanol) six times. A series of concentrations of drug solutions for MOXO100–3500ng/band and for AML200-3500 ng/band were applied on a plate and analyzed to determine LOD and LOQ. LOD was calculated as 3 times the noise level, and LOQ was calculated as 10 times the noise level. LOD and LOQ were experimentally verified by diluting the known concentrations of MOXO and AML until the average responses were approximately 3–10 times the SD of the responses for six replicate determinations.
LOD and LOQ were calculated using the following equation as per ICH guidelines:
LOD = 3.3 × σ/S
LOQ = 10 × σ/S
Where, σ is the standard deviation of y-intercepts of regression lines and S is the slope of the calibration curve.
Robustness: Small changes in the chamber saturation time, and solvent migration distance were introduced, and the effects on the results were examined. Robustness of the method were determined in triplicate at a concentration level of 1000 ng/band for MOXO and 1000 ng/band for AML, and the mean and RSD of peak areas were calculated.
Analysis of marketed formulations: Twenty tablets were weighed accurately and finely powdered. Tablet powder equivalent to 2mg of MOXO and 50 mg of AML were accurately weighed and transferred to a 10 mL volumetric flask. A few mL (5 mL) of methanol was added to the above flask and flask was sonicated for 5 min. The solution was filtered using Whitman filter paper No.1 in another 10 mL volumetric flask and volume was diluted to the mark with the methanol. 1 mL aliquot from the above solution was taken in 10 mL volumetric flask and diluted to mark with mobile phase to obtain final concentration of 20μg/mL for MOXO and 500μg/mL for AML was obtained. 7μl of these solutions were applied to TLC plates and analyzed for MOXO and AML content using the proposed method as described earlier. The possibility of interference from other components of the tablet formulation in the analysis was studied. From the developed chromatogram spot area and Rf values were determined.
Forced degradation study
Stress degradation study using acid and alkali hydrolysis, chemical oxidation, wet hydrolysis exposure to sun light and dry heat degradation was carried out and interference of the degradation products was investigated. MOXO and AML were weighed (10 mg) and transferred to 10 ml volumetric flasks and expose to different stress conditions.
Heat induced alkali hydrolysis: To the 10 ml volumetric flask, 10 mg of MOXO and AML were taken and 2 ml of 0.1 N NaOH was added to perform heat induced base hydrolysis. The flask was heated at 80°C for 1hrand allowed to cool to room temperature. Solution was neutralized with 0.1 N HCl and volume was made up to the mark with methanol to make final concentration of 1000μg/mL for both MOXO and AML.
Heat induced acid hydrolysis: To the 10 ml volumetric flask, 10 mg of MOXO and AML was taken and 2 ml of 0.1 N HCl was added to perform heat induced acid hydrolysis. The flask was heated at 80°C for 15 minutes and allowed to cool to room temperature. Solution was neutralized with 0.1 N NaOH and volume was made up to the mark with methanol to make final concentration of 1000μg/mL for both MOXO and AML.
Heat induced oxidative stress degradation: To heat induced perform oxidative stress degradation, 10mg of MOXO and AML were taken in 10 ml volumetric flask and 2 ml of 3% hydrogen peroxide was added. The mixture was heated in a water bath at 80°C for 2 hrs and allowed to cool at room temperature and volume was made up to the mark with methanol to make the final concentration of 1000μg/ mL for both MOXO and AML.
Dry heat degradation: Analytically pure 10 mg sample of MOXO and AML were exposed in oven at 80°C for 2 hrs. The solids were allowed to cool and transferred to volumetric flasks (10 ml) and dissolved in few ml of methanol. Volume was made up to the mark with the methanol to make the final concentration of 1000μg/mL for both MOXO and AML.
Photolytic (UV light) degradation: To study the photostability of MOXO and AML, Analytically pure 10 mg of drug were exposed to ultra violet light for 24 hrs. The solids were allowed to cool and transferred to volumetric flask (10 ml) and dissolve in few ml of methanol. Volume was made up to the mark with the methanol to make the final concentration of 1000μg/mL for both MOXO and AML.
From the final concentration of all the solutions, 2000 ng/band was applied on the TLC plates and chromatograms were recorded.
Results and Discussion
Optimization of the mobile phase
To develop the HPTLC method of analysis of MOXO and AML for routine analysis, selection of the mobile phase was carried out on the basis of polarity. A mobile phase that would give a dense and compact band with an appropriate Rf value for MOXO and AML were desired. Various mobile phases such as methanol–toluene, toluene– ethyl acetate, methanol – ethyl acetate, methanol – toluene – ethyl acetate – ammonia, were evaluated in different proportions. A mobile consisting of methanol: toluene: ethyl acetate: ammonia (10%, v/v) (2:3.5:5:1, v/v/v/v) gave good separation of MOXO and AML from its matrix. It was also observed that chamber saturation time and solvent migration distance were crucial in the chromatographic separation as chamber saturation time of less than 20 min and solvent migration distances greater than 80 mm resulted in diffusion of the analyte band. Therefore, methanol: toluene: ethyl acetate: ammonia(10% v/v) (2:3.5:5:1, v/v/v/v)mobile phase with a chamber saturation time of 20 min at 25 0C and solvent migration distance of 80 mm was used. These chromatographic conditions produced a well-defined, compact band of MOXO and AML with optimum migration at Rf0.46 and 0.28, respectively (Figure 2).
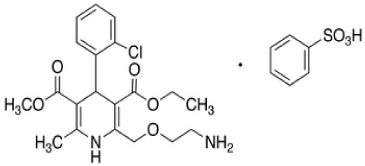
Figure 1b: Chemical Structure of AML.
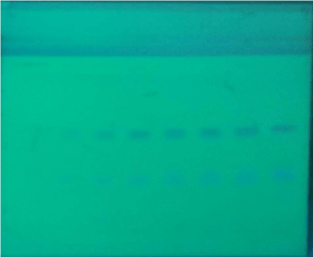
    Figure 2:  Developed TLC plate of calibration of MOXO (100-3500 ng/band)
and AML (200-3500 ng/band).
Validation
Linearity and calibration curves: Linearity of an analytical method is its ability, within a given range, to obtain test results that are directly, or through a mathematical transformation, proportional to the concentration of the analyte. The method were found to be linear in a concentration range of 100–3500 ng/band (n = 5) for MOXO and 200 – 3500 ng/band (n= 5) for AM with respect to peak area. Figure 3 displays a three-dimensional overlay of HPTLC densitograms of the calibration bands of MOXO and AML at 237 nm. The regression data shown in Table 1 reveal a good linear relationship over the concentration range studied, demonstrating the suitability of the method for analysis.
    Parameters
    Moxonidine
    Amlodipine Besylate


    Linearity (ng/band)
    100-3500
    200-3500


    Correlation    coefficient( r2)
    0.996
    0.997


    Slope of regression    equation
    3.152
    2.310


    Standard deviation    of slope
    0.032
    0.037


    Intercept of    regression
    1038
    622.6


    Standard deviation    of intercept
    43.63
    19.32
Table 1: Regression analysis of calibration curve.
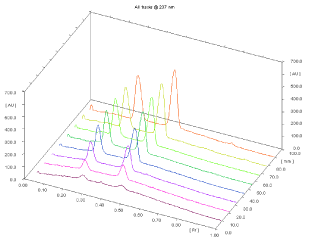
    Figure 3:  3D densitogram of calibration of MOXO (100-3500 ng/band) and
AML (200-3500 ng/band).
Accuracy: Accuracy of an analytical method is the closeness of test results to the true value. It was determined by the application of analytical procedure to recovery studies, where a known amount of standard is spiked into pre-analyzed samples solutions. Results of the accuracy studies from excipients matrix are shown in Table 2; recovery values demonstrated the accuracy of the method in the desired range.
    %    Level
    Amount    Added
      (ng/band)
    Amount    Recovered
      (ng/band)    (n=3)
    %    Recovered ± S.D.


    MOXO
    AML
    MOXO
    AML
    %MOXO
    %AML


    0
    500 + 0
    1000 + 0
    508.74
    1026.09
    101.74 ± 1.90
    102.60 ± 1.49


    50
    500 + 250
    1000 + 500
    744.64
    1477.92
    98.92 ± 2.51
    97.79 ± 2.14


    100
    500 + 500
    1000 + 1000
    1011.61
    1999.01
    102.32 ± 2.69
    99.90 ± 2.77


    150
    500 + 750
    1000 + 1500
    1239.96
    2530.53
    97.99 ± 2.93
    103.05 ± 2.26
Table 2: Accuracy Study.
Precision: The precision of an analytical method expresses the degree of scatter among a series of measurements obtained from multiple sampling of the same homogeneous sample under prescribe conditions. Intraday precision refers to the use of an analytical procedure within a laboratory over a short period of time by the same operator with the same equipment, whereas interday precision involves estimation of variations in analysis when a method is used within a laboratory on different days. The results obtained are shown in Table 3. In all instances, RSD values were less than 5%, confirming the precision of the method. Repeatability of the scanning device was studied by applying and analyzing MOXO sample (100, 1500 and 3500ng/band) and AML sample (200, 1500 and 3500ng/band) seven times of each concentrations. RSD was less than 5% (Table 4), which was well below the instrumental specifications.
    Drug
    Concentration
      (ng/band)
    Precision    (%RSD) (n=3)


    Intraday
    Intraday


    Mean ±    S.D
    %RSD
    Mean ±    S.D
    %RSD


    AMLO
    200
    983.8 ± 21.34
    2.17
    1002.66 ± 29.03
    2.89


    1500
    4022.2 ± 110.45
    2.74
    4074.46 ± 71.42
    1.75


    3500
    8500.53 ± 143.402
    1.68
    8699.4 ± 194.03
    2.23


    MOXO
    100
    1002.93 ± 24.51
    2.44
    1022.83 ± 19.60
    1.91


    1500
    5910.16 ± 117.23
    1.98
    5873.46 ± 145.13
    2.47


    3500
    11777.16 ± 195.96
    1.66
    11777.16 ± 223.84
    1.90
Table 3:  3D densitogram of calibration of MOXO (100-3500 ng/band) and
AML (200-3500 ng/band).
    Parameters
    Moxonidine
    Amlodipine Besylate


    Linearity ( ng/band)
    100-3500
    200-3500


    Retention factor
    0.46±0.05
    0.28±0.03


    Detection limit ( ng/band)
    45.69
    27.60


    Quantitation limit ( ng/band)
    138.44
    83.63


    Accuracy (%)
    97.99-101.74
    97.79-103.05


    Precision (%RSD)


    Intra-day (n = 3)
    1.67-2.44
    1.69-2.74


    Inter-day (n = 3)
    1.90-2.47
    1.75-2.90


    Repeatability    (%RSD) (n=7)


    Lower concentration
    0.93
    0.92


    Medium concentration
    0.52
    0.86


    Higher concentration
    0.96
    0.74


    Specificity
    Specific
    specific
Table 4: Summary of validation parameters of HPTLC.
Limit of detection and limit of quantification: Under the experimental conditions used, the lowest amount of MOXO and AML that could be detected (LOD) were found to be 46.69ng/band and 27.60ng/band, and the lowest amount of MOXO and AML that could be quantified (LOQ) were 138.44ng/band and 83.63ng/band.
Specificity: Specificity is the ability of an analytical method to determine the analyte unequivocally in the presence of sample matrix. There were no interfering peak at the Rf value of MOXO and AML from excipients added in the synthetic formulation. In addition, there was no interference from excipients present in the commercial formulation, thereby confirming the specificity of the method.
Robustness: The low values of RSD (Table 5) obtained after introducing small, deliberate changes in parameters of the developed HPTLC method confirmed its robustness.
    Method    Parameters/ Condition
    Normal    Value
    Deliberate    Changes
    %RSD    (Rf)


    MOXO
    AML


    Mobile    Phase ratio
      (MeOH:Toluene:EthyleAcetate:Ammonia(10%    v/v)
    2:3.5:5:1
    2:4:4.5:1
    2.27
    2.76


    2:3:5.5:1
    1.55
    2.60


    Chamber    saturation time
      (min.)
    20 min
    10 min
    2.74
    1.97


    30 min
    3.87
    2.92


    Temperature
    25±2 °C
    18°C
    1.87
    2.92


    Wavelength
    237 nm
    239 nm
    1.09
    1.89


    235 nm
    1.62
    1.90
Table 5: Result of Robustness Studies.
Analysis of marketed formulation: Marketed formulation was analyzed using proposed method which gave percentage recoveries of 97.99-101.74 % for MOXO and 97.79-103.05 % for AML. A well resolved band at Rf 0.46 and 0.28 were observed in the chromatogram of MOXO and AML respectively, and no interference from the excipients present in the marketed tablet formulation was observed (Figure 4).
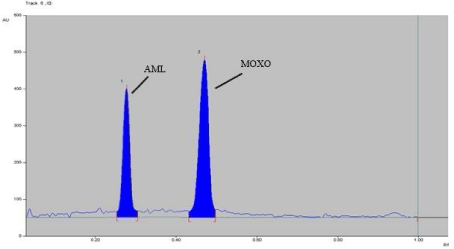
Figure 4: Densitogram of MOXO (2000 ng/band) and AML (2000 ng/band).
Forced degradation study: Chromatogram of base hydrolysis performed at 80° C for 1 hr reflux showed degradation of MOXO and AML with degradation product peak at retention factor (Rf) 0.48 and 0.34 respectively (Figure 5). Chromatogram of acid hydrolysis performed at 80° C for 15 minutes reflux showed degradation of MOXO and AML with degradation product peak at retention factor (Rf) 0.58and 0.26 respectively (Figure 6).
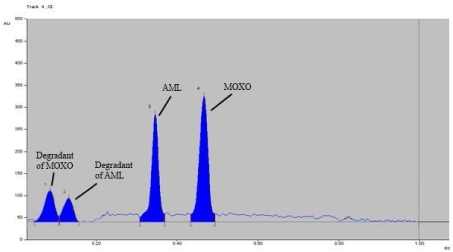
    Figure 5:  Densitogram of base hydrolysis (0.1 N NaOH) of MOXO (2000 ng/
band) and AML (2000 ng/band) for 1 hr. at 80°C.
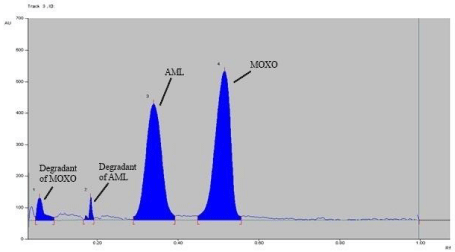
    Figure 6:  Densitogram of acid hydrolysis (0.1 N HCl) of MOXO(2000 ng/
band) and AML(2000 ng/band) for 15 min at 80°C.
The chromatogram oxidized MOXO and AML with 3% hydrogen peroxide at 80° C for 2 hrs reflux (Figure 7), expose to sun light for 24 hrs (Figure 8) and exposed to dry heat at 80° C for 2 hrs (Figure 9) showed degradation of MOXO and AML with degradation product were found to be stable (Figure 9).
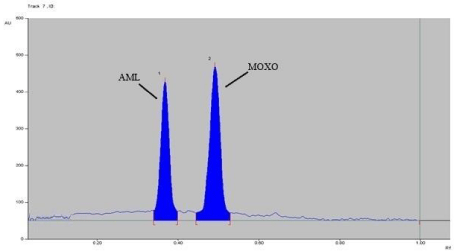
    Figure 7:  Densitogram of Oxidative (H2O2) degradation of MOXO(2000 ng/
band) and AML(2000 ng/band) for 2 hr. at 80°C.
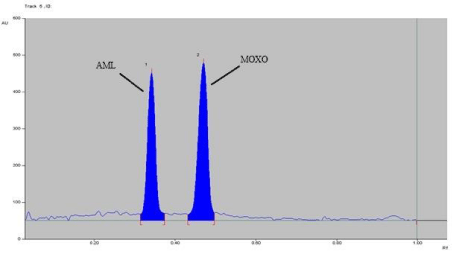
    Figure 8:  Densitogram of photo degradation of MOXO (2000 ng/band) and
AML (2000 ng/band) for 2 hr. at 80°C.
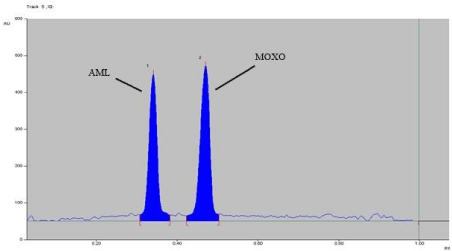
    Figure 9:  Densitogram of dry heat degradation of MOXO (2000 ng/band) and
AML (2000 ng/band) for 2 hr. at 80°C.
The degradation study thereby indicated that MOXO was found to be stable to oxidation (3% hydrogen peroxide), photo degradation and dry heat while it was susceptible to base hydrolysis and acid hydrolysis. The degradation peaks were well resolved from the drug peak and no degradation products from different stress conditions affected determination of MOXO which indicate that the method is selective and specific. The degradation study thereby indicated that AML was susceptible to base hydrolysis and acid hydrolysis, while it was found to be stable to oxidation (3% hydrogen peroxide), photo degradation and dry heat. The degradation peaks were well resolved from the drug peak and no degradation products from different stress conditions affected determination of AML which indicate that the method is selective and specific. The results of forced degradation study are shown in Table 6.
Table 6: Forced Degradation Study for MOXO and AML.
Conclusion
A validated stability-indicating TLC analytical method has been developed for simultaneous estimation of MOXO and AML in bulk and in their combined tablet dosage form. The results of stress testing undertaken according to the ICH guidelines revealed that the method is selective and stability-indicating. Both the drugs were found to be stable to forced degradation condition which shows no interference of degradants in simultaneous quantification of drugs. Statistical analysis proves that the method is suitable for the analysis of MOXO and AML as a bulk drug and in pharmaceutical formulation without any interference from the excipients and degradants.
HPTLC method requires short analysis time as compared to HPLC analysis. In HPTLC analysis, every time new stationary phase is used while in HPLC analysis a column which is previously used for other analysis is to be used. The method was successfully validated in accordance with ICH guidelines. The method can be used to determine the purity of drug available from various sources.
Acknowledgement
Authors are grateful to Sun Pharmaceutical Pvt. Ltd., Vadodara, India for providing gift sample of standard moxonidine and amlodipine besylate. The authors are very thankful to SICART and Indukaka Ipcowala College of Pharmacy, New Vallabh Vidyanagar, for providing necessary facilities to carry out research work.
References
- British Pharmacopoeia; British Pharmacopoeia Commission Office, London. 2011; 2: 4057-4058.
- Martindale, Extra Pharmacopoeia, 31st edn. Royal Pharmaceutical Society, London. 1996; 2739.
- Ministry of Health and Family Welfare, Government of India, Indian pharmacopoeia-2007 Published by The controller of publications Delhi. 2010; 266: 806-809.
- Dale MM, Rang HP, Titter JM, Moore PK. Pharmacology, 5th edn, Chaurchill Livingstone. 2003; 797.
- Solanki N, Chaudhary A. “Development and validation of UV spectroscopic method for Estimation of Moxonidine in Tablet dosage form”. Pharmatutor-Art. 2013; 11: 31.
- Zhao L, Ding L, Wei X. Determination of moxonidine in human plasma by liquid chromatography-electrospray ionisation-mass spectrometry. J Pharm Biomed Anal. 2006; 40: 95-99.
- Rudolph M, Janssen W, Strassner M. Determination of moxonidine (BDF 5895) in plasma by gas chromatography-negative ion chemical ionization mass spectrometry. J Pharm Biomed Anal. 1992; 10: 323-328.
- Milovanovic S, Otasevic B, Zecevic M, Zivanovic L, Protic A. Development and validation of reversed phase high performance liquid chromatographic method for determination of moxonidine in the presence of its impurities. J Pharm Biomed Anal. 2012; 59: 151-156.
- Patel DB, Mehta FA, Bhatt KK. “Simultaneous Estimation of Amlodipine Besylate and Indapamide in a Pharmaceutical Formulation by a High Performance Liquid Chromatographic (RP-HPLC) Method”. Sci Pharm. 2012; 80: 581–590.
- . Xing YR, Zhang HX, Guang Z. “HPLC Determination of Content and Content Uniformity of Moxonidine Hydrochloride Tablets”. Chin J Pharm Anal. 2003; 23: 109-110.
- Otasevic B, Milovanovic S, Zecevic M, Golubovic J, Protic A, “UPLC Method for Determination of Moxonidine and Its Degradation Products in Active Pharmaceutical Ingredient and Pharmaceutical Dosage Form”. Chromatographia. 2014; 77: 109-118.
- Kakde Rajendra, Gadpayale Kamlesh, Qureshi M. “Stability indicating HPTLC Method for Determination of Moxonidine in Pharmaceutical Preparations”. Int J Pharmtech Res. 2012; 4: 358.
- Thomas, JagaleAb, Dighe SB, Prajapati NA. “Simultaneous Spectrophotometric Estimation of Amlodipine Besylate and Telmisartan in tablet Dosage form”. Int J Pharm Tech Res. 2010; 2: 1334-1341.
- Prajapati JP, Patel MB, Prajapatic RJ, Prajapatic NA. “Simultaneous Determination of Perindopril Erbumine and Amlodipine Besylate by Absorption Factor Method”. Int J Appl Bio and Pharm Tech. 2011; 2: 230-233.
- Gajbhiye A, Dwivedi N. “Simultaneous Estimation of Nebivolol and Amlodipine by UV Spectrophtimetric Methos”. Current Trends in Tech. Sci. 2012; 1: 2279-0535.
- Sultan F, Shoaib MH, Yousuf RI, Ahmed FR, Salam FA, Nasiri MI, et al. Simultaneous quantitation of aspirin, amlodipine and simvastatin in a fixed dose combination of encapsulated tablet formulation by HPLC-UV method. Pak J Pharm Sci. 2014; 27: 1553-1558.
- Venkatesh J, Chowdary MS, Anuroop DH, Prasad VVLN, Reddy VAP. “Reverse Phase High Performance Liquid Chromatographic Estimation of Ramipril and Amlodipine in Pharmaceutical Dosage Form” Global J. Pharmacol. 2013; 7: 208-211.
- Bahrami G, Mirzaeei Sh. Simple and rapid HPLC method for determination of amlodipine in human serum with fluorescence detection and its use in pharmacokinetic studies. J Pharm Biomed Anal. 2004; 36: 163-168.
- Dongre VG, Shah SB, Karmuse PP, Phadke M, Jadhav VK. Simultaneous determination of metoprolol succinate and amlodipine besylate in pharmaceutical dosage form by HPLC. J Pharm Biomed Anal. 2008; 46: 583-586.
- Chabukwar AR, Jagdale SC, Kumbhar SV, Kadam VJ, Patil VD, Kuchekar BS, et al. “Simultaneous HPTLC Estimation of Telmisartan and Amlodipine besylate in tablet dosage form”. Scholars Research Lib. Archieves of Applied Sci Research. 2010; 2: 94-100.
- Asmita Y, Kamble, Mahadeo V, Mahadik, Laxman D, Khatal A. “Validated HPLC and HPTLC Method for Simultaneous Quntitation of Amlodipine besylate and OlmesartanMedoxomil in bulk drug and formulation”. Analytical Letters. 2010; 43: 251-258.
- Meyyanathan SN, Suresh B. HPTLC method for the simultaneous determination of amlodipine and benazepril in their formulations. J Chromatogr Sci. 2005; 43: 73-75.
- Rathee P, Rathee S, Thakur S, Kumar V. “Simultaneous estimation of Amlodipine Besylate and Lisinoprildihydrate as API and in tablet dosage forms by modified form of simultaneous equation method using derivative UV-spectrophotometry”. Int J Pharm Tech Res. 2010; 2: 556-562.
- Saxena D, Damale S, Joshi A, Datar A. “Forced Degradation Studies of Amlodipine Besylate and Characterization of Its Major Degradation Products By Lc-ms/Ms”. IJLBPR. 2014; 3: 196-207.
- Peinado A, Hammond J, Scott A. Development, validation and transfer of a near infrared method to determine in-line the end point of a fluidized drying process for commercial production batches of an approved oral solid dose pharmaceutical product. J Pharm Biomed Anal. 2011; 54: 13-20.