
Research Article
Austin Chromatogr. 2015;2(2): 1033.
Development of Liquid Chromatographic Method for Estimation of Ondansetron and Ranitidine in Combined Dosage Form
Patel PJ, Shah DA*, Mehta FA and Chhalotiya UK
Department of Pharmaceutical Chemistry and Analysis, Indukaka Ipcowala College of Pharmacy, India
*Corresponding author:Shah DA, Department of Pharmaceutical Chemistry and Analysis, Indukaka Ipcowala College of Pharmacy, India
Received: March 25, 2015; Accepted: May 18, 2015; Published: May 26, 2015
Abstract
Isocratic, reversed phase liquid chromatographic method was developed for the quantitative determination of Ondansetron and Ranitidine in combined dosage form. A Phenomenex Luna C18, 5 μm column with mobile phase containing methanol: water (60:40) was used. The flow rate was 1.0 ml/min and analytes were monitored at 299 nm. The retention times of ondansetron and ranitidine were 9.9 min and 5.5 min, respectively. The linearity for ondansetron and ranitidine were in the range of 0.05-10 μg/ ml and 0.05 - 60 μg/ ml, respectively. The proposed method was validated with respect to linearity, accuracy, precision, specificity and robustness. Stock solution was subjected to acid and alkali hydrolysis, chemical oxidation, dry heat degradation and photo degradation stability assessment. The method was successfully applied to the estimation of ondansetron and ranitidine in combined dosage form.
Keywords: Ondansetron; Ranitidine; RP-HPLC; Validation; Degradation studies
Abbreviations
OND: Ondansetron; RAN: Ranitidine; LC: Liquid Chromatography
Introduction
Ondansetron (OND) is chemically, 9-Methyl-3-[(2-methyl-1Himidazol- 1-yl) methyl]-1,2,3,9-tetrahydro-4H-carbazol-4-one. The empirical formula of OND is C18H19N3 and it has a molecular weight of 293.37g/mole [1], (Figure 1). The OND 5-HT3 Receptor antagonists are the primary drugs used to treat and prevent chemotherapy-induced nausea and vomiting [2]. Ranitidine (RAN)is chemically N-(2-[(5- [(dimethylamino)methyl]furan-2-yl)methylthio]ethyl)-N’-methyl- 2-nitroethene-1,1-diamine; dimethyl [(5-{[(2-{[1-(methylamino)-2- nitroethenyl]amino}ethyl)sulfanyl]methyl}furan-2-yl)methyl]amine. It has an empirical formula of C13H22N4O3S and a molecular weight of 314.4 g/mole [1], (Figure 2). RAN is a histamine-H2 receptor antagonist. RAN is used to reduce the amount of acid secreted by the stomach which subsequently reduces ulcer and heartburn pain. It is used to treat stomach and duodenal ulcer and Gastroesophageal reflux Disease [2]. The clinical study proved that the combination of OND and RAN is effective in reducing the incidence of nausea and vomiting [3].
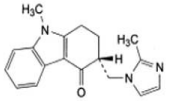
Figure 1: Chemical structure of ondansetron.

Figure 2: Chemical structure of ranitidine.
Both the drugs are official in Indian Pharmacopoeia, British Pharmacopoeia and United States Pharmacopoeia [4-6]. A literature survey regarding quantitative analysis of these drugs revealed that attempts have been made to develop analytical methods for the estimation of OND alone and in combination with other drugs by Spectrophotometric method [7-9], HPLC [10,11] and HPTLC [12] methods. Literature survey revealed that Spectrophotometric method [13,14], HPLC [15-17] and HPTLC [18] have been reported for the estimation of RAN.
There are two HPLC [19,20] and Spectrophotometric method [21], reported for the estimation of OND and RAN in combined dosage form. Present study involves development and validation of stability indicating liquid chromatographic method for the estimation of OND and RAN in combined dosage form.
Experimental
Apparatus
The liquid chromatographic system consist of Perkin Elmer series 200 equipped with a UV/Visible detector, and manual injector Rheodyne valve with 20 μL fixed loop. The analytes were monitored at 299 nm. Chromatographic analysis was performed on Phenomenex Luna C18 column having 250 mm× 4.60 mm i.d. and 5 micron particle size. All the drugs and chemicals were weighed using a Mettler Toledo electronic balance (ME204/A04, METTLER TOLEDO Group, Mumbai, India).
Reagents and materials
Analytically pure OND and RAN were obtained as gift samples from Bogs India Pvt. Ltd, Mumbai, India and Cadila Pharmaceutical, Dholka, India, respectively. HPLC grade methanol and water were obtained from SRL Ltd., Mumbai, India. Triple distilled water obtained from Milli Q water purification system was used throughout the process. Tablet formulation (Zaneka Pharmaceutical (P) Limited.) containing labeled amount of 4 mg of ONDand 150 mg of RAN was used for the study.
Chromatographic conditions
The Phenomenex Luna C18 column equilibrated with mobile phase methanol: water (60:40) was used. The flow rate was maintained at 1 ml/min, analytes were monitored with UV detector at 299 nm and the injection volume was 20 μL. Total run time was kept at 15 min.
Preparation of standard stock solutions
OND and RAN were weighed (10 mg each) and transferred to two separate 10 ml volumetric flasks and dissolved in few ml of mobile phase. Volumes were made up to the mark with mobile phase to yield a solution containing 1000 μg/ml of OND and RAN, respectively. Aliquot from the stock solutions of OND and RAN were appropriately diluted with mobile phase to obtain working standard of 100 μg/ml of OND and RAN, respectively.
Method validation
The method was validated for accuracy, precision, linearity, detection limit, quantitation limit and robustness.
Linearity
Appropriate aliquots of OND and RAN working standard solutions were taken in different 10 ml volumetric flasks and diluted up to the mark with mobile phase to obtain final concentrations of 0.05, 0.1, 0.5, 1, 5, 10 μg/ml of OND and 0.05, 0.1, 1, 5, 20,60 μg/ml of RAN, respectively. The solutions were injected using a 20 μL fixed loop system and chromatograms were recorded. Calibration curves were constructed by plotting average peak area versus concentrations and regression equations were computed for both the drugs.
Precision
The repeatability studies were carried out by estimating response of OND (0.5 μg/ml) and RAN (1 μg/ml) six times and results are reported in terms of relative standard deviation. The intra-day and inter-day precision studies (intermediate precision) were carried out by estimating the corresponding responses 3 times on the same day and on 3 different days for three different concentrations of OND (0.1, 1, 10 μg/ml) and RAN (0.1, 5, 60 μg/ml), and the results are reported in terms of relative standard deviation.
Accuracy
The accuracy of the method was determined by calculating recoveries of OND and RAN by method of standard additions. Known amount of OND (0, 0.96, 1.28, 1.60 μg/ml) and RAN (0, 24, 36, 48 μg/ ml) were added to a pre quantified sample solution, and the amount of OND and RAN were estimated by measuring the peak areas and by fitting these values to the straight-line equation of calibration curve.
Detection limit and quantitation limit
The Limit of Detection (LOD) is defined as the lowest concentration of an analyte that can reliably be differentiated from background levels. Limit of Quantification (LOQ) of an individual analytical procedure is the lowest amount of analyte that can be quantitatively determined with suitable precision and accuracy. LOD and LOQ were calculated using the following equations as per ICH guidelines.
LOD = 3.3 × σ /S; LOQ = 10 × σ /S; Where σ is the standard deviation of y-intercepts of regression lines and S is the slope of the calibration curve.
Robustness
Robustness of the method was studied by deliberately changing the experimental conditions like flow rate and percentage of organic phase.
Solution stability
Stability of sample solutions were studied at 25 ± 2°C for 24 h.
System suitability
A system suitability test was an integral part of the method development to verify that the system is adequate for the analysis of OND and RAN. System suitability test of the chromatography system was performed before each validation run. Five replicate injections of a system suitability standard were prepared. Area, Retention Time (RT), tailing factor, asymmetry factor, and theoretical plates for the five suitability injections were determined.
Specificity
Specificity study involves quantification of analyte in presence of impurities and excipients present in the formulations. To prove specificity of the method forced degradation studies was carried out. The International Conference on Harmonization (ICH) guidelines (Q2R1, 2005) require the implementation of stress testing procedures for the identification of degradation products that potentially occur in drug substances to help understand the possible degradation pathway for the drugs. A stock solution of 1000 μg/ml was used for both drugs in the study.
Alkali hydrolysis: To perform alkali degradation study, appropriate aliquots of stock solution of OND and RAN were taken in different 25 ml volumetric flask and 5 ml of 0. 1 N NaOH was added. The mixture was heated in a water bath at 70 to 80° C for 1 h. and allowed to cool to room temperature before the solutions were neutralized with 0.1N HCl and diluted to volume with mobile phase.
Acid hydrolysis: To perform acid degradation study, appropriate aliquots of stock solution of OND and RAN were taken in different 25 ml volumetric flask and 5 ml of 1 N HCl was added. The mixture was heated in a water bath at 70 to 80° C for 1 h. and allowed to cool to room temperature before the solutions were neutralized with 1 N NaOH and diluted to volume with mobile phase.
Oxidative stress degradation: To perform oxidative stress degradation, appropriate aliquots of stock solution of Ondansetron and Ranitidine were taken in different in 25 ml volumetric flasks and 5 ml of 3% hydrogen peroxide was added. The mixture was heated in a water bath at 70 to 80°C for 1 h. and allowed to cool to room temperature before diluting to volume with mobile phase.
Dry heat degradation: Analytically pure sample of OND and RAN was exposed in an oven at 80°C for 2 h. The solid was allowed to cool and 10 mg of OND and RAN was weighed, transferred to volumetric flasks (10 ml) and dissolved in a few ml of methanol. Volume was made up to the mark with the methanol.
Photo degradation: Analytically pure sample of OND and RAN was exposed to UV light for 24 h. The solid was allowed to cool and 10 mg of OND and RAN was weighed, transferred to volumetric flasks (10 ml) and dissolved in few ml of methanol. Volume was made up to the mark with the mobile phase.
Aliquot from the above solution were appropriately diluted with mobile phase to obtain working standards of 10 μg/ ml. This Solution was injected using a 20 μL fixed loop system and chromatograms were recorded.
Analysis of marketed formulation
Twenty tablets were weighed accurately and finely powdered. Tablet powder equivalent to 4 mg OND( and 150 mg of RAN) was taken in 25 ml volumetric flasks. Methanol was added to the flasks which were sonicated for 15 minutes. The solution was filtered using Whatman filter paper No.41 and diluted to volume with the mobile phase.
Appropriate volume of the aliquot was transferred to a 10 ml volumetric flask and the volume was made up to the mark with the mobile phase to obtain a solution containing 0.64 μg/ml of OND and 24 μg/ml of RAN. The solution was sonicated for 10 min. It was injected as per the above chromatographic conditions and peak areas were recorded. Quantitation was carried out using a calibration curve.
Results and Discussion
Optimization of mobile phase
The objective of the method development was to resolve chromatographic peaks for active drug ingredients with less asymmetric factor. The mobile phase methanol: water (60: 40 v/v) was found to be satisfactory and gave two symmetric and well-resolved peaks for OND and RAN. The retention time for OND and RAN were 9.9 min and 5.5 min, respectively (Figure 3). The resolution between OND and RAN was found to be 7.87, which indicates good separation of both the compounds. The asymmetric factors for OND and RAN were 1.49 and 1.39, respectively. The mobile phase flow rate was maintained at 1 ml/min. Overlay UV spectra of both the drugs showed that OND and RAN absorbed appreciably at 299 nm, so detection was carried out at 299 nm.
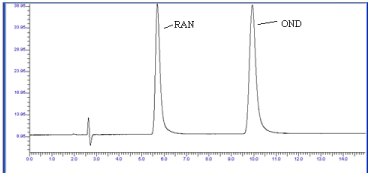
    Figure 3:  Chromatogram of OND and RAN (10 μg/ml) using mobile phase
(Methanol: Water) (60:40).
Method validation
Linearity and calibration curves: The calibration curve for OND was found to be linear in the range of 0.05-10 μg/ml with a correlation coefficient of 0.996. The calibration curve for RAN was found to be linear in the range of 0.05 - 60 μg/ml with a correlation coefficient of 0.994.
Precision: Instrument precision was determined by performing injection repeatability and the RSD values for OND and RAN were found to be 0.55 % and 0.91 %, respectively. The intra-day and interday precision studies were carried out and the results are reported in Table 1. The low RSD values indicate that the method is precise.
    Parameters
    OND
    RAN


    Linearity ( μg/ml)
    0.05-10
    0.05-60


    Retention Time (min)
    9.9
    5.7


    Detection limit ( μg/ml)
    0.016
    0.016


    Quantitation limit ( μg/ml)
    0.050
    0.050


    Accuracy (%)
    99.52–101.68
    96.29-97.58


    Precision (%RSD)


    Intra-day (n = 3)
    0.96-1.82
    1.81-1.84


    Inter-day (n = 3)
    1.01-1.80
    1.44-1.98


    Instrument precision(%RSD)
    0.55
    0.91
Table 1: Summary of validation parameters.
Accuracy: The accuracy of the method was determined by calculating recoveries of OND and RAN by method of standard addition. The recoveries were found to be 99.52%–101.68% and 96.29%-97.58% for OND and RAN respectively (Table 2). The high values indicate that the method is accurate.
    Drug
    Amount of drug in sample (μg/ml)
    Conc. of
      pure drug
      spiked
      (μg/ml)
    Total
      conc.
      (μg/ml)
    Mean total Conc.
      found
      (n=3)
      (μg/ml)
    %Recovery
      mean (n=3) ± SD
    % RSD


    OND
    0.64
    0
    0.64
    0.65
    101.68±0.377
    0.371


    0.32
    0.96
    0.96
    100.10±0.117
    0.117


    0.64
    1.28
    1.27
    99.52±0.107
    0.107


    0.96
    1.60
    1.60
    100.24±0.132
    0.132


    RAN
    24
    0
    24
    23.41
    97.58±0.636
    0.652


    12
    36
    35.11
    96.29±0.374
    0.389


    24
    48
    47.28
    97.03±0.532
    0.548


    36
    60
    59.28
    97.02±0.108
    0.112
Table 2: Accuracy study for the proposed method.
Limit of detection and limit of quantification: The detection limits for OND and RAN were found to be 0.016μg/ml and 0.016μg/ ml respectively, while quantitation limits were found to be 0.050μg/ml and 0.050μg/ml, respectively. The above data shows that a nano gram quantity of both the drugs can be accurately and precisely determined.
Forced degradation study: Forced degradation study was carried out to identify the possible degradation products of both the drugs. Acid and base hydrolysis, photo degradation, dry heat degradation and oxidative stress degradation studies were carried out and the degraded samples were analyzed by the developed method (Table 3).
    Condition
    Time
    %amount of drug found
      OND
    %amount of drug found
      RAN
    Retention time of degradation product of OND
    Retention time of degradation product of RAN


    Base 1 N NaOH, (70-80°C)
    1 hr
    98.89
    12.15
    -
    2.73


    Acid 1 N HCl,     (70-80°C)
    1 hr
    99.15
    86.36
    -
    3.28,3.87


    Oxidative degradation
      3% H2O2,  (70-80°C)
    1 hr
    97.38
    95.39
    -
    -


    Dry heat     (80°C)
    2 hr
    99.89
    99.75
    -
    -


    Photolytic
    24 hr
    99.28
    99.68
    -
    -
Table 3: Forced degradation study.
The chromatograph of the Base hydrolysis (1N NaOH) study showed that there is no degradation product of OND. The chromatograph of Base hydrolysis showed a degradation product of RAN with a retention time of 2.73. The study showed that OND is stable and RAN is unstable to Base hydrolysis study (Figure 4). The chromatograph of Acid hydrolysis (1N HCl) study showed that there is no degradation product of OND. The chromatograph of acid hydrolysis showed degradation products of RAN with retention times of 3.28, 3.87. The study showed that OND is stable and RAN is unstable to acid hydrolysis (Figure 5). The chromatograph of Oxidative hydrolysis study showed that there is no degradation product of OND and RAN indicating OND and RAN are stable toOxidative hydrolysis (Figure 6). Both drugs were found to be stable to Dry heat degradation (Figure 7). Both drugs were found to be stable to Photo degradation (Figure 8).
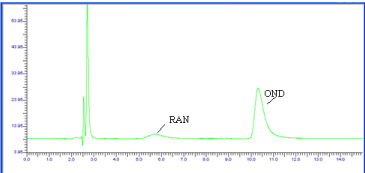
    Figure 4:  Chromatogram of OND and RAN Base (1N NaOH, 1 hr reflux)
degradation.
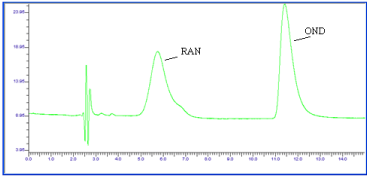
    Figure 5:  Chromatogram of OND and RAN Acid (1N HCl, 1 hr reflux)
degradation.
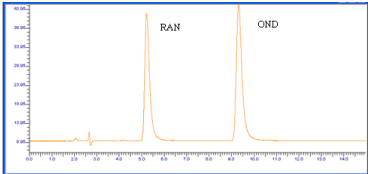
    Figure 6:  Chromatogram of OND and RAN Oxidative (3% H2O2, 1 hr reflux)
degradation.
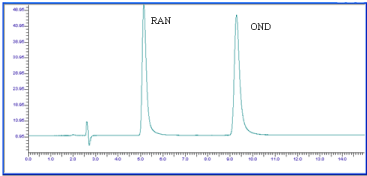
    Figure 7:  Chromatogram of OND and RAN dry heat degradation (Oven, 2
hr) .
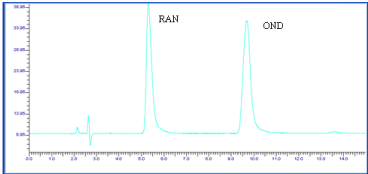
    Figure 8:  Chromatogram of OND and RAN Photo degradation (UV light, 24
hr) .
The degradation study indicated that OND was stable to base hydrolysis, acid hydrolysis, dry heat degradation, oxidative degradation and photo degradation. The degradation study indicated that RAN was stable to oxidative degradation, photo degradation, and dry heat degradation while it was susceptible to acid and base hydrolysis.
Robustness: Robustness study was performed by deliberately changing the experimental conditions; flow rate was varied from 1 ml/min to 0.8 ml/min and 1.2 ml/min. The composition of mobile phase was changed, varying the proportion of methanol by 5 %. For all parameters the recoveries of both the drugs were determined and the RSD was found to be less than 2%.
Solution stability: Stability of standard and sample solution of OND and RAN were evaluated at room temperature for 24 hr. Both the drugs were found to be stable with a recovery of more than 98%.
Analysis of marketed formulations: The proposed method was successfully applied to the determination of OND and RAN in their combined dosage form. The % recovery was found to be 101.68 ± 0.37 and 97.58 ± 0.65 for OND and RAN respectively, which were comparable with the corresponding labeled amounts (Table 4).
    Formulation
      (DOMAR-O)

    Amount drug taken (mg)

    Amount of drug found
    % Drug found ± SD*


    OND
    RAN
    OND RAN
    OND
    RAN


    4
    150
    0.64 23.41
    101.68±0.37
    97.58±0.63


    Mean ± Standard deviation (n=3); each tablet contains Ondansetron 4    mg and Ranitidine 150 mg
Table 4: Analysis of marketed formulation.
Conclusion
Present study involves development of RP-HPLC method for the estimation of RAN and OND in combined dosage form. The developed methods were validated and found to be accurate, precise, specific and robust. The literature survey revealed that HPLC methods [19,20] have been reported for the estimation of OND and RAN in combined dosage form. The reported methods uses buffer: acetonitrile and buffer: methanol as mobile Phase, respectively. The reported methods do not report stress studies. The developed method detailed in this manuscript uses methanol: water as a mobile phase which is simple to prepare and the method is more sensitive compared to reported method. The present study reports stress degradation study and the method can be used for the routine analysis of stability samples. The developed method was successfully applied to the estimation of drug in pharmaceutical dosage form.
Acknowledgment
The authors are thankful to Bogs India Pvt. Ltd. and Cadila Pharmaceutical Dholka, India for providing gift sample of OND and RAN respectively. The authors are very thankful to Principal, Indukaka Ipcowala College of Pharmacy, and New Vallabh Vidyanagar for providing necessary facilities to carry out research work.
References
- The Merck Index, 13th edn, Merck Research Laboratories, Division of Merck & Co.6848: 8110.
- Tripathi KD.Pharmacology, 6th edn, Jaypee Brothers Medical Publishers Pvt. Ltd. 2008; 632-647.
- Pezikoglo H, Fileli A, Vasilakos D, Karastergiou P, Tanidis A, Halvatzoulis E, et al. The Combination of Ondansetron – Ranitidine in the Prevention of Nausea and Vomiting, Intra Operatively for Patients Under Spinal Anesthesia. Regional Anesthesia & Pain Medicine. 2004; 29: 51.
- Ministry of health and family welfare, Government of India, Indian pharmacopoeia-2010. Published by the controller & publication, Delhi. 2010; 1819: 2045.
- British Pharmacopoeia; British Pharmacopoeia Commission Office, London, Volume-II. 2007; 1524-1525.
- United State Pharmacopoeia, National Formulary, The United States Pharmacopoeia Convention Inc, 27th edn, United States, Volume-II. 2004; 1359: 1624-1628.
- Patel S. “Derivative Spectrophotometric Method for Simultaneous Determination of Ondansetron and Omeprazole in Combined Dosage Form.” Int J Chem tech Appl. 2014; 3: 9-17.
- Rao K, JayachandranE, Usha M, Gopinath G, Venkata RD, Srinivasa Rao D, et al.“UV Spectrophotometric Method for Determination of Ondansetron Hydrochloride in Pure and Formulation.” Int J Pharm Sci. 2012; 4: 125-129.
- RaviKumar P, MuraliKrishna M, Bhanuprakash P, AnilKumar B, Madhusudhan P. Derivative Spectrophotometric Estimation of Ondansetron and Paracetamol. Eurassian J Chem. 2006; 3: 134-136.
- Putta RK, Udaya KT, Jitendra K, Salahyddin. HPLC Analytical Method Development and Validation Studies of Ondansetron and Rabeprazole. J Biomed Pharm Res. 2012; 1: 134-143.
- Panchal VU, Chauhan Ps. Simultaneous Development of Ondansetron HCL and Pantoprazole Sodium in their Bulk Dosage Form by Ratio Derivative Spectroscopy. Unique J Pharm Bio Sci. 2013; 1: 37-41.
- Mujtaba A, Kohli K, Ali J, Baboota S. Development of HPTLC Method for the Estimation of Ondansetron Hydrochloride in Bulk drug and Sublingual Tablets. Drug Testing and Analysis. 2011; 5: 122–125.
- Salve P, Gharge D, Kirtawade R, Dhabale P, Burade K. Simple Validated Spectroscopic Method for Estimation Of Ranitidine From Tablet Formulation. Int J Pharm Tech Res. 2010; 2: 2071-2074.
- Mishra A.N, Rana A.C. UV Spectrophotometric Determination of Ranitidine Hydrochloride in Pure and Pharmaceutical Formulation. Int J Chem Sci. 2009; 3: 2208-2210.
- Naresh M, Ganesh T,Biswal A, Reddy N. RP-HPLC Method Development and Validation studies of Ranitidine HCl and Domperidone. Int J Chem Natural Sci. 2013; 1: 25-28.
- Haque A, Shahriar M, Parvin N, Islam SMA. Validated RP-HPLC Method for Estimation of Ranitidine Hydrochloride, Domperidone and Naproxen in Solid Dosage Form. Asian J Pharm Anal. 2011; 1: 59-63.
- Dragica Z, Trajce S. Development of an HPLC Method for the Determination of Ranitidine and Cimetidine in Human Plasma Following SPE. J Pharm Biomed Anal. 2003; 33: 165-173.
- Simonovska B, Prosek M, Vovk I, Jelen-Zmitek A. High-performance thin-layer chromatographic separation of ranitidine hydrochloride and two related compounds.” J Chrom Biomed Sci App. 1998; 715: 425-430.
- Meyyanathan MN, Venkatesh DN, Krishnaveni N, Babu B, Jeyaprakash MR, Raja RB, et al. RP-HPLC Method For Simultaneous Estimation of Ondansetron and Ranitidine In Pharmaceutical formulation. Int J Health Allied Sci. 2012; 1: 129-132.
- Patel NM, Fursule RA, Shirkhedkar AA, Talele GS. Simultaneous estimation of ranitidine hydrochloride and ondansetron hydrochloride by reverse phase high performance liquid chromatography. Asian J Chem. 2006; 18: 2691-2694.
- Singhvi I, Pillali S. Spectrophotometric Simultaneous Estimation of Ranitidine hydrochloride and Ondansetron hydrochloride from tablet formulation. Ind J Pharm Sci. 2007; 69: 601-604.