
Research Article
J Dent & Oral Disord. 2017; 3(3): 1062.
Comparative In-Vitro Wear Resistance and Surface Roughness of Chairside CAD/CAM Materials
Shafter M*, Wicks R, Jain V and Nathanson D
Department of Prosthodontics, University of Tennessee Health Science Center, USA
*Corresponding author: Mohamed Shafter, Department of Prosthodontics, University of Tennessee Health Science Center, Memphis, USA
Received: April 19, 2017; Accepted: May 23, 2017; Published: May 30, 2017
Abstract
The purpose of the study: To evaluate the level of wear opposed human enamel and surface roughness of the chairside CAD/CAM restorative materials against human enamel.
Method: A traditional approach to measure in vitro wear, the pin and plate method was used for these studies. This method is a two-body abrasion test that directly compares materials that are juxtaposed. Plates of materials are set against each other horizontally at a fixed distance with an exact load in a wet environment for a certain number of cycles and preselected speed. Wear evaluation is performed by measuring the weight loss of each specimen and calculating the volume loss. The Surface Roughness (Ra) of each material was measured in μm using a portable surface roughness tester (Model SJ-201; Mitutoyo Corp. Japan) before the start of the test. The measurements were made using a set length of 2.5 mm.
Results: Volume loss (mm³) of Telio CAD=0.019058, Lava Ultimate Restorative=0.007738, Paradigm MZ100=0.004614, e.max CAD=0.002436, CERASMART=0.001486 and Vita VAD Temp=0.002333. Volume loss of (mm³) of enamel against Telio CAD=0.001366667, Lava Ultimate Restorative=0.005076667, Paradigm MZ100=0.035573333, e.max CAD=0.002130002, CERASMART=0.0005625and Vita VAD Temp=0.0062.
Conclusion: Telio CAD had the highest volume loss among tested materials with significant differences in abrasion to the enamel. CERASMART showed superior wear resistant characteristics when opposed by enamel. Enamel (stubs) showed no significant difference in volume loss when opposed CAD/ CAM tested materials.
Keywords: Human enamel; Wear resistance; Surface roughness
Introduction
Wear is defined as progressive loss of material from a solid surface as a result of the mechanical interaction between two touching and moving surfaces. Wear resistance is a critical physical property of artificial teeth used for restoration of the edentulous patient. Properties of good dental materials include durable materials, esthetic materials and non-abrasive to the opposing teeth. Previously dental clinicians believed that gold was ‘enamel friendly’ or non-abrasive, but the color of gold is considered by most to lack esthetic appeal [1]. Porcelain is durable, biocompatible and esthetically pleasing. However, many studies report that some porcelain brands are abrasive to opposing dentition [2-4].
Numerous research findings indicate that the wear of teeth and restorative materials is a complex and multifactorial phenomenon dependent on the interplay of mechanical, biological and chemical factors. These observations facilitate and improve our understanding of wear behavior and those factors that influence wear [5,6]. Additional studies are necessary to further develop and improve the wear resistance of restorative materials [7,8].
Braga RR et al., 2002 studied the in vitro abrasion and attrition wear of two dual-cure cements (in dual-cure and self-cure modes) and two RMGI cements when placed between ceramic and enamel to simulate the margin of a restoration. Rectangular specimens of Empress 2 were cemented between bovine incisors sectioned mesiodistally, using one of the following cements: Variolink II, RelyX Luting, RelyX ARC or ProTec CEM. A three-body wear test was performed in the Oregon Health Sciences University (OHSU) oral wear simulator for 100,000 cycles with abrasion load of 20N and attrition load was 90N). They concluded that the activation mode of resin cements did not influence their wear resistance. The resin modified glass ionmers underwent higher attrition wear than the resin cements [9,10].
A multi-center research study in 2005 by Heintze et al. tested the hypothesis that different wear measurement methods generate different material rankings. Ten restorative materials, eight composites (BelleGlass, Chromasit, Estenia, Heliomolar RO, SureFil, Targis cured at 95°C and 130°C, Tetric Ceram), an amalgam and a ceramic (Empress) were studied.
Five different wear measurement methods including IVOCLAR, ZURICH, MUNICH, OHSU, and ACTA were evaluated. Each research center involved in the blind study obtained unlabeled specimens, which Ivoclar Vivadent made from one batch. After completion of the wear tests, the raw data were sent to IVOCLAR for analysis. The statistical analysis of the data, the calculation of relative ranks of each material within each test center, measures of agreement between methods, the discrimination power and coefficient of variation of each method as well as measures of the consistency and global performance for each material. He concluded that IVOCLAR and ACTA were the best methods with respect to the coefficient of variation. The discrimination power of the ZURICH method was clearly inferior to that of the other methods. As the different wear simulator settings measure different wear mechanisms, it seems reasonable to combine at least two different wear settings to assess the wear resistance of a new material [11,7].
A study in 2001 by Kunzelmann investigated the wear of paradigm MZ100 compared to the ceramic CAD/CAM materials. The laboratory-processed IPS Empress ceramic, VitaBloc Mark II block and the composite mill block material MZ100 were tested in an artificial wear simulator with human enamel as the antagonistic material [12]. The specimens were subjected to 50,000 test cycles (1 cycle per second, 50 N) in distilled water. The wear of the material samples and of the opposing enamel was reported after 30,000 and 50,000 cycles with replicas, digitized, and evaluated with a 3D evaluation system. Loss of volume and height caused by wear were calculated. They did not find any significant difference between the ceramic materials in the amount of material or in the amount of antagonist (human enamel wear). The material wear of paradigm MZ100 differed significantly from Vita Mark II in volume loss. Regarding height loss, MZ100 showed a significantly higher wear than the other ceramic materials tested. The wear on the human enamel antagonist is similar for each of the ceramic materials. With MZ100 a significantly smaller amount of enamel wear was found when compared with Empress and Vita Mark II. The conclusion of the study was although the highest material wear, MZ100 had the lowest material wear rate. The laboratory-processed IPS Empress material had an obviously higher material wear rate than other CAD/ CAM materials [8,10,13].
The chairside CAD/CAM restorative materials are primarily classified into ceramics, composites and acrylics. Enamel wear is a concern when ceramics are used as the restorative material. Several factors may impact
how ceramics affect the enamel tooth structure. It is possible to decrease enamel wear by treating the surface with polish or glaze. A study by Delong et al. Compares the wear of MZ100 with two ceramics. They report the volume loss of enamel with a Paradigm MZ100 Block shows statistically significantly less enamel loss than enamel with Vita Mark II or ProCAD. In addition, the volume loss of the Paradigm MZ100 block against enamel shows statistically significantly less loss than Mark II or ProCAD. Several studies indicate that the wear of enamel against surface treated ceramic restorations was essentially the same as that for enamel against enamel.
Materials and Methods
Materials
- Paradigm MZ100 (MZ100)
- Vita CAD Temp (VCT)
- Telio CAD (TC)
- IPS e.max CAD (EM)
- Lava Ultimate Restorative (LUR)[14]
- CERASMART (CS)
Methods
A traditional approach to measure in vitro wear, the pin and plate method was used for these studies. This method is a two-body abrasion test that directly compares materials that are juxtaposed. Plates of materials are set against each other horizontally at a fixed distance with an exact load in a wet environment for a certain number of cycles and preselected speed. Wear evaluation is performed by measuring the weight loss of each specimen and calculating the volume loss.
Wear apparatus:
Upper part: The upper part is responsible for holding the enamel specimen or stubs. The stubs are mounted with sticky wax onto metal rods in the upper part. The enamel specimens are mounted on individual metal rods that are subsequently stacked in parallel. Then each rod is loaded with 400 grams to reproduce average forces observed in vivo. The rods holding the enamel are joined to a motor by an arm and a wheel designed to provide a back and forth movement over a distance of 10m. The metal rods carrying the enamel specimens were freely joined to the upper part of the wear test machine. They were able to move forward and backward, up and down and revolve at all times. Furthermore, the limited movement is side to side (Figure 1).
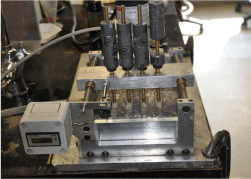
Figure 1: Custom made wear test apparatus.
Lower part: The lower part contains plates with various mounted materials (VCT, TC, LUR, MZ 100, EM and CS) that will oppose the enamel specimen stubs on the upper portion. This lower part was designed for running water to cover the specimens during the wear test. The container has a drain hole on the side to allow a continuous stream of running water to drain into a nearby sink. The flowing water minimizes contamination of the assay with third body particles. (Figure 2).
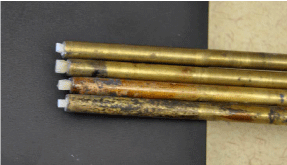
Figure 2: Enamel specimens of the lower surface of the metal rods.
Preparation of the material specimens: The Vita CAD Temp, MZ 100, Telio CAD, IPS e.max, Lava Ultimate Restorative and CERASMART materials were all set on the ISOMET 2000 Precision Diamond Saw. These materials were sectioned into blocks with multiple parallel-sides or disc specimens with thicknesses of 2.0 mm.
Specimens sectioned from the different materials were mounted on the wear test lower part metal plates. These metal plates containing the mounted specimens also function as specimen holders during polishing.
The specimens were polished using Buehler EcoMet 250 Grinder- Polisher (Buehler, Lake Bluff, Illinois) and graded diamond grits of 60, 45 and 15 μm in size in water and then with 6 and 1 μm polycrystalline diamond suspensions applied to special pads. All plates were dried for 24 hours in an oven (Boekel Oven) at 40°C. The weight of each metal plate with specimen was obtained using a digital balance (AB204-S, USA) before and after completion of the 50,000 wear test cycles (Figure 3).
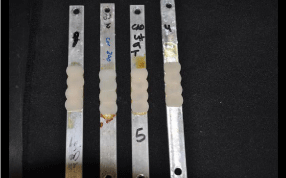
Figure 3: Material specimens fixed to the metal plates.
Preparation of the enamel specimens: Human enamel was the opposing material in this wear test. The enamel specimens in this study were derived from fresh extracted posterior teeth. Teeth were collected from perio and oral surgery clinics, then cleaned and stored in distilled water. Teeth were sectioned to a length of 10 mm by removing portions of the roots using a high speed hand piece with coolant water.
The coronal sections were embedded in 12 mm plastic cylinders containing epoxy. The metal stud was affixed with superglue to the plastic cylinder that held the coronal enamel. This enamel-containing configuration was mounted in the ISOMET 2000 Precision Saw. The enamel was sectioned into rectangular shapes (2 x 2 x 4 mm) under water as lubrication and with slow saw speeds. The enamel sections were fixed to the wear test machine metal rods using wax.
The enamel sections required unobstructed exposure to allow contact with opposing specimens in the wear test. Enamel sections mounted on metal rods were dried for 24 hours in a 50°C oven (Boekel, USA). The weight of each rod with mounted enamel sections was measured using a digital balance (AB204-S, USA) before and after completion of the wear test.
Wear test: Various material sections were mounted on metal plates and then the metal plates were inserted into the lower part of the wear test machine. The wear test includes 50,000 cycles (35 cycles/ minute) with a travelling distance of 10 mm under a constant load of 400 grams provided by lead weights applied to the opposite ends of the metal rods. In the two body wear test, water was continuously flowing through the lower part to decrease the possibility of particles generated by the wear test from lodging into the wear surfaces. After completion of the wear test, specimens were placed in the drying oven for 24 hours at 45°C. The weight and volume loss of each material was measured using the density of each material.
Surface roughness (before and after test): The Surface Roughness (Ra) of each material was measured in μm using a portable surface roughness tester (Model SJ-201; Mitutoyo Corp. Japan) before the start of the test. The measurements were made using a set length of 2.5 mm.
After 50,000 cycles of wear, the surface roughness was measured 3 times randomly along the wear groove. Each material was tested using the portable surface roughness tester. Results were calculated as Roughness average (Ra) in (μm) (Figure 4).
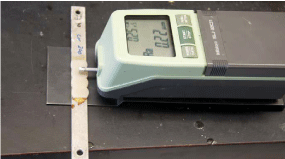
Figure 4: Surface roughness measurement.
Results
CAD/CAM materials volume loss
The mean of volume loss (mm³) of the six different polished materials after 50,000 strokes of wear testing against enamel was calculated and the results are shown in (Figure 5).
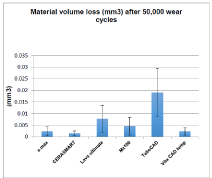
    Figure 5:  Volume loss measurements of the materials after 50,000 cycles of
wear against enamel.
The difference in mean is significant at the 0.05 level and/ or below (P<0.05). An ANOVA test revealed that there was a statistically significant difference among the materials tested (Table 1). The P-Value among the tested groups was P=0.001. To clarify the differences among the groups a Post Hoc Tukey test for multiple analyses was utilized.
    Material
    Materials Average Volume Loss    (mm3)
      against Enamel
    Enamel specimens
      Average Volume Loss (mm3)


    IPS emax CAD
    0.00243
    0.00213


    CERASMART
    0.00148
    0.00056


    Lava U R
    0.00773
    0.00507


    MZ100
    0.00461
    0.0355


    MZ100
    0.00461
    0.0355


    Telio CAD
    0.01905
    0.0013


    Vita CAD Temp
    0.00233
    0.0062
Table 1: Volume loss each material vs opposing enamel.
Enamel volume loss
The mean volume loss (mm³) of enamel after wear testing following opposition to each of the six different polished materials was compared after 50,000 strokes of wear. The volume loss was calculated and the results are shown in (Figure 6).
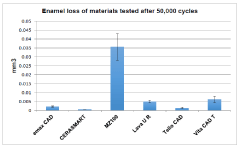
    Figure 6:  Means of enamel volume loss of the materials after 50,000 cycles
of wear testing with various materials.
The mean enamel volume loss against the six materials did not differ significantly at 0.05 level and/or below (P<0.05). An ANOVA test revealed that there was no statistically significant difference among the tested groups (P>0.05) (Figure 6). The P-Value of the enamel volume loss against the different materials after the wear test was P= 0.4733.
Volume loss of each material versus volume loss of its opposing enamel
The average volume loss for the six materials (IPS e.max, Paradigm MZ100, Telio CAD, Restorative Lava Ultimate, CERASMART and Vita CAD Temp) and the average volume loss of their opposing enamel specimens after 50,000 strokes are listed in (Table1).
Surface roughness
Surface roughness before wear test: To understand whether the enamel loss correlates to the material surface roughness we analyzed the surface roughness of each of the materials. The surface roughness for each of the materials prior to the wear test was measured and the findings are shown in (Table 2).
    Surface Roughness before Wear    Test (μm)


    Material
    IPS e.max
    CERASMART
    MZ100
    Lava U R
    Telio CAD
    Vita CAD T


    Sample size
    10
    8
    10
    10
    10
    10


    Mean
    0.054
    0.115
    0.131
    0.104
    0.018
    0.063


    SD
    0.0397
    0.041057
    0.0578
    0.0374
    0.0091
    0.0309
Table 2: Surface roughness of the different materials before the wear test.
Surface roughness after wear test: The surface roughness reading for the six different materials after the 50000 strokes of the wear test were measured and are showed in the (Table 3).
    Surface Roughness after Wear    Test (μm)


    Material
    IPS e.max
    CERASMART
    MZ100
    Lava U R
    Telio CAD
    Vita CAD T


    Sample size
    10
    8
    10
    10
    10
    10


    Mean
    0.521
    0.13875
    0.32
    0.405
    0.232
    0.428


    SD
    0.2509
    0.039
    0.192
    0.307
    0.115
    0.196
Table 3: Surface roughness of the different materials after the wear test.
The mean surface roughness after the wear test of each material was significant at 0.05 level and/or below. An ANOVA test revealed that there was a statistically significant difference among the tested groups (P<0.05). The P-Value of the surface roughness among the different materials before the wear test was P=0.0031. To clarify the differences among the groups a Post Hoc Bonferroni test for multiple analyses was also utilized.
Discussion
The study of material wear is ubiquitous in dentistry and particularly in the specialty fields of dental biomaterials science. There are diverse designs, protocols, conditions, and measurement techniques that are utilized by researchers and reported in the literature. Because of this diversity of methods the field lacks standardization and this hinders direct comparisons among studies [15-18].
In this study of wear, enamel was the material of choice to oppose six different chairside CAD/CAM materials (IPS emax CAD, Telio CAD, Lava Ultimate R, CERASMART, VITA CAD Temp, and composite resin MZ 100).
Simulation devices are utilized to measure and investigate wear behavior of dental biomaterials. However, currently there is no universal standard wear testing method for dental biomaterials. A common method to test wear in vitro is the pin and plate method. This method is a two-body abrasion approach that tests the wear for pairs of materials. Wear assessment is measured by weight loss of specimens, the pin height, and the material volume loss. In this study, weight loss was measured using an accurate digital balance and volume loss was calculated by dividing the
weight loss by the density of the material. This approach is a simple, predictable and reliable method of determining wear by comparing volume loss among different materials.
Surface roughness before wear test
Surface roughness of polished specimens was measured prior to the wear test. The surface roughness of MZ100 at 0.131 μm and CERASMART at 0.115 μm is similar yet significantly higher than the other tested materials.
Surface roughness of Telio CAD at 0.018 μm and ceramic IPS emax CAD at 0.054 μm and Vita CAD Temp at 0.063 μm are similar but significantly lower than the other materials tested.
The surface roughness of MZ100 at 0.131 μm and CERASMART at 0.115 μm is similar with no statistically significant difference. MZ100 and CERASMART have significantly higher surface roughness than Telio CAD at 0.018 μm and ceramic IPS emax CAD at 0.054 μm and Vita CAD Temp at 0.063 μm.
The surface roughness of Lava Ultimate R at 0.104 μm is average for this group of materials. Lava Ultimate R has a greater roughness than Telio CAD, ceramic IPS emax CAD and Vita CAD Temp. Of note, Lava Ultimate R is not significantly less rough in comparison to MZ100 and CERASMART.
Surface roughness after wear test
Surface roughness of the specimens (IPS emax CAD, Telio CAD, Lava Ultimate R, CERASMART, VITA CAD Temp and MZ 100) was recorded after 50,000 wear cycles against human enamel.
The surface roughness of IPS emax CAD at 0.521 μm is the greatest, followed by Vita CAD Temp at 0.428 μm, Lava Ultimate R at 0.405 μm, MZ100 at 0.32 μm, Telio CAD at 0.232 μm and CERASMART at 0.138 μm.
The surface roughness of CERASMART at 0.138 μm after the wear test is significantly lower than IPS emax CAD at 0.521μm. This could have been due to a homogeneous and uniform nano ceramic network and/or due to the potential for resin to penetrate the ceramic structure, altering the topography of the surface and making it less rough after abrasion.
The surface roughness of IPS emax CAD at 0.521 μm and Lava Ultimate R at 0.405 μm is significantly higher after the wear test than the four other materials. High surface roughness could be due to the inclusion of ceramic in both of these materials. Lava Ultimate R was invented by blending nanomer and nanocluster fillers with a total nanoceramic material content by weight of approximately 80% and this structure has a higher density and interconnected matrix than the ceramic structure of CERASMART. In contrast, IPS emax CAD is an all-ceramic material. When IPS emax CAD or Lava Ultimate R is opposed by enamel in the wear test, the rough ceramic particles are exposed with abrasion generating a rough surface after completion of the wear test [14].
The surface roughness of CERASMART at 0.138 μm and Telio CAD at 0.232 μm is significantly lower than the other materials. However, CERASMART has significantly lower surface roughness compared to Telio CAD.
The surface roughness of Lava Ultimate R at 0.405 μm and MZ100 at 0.32 μm is moderate. Their surface roughness was higher than CERASMART and Telio CAD, and has no significant difference from Vita CAD Temp. In contrast, Lava Ultimate R and MZ100 are significantly lower than emax CAD.
Wear tests were performed to compare the wear resistance of six dental materials (IPS emax CAD, Telio CAD, Lava Ultimate R, CERASMART, VITA CAD Temp and MZ 100) when opposed by enamel and the volume loss was calculated for each material. Telio CAD has the relatively highest volume loss against enamel at 0.019058 mm³ followed by Lava Ultimate R at 0.007738 mm³, composite resin MZ 100 at 0.004614 mm³, IPS emax CAD at 0.002436 mm³, Vita CAD Temp at 0.002333 mm³ and CERASMART at 0.001486 mm³.
This study reveals no significant differences in volume loss for Lava Ultimate R at 0.007738 mm³, composite resin MZ100 at 0.004614 mm³, IPS emax CAD at 0.002436 mm³, and Vita CAD Temp at 0.002333 mm³. Interestingly, the volume losses stated above are significantly less than Telio CAD at 0.019058 mm³. On the other hand, these materials have a greater loss of volume than CERASMART at 0.001486 mm³.
The flexible nano-ceramic material CERASMART has the smallest volume loss. CERASMART has a similar volume loss as Vita CAD Temp and IPS emax CAD.
An interesting finding in this study was the performance of the flexible nano ceramic CERASMART and nano composite Lava Ultimate R with volume loss of 0.001486 and 0.0077 mm³ respectively. Although these materials are ceramic/resin in nature, their interpenetrating phase played a role in their wear performance. They resist wear better than the other tested materials. The volume loss of CERASMART and Lava Ultimate R is significantly less than Telio CAD.
The surface roughness of Telio CAD at 0.232 μm following wear was similar to the surface roughness of MZ100 at 0.32 μm. The surface roughness of IPS emax CAD at 0.521 μm was the roughest surface among the materials tested and IPS emax CAD displays a significantly lower volume loss of 0.002436 cm³ compared to Telio CAD at 0.019058 cm³. This suggests that microstructural differences in these materials may be important and play a greater role during wear than the superficial surface roughness. Therefore, surface roughness is one of the factors but only one of several factors that impact wear. Thus, the properties of the materials and their structure play significant roles in determining wear.
Conclusion
Telio CAD had the highest volume loss among tested materials with significant differences in abrasion to the enamel. CERASMART showed superior wear resistant characteristics when opposed by enamel. Enamel (stubs) showed no significant difference in volume loss when opposed CAD/CAM tested materials. Surface roughness was shown significant differences among the materials after the wear.
References
- Papadopoulosa MA, Chatzoudib M, Kaklamanosc EG. Prevalence of tooth transposition. A meta-analysis. Angle Orthod. 2010; 80: 275-285.
- Tripathi S, Singh RD, Singh SV, Arya D. Maxillary canine transposition – A literature review with case report. J Oral Biol Craniofac Res. 2014; 4: 155- 158.
- Peck S, Peck L. Classification of maxillary tooth transpositions. Am J Orthod Dentofacial Orthop. 1995; 107: 505-517.
- Peck S, Peck L, Kataja M. Mandibular lateral incisor-canine transposition, concomitant dental anomalies, and genetic control. Angle Orthod. 1998; 68: 455-466.
- Nishimura K, Nakao K, Aoki T, Fuyamada M, Saito K, Goto S. Orthodontic correction of a transposed maxillary canine and first premolar in the permanent dentition. Am J Orthod Dentofacial Orthop. 2012; 142; 4; 524-533.
- Peck L, Peck S, Attia Y. Maxillary canine-first premolar transposition, associated dental anomalies and genetic basis. Angle Orthod. 1993; 63: 99- 110.
- Teresa DM, Stefano M, Annalisa M, Enrico M, Vincenzo C, Giuseppe M. Orthodontic treatment of the transposition of a maxillary canine and a first premolar: a case report. J Med Case Rep. 2015; 9: 48.
- Gebert TJ, Palma VC, Borges AH, Volpato LER. Dental transposition of canine and lateral incisor and impacted central incisor treatment: A case report. Dental Press J Orthod. 2014; 19; 1: 106-112.
- Prasad V, Tandon P, Singh GP, Maurya RP. Management of maxillary lateral incisor: Canine transposition along with maxillary canine impaction on the contralateral side. J Orthod Res. 2015; 3: 61-64.
- Babacana H, Kilic B, Bicakc A. Maxillary canine-first premolar transposition in the permanent dentition. Angle Orthod. 2008; 78: 955-960.