
Research Article
Austin Diabetes Res. 2016; 1(2): 1010.
A Simplified Assessment of Insulin Secretion without Measurement of C-Peptide Provides an Evaluation of Functional Beta-Cell Mass
Brun JF¹*, Villard O1,2, Wojtusciszyn A2, Berney T3, Benhamou PY4, Raynaud de Mauverger E1, Fedou C1, Cristol JP5 and Mercier J1
1PHYMEDEXPInserm U1046-CNRS UMR 9214– Université de Montpellier Physiologie et Médecine Expérimentale du coeur et des muscles-PHYMEDEXP “CHU Arnaud de Villeneuve34295 Montpellier cedex 05, France
2Department of Endocrinology, Diabetes and Nutrition, France
3Department of Surgery, Cell Isolation and Transplant Center, Switzerland
4Inserm, U1055, Grenoble, France
5Department of Biochemistry, Université de Montpellier I, Montpellier, France
*Corresponding author: JF Brun, PHYMEDEXP Inserm U1046-CNRS UMR 9214-Université de Montpellier « Physiologie et Médecine Expérimentale du coeur et des muscles-PHYMEDEXP “CHU Arnaud de Villeneuve 34295 Montpellier cedex 05, France
Received: November 23, 2016; Accepted: December 22, 2016; Published: December 27, 2016
Abstract
Calculation of pre-hepatic insulin secretion ISR(t) during a standardized meal uses the measurement of C-peptide Cp(t). Serum insulin concentration I(t) is less reliable for calculating ISR(t), due to the variability of its clearance (n) and its hepatic extraction (F). We propose a simplified prediction of ISR(t) using only I(t) and theoretical values of n and F. After a standardized breakfast test (495 kCal, 76 g of carbohydrates), ISR(t) was calculated from Cp(t) according to can Carter’s bicompartmental model and from I(t) by the formula ISR(t)=[dI(t)/ dt+nI(t)]/F with n=0.36 and F=0.45. In 396 subjects representing the whole range of glucoregulation values of ISR (t) given by insulin and C-peptide were well correlated (r=0.842). The coefficients of variation of beta-cell function parameters are 2 to 3% with the C-peptide model and 5 to 6% with the insulin model. In islet-transplanted patients the transplanted beta cell mass is well correlated to beta-cell function parameters calculated with the insulin model (beta cell sensitivity to glucoser=0.538 p<0.01; index Φ(oral) of Cobelli’s model r=0.740 p<0.001). Overall, the simplified approach with insulin alone provides a reasonably acceptable approximation of the results of the reference technique using C-peptide, in spite of a twofold lower intra-subject reproducibility. It provides an evaluation of the beta-pancreatic functional mass. We propose this easy to use model as a reasonable alternative to the reference method, when C- peptide values are not available.
Keywords: Insulin secretion; Model; C-peptide; Beta-cell mass
Introduction
Due to the current development of diabetes treatments targeting insulin secretion and to the progress in pancreatic islets transplantation [1], it becomes interesting to precisely assess insulin secretion in various clinical situations. For this purpose, several sophisticated procedures developed over the last decades are available [2,3], based on the classical modeling of pre-hepatic insulin release from C-peptide kinetics after a glucose oral load. Such measurements have been shown to provide a prediction of the transition from prediabetic states to overt diabetes [4,5] and to reflect functional islet mass [6].
What makes such approaches very attractive is that, despite the complexity of calculations, they are in fact based on a procedure which is technically very simple, i.e. OGTT or meal test with repeated venous blood samplings over 3 or 4 hrs. However, this approach remains underutilized, due perhaps to the sophistication of the mathematical procedures used for analyzing the crude data and also to the need to assess C-peptide which slightly increases its cost compared to the usual OGTT procedure.
Currently, most studies presenting insulin secretion data employ much simpler measurements for example areas under the curve, insulinogenic index [7,8] or surrogates such as the Homeostasis Model Assessment Beta-cell index (HOMA B) [9,10] whose validity is often discussed [11-13].
We made the hypothesis that between the highly sophisticated mathematic approaches using C-peptide indicated above and the very simplistic indices most commonly used (that are only based on insulin concentrations), a modeling approach derived from the C-peptide based methods but using only insulin data can be reasonably accurate, cheaper and easier to employ and provide much more information on beta-cell function than the more simplistic procedures.
In a classical paper by Tura, et al. [14] serum insulin concentration I(t) is described as a very simple function of prehepatic Insulin Secretion Rate (ISR) and the derivative of I(t) with two parameters n (systemic insulin fractional clearance) and F (posthepatic insulin fractional appearance). We used this equation in order to calculate prehepatic Insulin Secretion Rate (ISR) from serum insulin concentration I(t) and the derivative of I(t), as explained below. We then assessed the reproducibility of the method, its agreement with values calculated with the C-peptide method and finally the correlation of the index of second phase insulin release it yields with beta pancreatic mass.
Subjects and Methods
Subjects
Three samples of subjects were studied, see (Table 1). We first used a database of 396 subjects undergoing for whatever reason a breakfast test with complete assessment of glucoregulation with the C-peptide models and further analysis with Cobelli and Mari’s models (see below). Another sample of 9 subjects underwent the breakfast test in triplicate in the context of a trial in which they were control subjects and thus provide a possibility to assess reproducibility. Another sample, 7 type 1 diabetic islets transplanted subjects were explored with the breakfast test in order to test the correlation between the number of transplanted islets and insulin secretion (islet mass infused ranged from 9619 to 16304 islet equivalent/kg). This sample of patients was previously studied with the C-peptide model and with this model it was shown that indexes of phase 2 insulin release provided by both the models of Mari [2] and Breda and Cobelli [3] were well correlated to beta cell mass. Data and results of this study obtained with the C-peptide model are presented elsewhere. All studies were performed according to the ethical standards with informed consent and ethical committee advice. The study used for reproducibility was a randomized controlled trial (“DialphaDCT1401”) registered in the EU Clinical Trials Register (Eudract) under the N° ID-RCB: 2014- A00692-45.
    gender(% male)
    weight
    height
    Age
    FPG    (mmol)
    Fasting    insulin


    Overallsample    of 396 subjects
    28.30%
    86.12±1.19
    1.66±0.00
    45.67±0.82
    5.55±0.09
    10.92±0.63


    Initial    series used for determining n and F in paper [25] n=29
    27.60%
    82.16±4.44
    1.65±0.01
    44.52±3.15
    4.88±0.09
    11.30±1.64


    Study    of reproducibility (breakfast test in triplicate) n=15
    53.30%
    88.38±3.30
    1.67±0.02
    54.11±1.92
    5.46±0.17
    14.23±0.89


    Islet-transplanted    diabetic subjects [32] (correlation of β-cell parameters with number of    transplanted islets) n=8
    25.00%
    66.76±2.20
    1.65±0.01
    44.82±1.84
    5.46±0.11
    9.59±2.33
Table 1: Characteristics of the 4 groups of study subjects.
Breakfast test
Subjects had been asked to fast for 12 h before commencement of the standardized breakfast that was composed of bread (80 g), butter (10 g), jam (20 g), skimmed concentrated milk (80 ml) (Gloria SA, Paris and France), sugar (10 g) and powder coffee (2.5 g). The breakfast thus comprised 2,070 kilojoules with 9.1% proteins, 27.5% lipids and 63.4% carbohydrates. The average time for consuming the meal was 6 min. Blood samples were taken twice before the meal and at 15, 30, 60, 90, 120, 150, 180, 210 and 240 min following the start of the meal. This test, which has been designed to detect postprandial reactive hypoglycemia [15], elicits the same glycemic response as the conventional OGTT [15-17].
Laboratory measurements
All samples were analyzed for plasma insulin by radioimmunoassay (kit Bi Insulin IRMA; Schering CIS bio international, Gif-sur Yvette, France) and for plasma glucose content with a Olympus 2700 automate.
Measurements of insulin-sensitivity: Insulin sensitivity was calculated with Caumo’s “oral minimal model” [18] which is the application to OGTT or meal tests of the equations previously developed by R.N. Bergman for IVGTT [19]. It is based on the analysis of changes in plasma glucose and insulin concentration measured after the SHB. SI is given by the “oral minimal model” which is actually Bergman’s one with simply another term called Ra OGTT added to the first equation.
where G is plasma glucose concentration, I is plasma insulin concentration, suffix “b” denotes basal values, X is insulin action on glucose production and disposal, V is distribution volume and SG, p2 and p3 are model parameters. Specially, SG is the fractional (i.e. per unit distribution volume) glucose effectiveness, which measures glucose ability per se to promote glucose disposal and inhibit glucose production; p2 is the rate constant describing the dynamics of insulin action; p3 is the parameter governing the magnitude of insulin action. Interestingly, these two equations can be simplified, allowing to calculate SI with a quite simple area under the curve formula:
where G is plasma glucose concentration, ΔG and ΔI are glucose and insulin concentrations above basal, respectively, AUC denotes the area under the curve; GE is glucose effectiveness termed above p1 or SG (dl.kg-1.min-1); DOGTT is the dose of ingested glucose per unit of body weight (mg.kg-1); and f is the fraction of ingested glucose that actually appears in the systemic circulation. When glucose falls below basal, a slightly different formula needs to be used (we refer to Eq.7 in Caumo and al. [18]. Calculations of SI require insertion of values for SG and f. Here we used the value of glucose effectiveness given by our previously validated formula (see below) SG=2.921e-0.185(G60-G0). Besides, as in Caumo’s paper, the value for f is set as f=0.8.
This “oral minimal model” has been validated against glucose clamp [20] (sophisticated tracer experiments [21] and the classical IVGTT-based minimal model [16]. More recently we also reported its accuracy in type 2 diabetics [17].
Calculation of insulin secretion with C-peptide model
Insulin secretion was also quantified from C-peptide kinetics as described by the well-known two-compartment model originally proposed by Eaton, et al. [22] and further improved by van Cauter, et al. [23] so that the model parameters were individually adjusted to the subject’s anthropometric data.
where the overdot indicates time derivative; CP1 and CP2 (nmol/l) are C-peptide concentrations above basal in the accessible and peripheral compartments, respectively; kij (min-1) are C-peptide kinetic parameters and insulin secretion rate (SR) (pmol.l-1.min−1) is pancreatic secretion rate above basal, entering the accessible compartment and normalized by the volume of distribution of compartment 1.
This β-cell response obtained with this classical calculation was then quantified with several classical parameters defined by the two most widely accepted models available in the literature [2,3].
The most simplistic expression were maximal insulin secretion (pMol/min/m²) ie the highest value of ISR during the test and total insulin release over 210 min (pMol/m²) which is calculated as the area under the curve. Another measurement of total insulin secretion global index of β-cell sensitivity to glucose, Φ (109 min−1), was calculated as follows, according to Breda [3] as the ratio between the AUC of total insulin secretion and the AUC of blood glucose concentration.
where T(min), is the time at which the system returns to steady-state conditions after the perturbation, is in this study the duration of the glucose-tolerance test covered by blood sampling.
β-cell sensitivity to glucose [2] which is approximately equivalent to the static sensitivity index Φs (109 min-1) [3] measures the effect of glucose on β-cell secretion at steady state. It is calculated as the slope (pMol/min/mmol/m²) of the relationship between SR and glucose concentration.
Two indexes of first phase insulin secretion were measured. The derivative component, also called “rate sensitivity” or k1 (pMol.m-2.
mmol-1) according to Mari [2] as the dynamic dependence of insulin secretion on the rate of change of glucose concentration. The dynamic sensitivity index Φd (109) is a measure of the stimulatory effect of the rate at which glucose increases upon the secretion of stored insulin. It is defined as the amount of insulin (per unit of C-peptide distribution volume) released in response to the maximum glucose concentration (Gmax) achieved during the experiment, normalized by the glucose increase Gmax-Gb. This parameter ΦD is calculated according to Breda [3].
Basal insulin secretion (pMol/min/m²) given by the C-peptide kinetics was also calculated and also expressed as an index of basal β-cell sensitivity Φb (109 min−1) as follows:
The potentiation factor ratio was also calculated according to Mari [2] as a time-varying factor, which is set to be a positive function of time and to average one during the experiment, encompassing all factors that may modulate insulin secretion (glucose and nonglucose substrates, gastro intestinal hormones, neuromodulation). It expresses a relative potentiation of the secretory response to glucose.
A disposition index was also calculated insulin secretion by insulin sensitivity, in analogy with Bergman, et al. [24]. Actually, three different disposition indexes can be calculated after mixed-meal ingestion, by multiplying k1, β-cell sensitivity to glucose and total insulin secretion Φ by SI.
Insulin clearance
Individual parameters of insulin kinetics were calculated from insulin and C peptide data with Tura’s model [14]:
dI (t)/dt= CPS(t)/F-nI(t)
Where I(t) is the measured plasma insulin concentration (pmol/l)
n is the systemic insulin fractional clearance (min−1)
F is the fraction of CPS(t) that constitutes the posthepatic appearance of insulin in the peripheral circulation.
F×CPS(t) is the posthepatic insulin delivery; (1-F) represents the hepatic insulin fractional extraction (dimensionless).
CPS(t) expressed per unit volume 78 ml/kg BW
Insulin-based model
The formula used in Tura’s paper was employed [14]:
dI(t)/dt=ISR(t)/F-nI(t)
It can be re-written as follows:
ISR(t)=[dI(t)/dt+nI(t)]/F
And thus can allow to predict ISR(t) if we use standard values of n and F. In a previous publication [25] we proposed empirical values found in a sample of subjects, which is n=0.36 and F=0.45.
Results
Figures 1 and 2 show the agreement between ISR values provided by the insulin model and the C peptide full model. It can be seen that despite more discrepancies for the very high values, a rather satisfactory agreement is found.
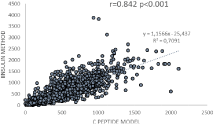
    Figure 1:  Correlation between insulin secretion rates predicted by the insulin
model with standardized kinetic parameters with the reference technique using
C-peptide in the overall database of 396 subjects undergoing for whatever
reason a breakfast test with complete assessment of glucoregulation.
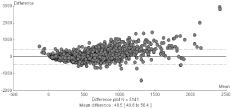
    Figure 2:  Bland-Altman plot showing the agreement between insulin secretion
rates predicted by the insulin model with the reference technique using
C-peptide in the overall database of 396 subjects undergoing for whatever
reason a breakfast test with complete assessment of glucoregulation.
Table 2 shows the values of n and F calculated in this same database and presented separately in such an information can provide a basis for a closer prediction of n and F and further improvements of the model. However, as shown on (Figures 3 and 4), it can be seen that there is a shift in the parameter n that most of the time falls from 0.21 to 0.15 min-1 at a threshold value of BMI=30 kg/m², but that there are other factors of variation that need to be elucidated and that there is at present no clear solution to improve the model with more specific values of n and F according to obesity status, age, diabetes, etc… We tried to improve the model with an algorithm taking into account this BMI-related shift in “n” but results were not satisfactory and did not yield better agreement than shown on (Figures 1 and 2) (data not shown).
    Parameters of Tura’s model
    Model    parameters of insulin removal


    n=
    F=
    Hepatic extraction of insulin (%)
    Peripheral    clearance of insulin (min-1)


    ALL subjects
    0.24±0.01
    0.33±0.01
    68.84±0.85
    0.24±0.01


    (n=388)


    Controls with normal glucose tolerance (n=29)
    0.19±0.01
    0.37±0.05
    66.39±2.56
    0.19±0.01


    Type 2 diabetics (n=40)
    0.29±0.02
    0.45±0.03
    54.99±2.88
    0.29±0.02


    Lean    subjects with normal glucose tolerance (n=9)
    0.21±0.00
    0.48±0.14
    64.60±6.72
    0.21±0.00


    Overweight    subjects with normal glucose tolerance
    0.17±0.01
    0.22±0.03
    78.29±3.17
    0.17±0.01


    Nondiabetic obese subjects (n=13)
    0.15±0.01
    0.28±0.03
    71.83±2.72
    0.15±0.01
Table 2: Calculation over a large sample of parameters of insulin removal used in the model.
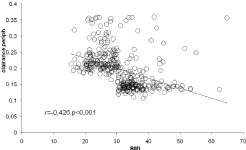
    Figure 3:  Values of “n” (peripheral insulin clearance) on the database of 396
breakfast tests as a function of body mass index showing that around 30 kg/
m2 the values usually fall from 0.21 to 0.15 min-1. In some individuals from this
unselected population the value is much higher.
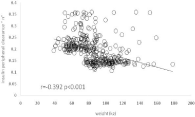
    Figure 4:  Values of “n” (peripheral insulin clearance) on the database of 396
breakfast tests as a function of body weight showing that around 30 kg/m²
the values usually fall from 0.21 to 0.15 min-1. In some individuals from this
unselected population the value is much higher.
Table 3 shows the coefficients of variation of the main parameters of glucoregulation calculated in the study, as assessed in subjects that have done in triplicate the breakfast test. This table shows a fair reproducibility of these measurements. However, it can be pointed out that the CV of parameters given by the insulin model is grossly twofold higher than the CV of parameters given by the C-peptide model.
    Function explored
    parameter
    CV (%)


    Insulin    sensitivity and glucose effectiveness
    Insulin sensitivity index OGIS
    1.7


    Oral minimal model SI
    4.8


    Oral minimal model SG
    1.4


    Second phase insulinsecretion
    « pancreatic    beta cell sensitivity » (C peptide model )
    3.2


    « pancreatic    beta cell sensitivity » (insulin model )
    6


    ΦS (Cobelli)
    2.4


    First    phase insulin secretion
    « rate sensitivity » k1 (Mari)
    7.5


    (C    peptide model )
    ΦD (Cobelli)=
    7.1


    Overall insulin secretion
    insulinogenic index
    3.5


    Φ (oral) Cobelli (C peptide model )
    2.4


    Φ (oral) Cobelli (insulin model )
    2.5


    Total AUC of ISR
    0.9


    Peak value of ISR
    1.3


    Disposition index Φ(oral) xSI
    DI oral Cobelli (C peptide model )
    7.1


    DI oral Cobelli (insulin model )
    8.6


    Basal insulin secretion
    Φ basal Cobelli (C peptide model    )
    0.8


    Φ basal Cobelli (insulin model    )
    2,3


    Parameters    of insulin kinetics in Tura’s model
    n =
    2,6


    F =
    2,0
Table 3:  Coefficients of Variation (CV) of the main parameters of glucoregulation calculated in the study. The CV of parameters given by the insulin model is grossly
two fold higher than the CV of parameters given by the C peptide model.
Figures 5 and 6 show the agreement between insulin and C-peptide methods for all values of ISR in the sample of 9 subjects used for the reproducibility study. In this more defined sample of subjects this agreement is slightly better than on the large series of nonselrected patients shown on (Figures 1 and 2).
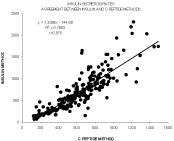
    Figure 5:  Agreement between insulin and C-peptide methods for all values of
ISR in the sample of 9 subjects used for the reproducibility study.
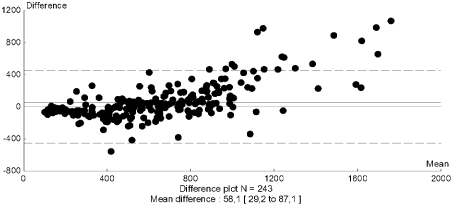
    Figure 6:  Agreement between insulin and C-peptide methods for all values of
ISR in the sample of 9 subjects used for the reproducibility study.
On (Figure 7) is shown the agreement between beta-cell sensitivity predicted with the insulin model and the C-peptide model in the sample of 396 subjects. On fig. 8 we present the correlation between the parameter of insulin secretion Φ(oral) given by Breda and Cobelli’s model [3] and the beta cell mass infused in islet transplanted patients. On (Figure 9) we present the correlation between beta-cell sensitivity (an index of phase 2 insulin secretion given by Mari’s model [2] and the mass of injected islets in islet transplanted patients.
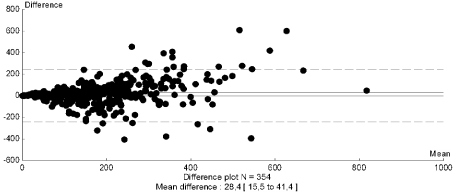
    Figure 7:  Agreement between beta-cell sensitivity predicted with the insulin
model and the C-peptide model in the sample of 396 subjects.
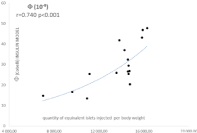
    Figure 8:  Correlation between the parameter of insulin secretion Φ(oral) given
by Breda and Cobelli’s model [3] and the mass of injected islets in islet
transplanted patients.
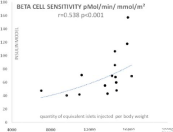
    Figure 9:  Correlation between beta-cell sensitivity (an index of phase 2
insulin secretion given by Mari’s model [2] and the mass of injected islets in
islet transplanted patients.
Discussion
This paper shows that the insulin model, although slightly less satisfactory than the C-peptide one, provides a fair estimation of insulin secretion rate and thus of several parameters of insulin secretion like beta cell sensitivity or Φ(oral). Even more, we find correlations of these two parameters with the number of islets previously injected in islet-transplanted patients, suggesting that they are markers of beta-cell mass even when assessed with the simplified insulin model.
The methods employed in this study, although they become more and more classical, require some comments.
The calculation of prehepatic insulin delivery ISR(t) with the use of C-peptide measurements is a robust and unanimously recognized procedure that has the advantage of being almost model-independent [26]. β-cell sensitivity to glucose is also a robust parameter that expresses ISR(t) as a function of blood glucose concentration and is termed the static component of insulin secretion, also called second phase of insulin secretion. Recent literature has highlighted its pathophysiological relevance since it is a major actor of glucose tolerance [27], it can predict and track the evolution to diabetes [4], explain most of the remission of diabetes after bariatric surgery [28,29]. A defect in this parameter results in impaired glucose tolerance [30]. Even more interesting, a study suggests that this parameter is related to beta cell mass [6].
The use of a simplified insulin model as proposed here is attractive for many reasons. It reduces the cost of the measurement, can allow the calculation of Mari and Cobelli’s models in databases in which C peptide data are not available and is slightly less complicated to apply. It can be calculated on a simple spreadsheet without the need of sophisticated software.
Our study shows that on the average the insulin model gives results in fair agreement with the C-peptide method. However, it is twofold less reproducible and presents some cases of discrepancies mostly in the range of high values of insulin secretion.
The reason for this lower accuracy is obviously that the insulin model relies on standard values of n and F while these two parameters are variable within a population. (Table 2) provides the basis for the development of an improved insulin model in which different theoretical values n and F will be applied according to the characteristics of subjects (BMI, age and diabetic status). As shown on (Figure 3 and 4), the most obvious factor that can be taken into account is the obesity status (BMI below or above 30 kg/m2), which shifts parameter n (insulin peripheral clearance) from 0.21 to 0.15 min-1. However this factor is far to explain all the discrepancies and our attempts to validate an improved model were until now unsatisfactory and did not improve the agreement between insulin and C peptide methods (data not shown). Presumably however, further attempts of modeling of n and F may result in an improved insulin model.
An interesting attempt to develop an insulin model as an alternative to the C-peptide approach was recently proposed by Tura [31] and evidenced an agreement between insulin and C-peptide methods. Clearly, despite a modest bias, the insulin method was more accurate than the simple use of insulin concentration. The insulin model presented by these authors is much more sophisticated, however, than the one we present here. As already indicated above, the interest of our approach is that with a very simple equation one can calculate with a reasonable accuracy ISR(t) and therefore the model parameters of insulin secretion on a spreadsheet without the need of any additional software.
One of the important points in this validation study is that we found an interesting correlation between insulin secretion indexes given by this insulin model and the mass of islets injected in patients receiving a pancreatic islet transplantation (Figures 8 and 9). We already reported this correlation with the C-peptide model in the same sample of subjects [32] and the results shown here indicate that the insulin model is also able to provide an approach of functional islet cell mass.
There is a growing body of evidence showing that the analysis of insulin response in terms of ISR and even more in phase 1 and phase 2, can help to better understand pathophysiological mechanisms involving b-cell function that cannot be analyzed with crude insulin concentrations data or empirical indexes based on insulin concentration [4,5, 27-30,33,34]. We propose that our very simple approach can allow more investigators to better assess beta cell function even when they lack C-peptide data. Obviously, when C-peptide measurements are available, it is better to use the full C-peptide approach, but the simplified insulin approach is already a quite accurate one that allows to drive from OGTT or meal tests much more information than can be obtained from usual surrogates or empirical indexes.
Conclusion
On the whole, we propose here a simplified and robust method to assess β-cell function that can be employed when C-peptide measurements are not available. Although the full C-peptide model is twofold more reproducible and should always be preferred when it is possible, this approach is sensitive enough to provide an evaluation of beta cell mass and thus to quantify the various components of β-cell function whose importance in the exploration of glucoregulatory disturbances appears more and more interesting. Further improvements of this approach with the use of standardized kinetic parameters specific for various subpopulations will probably in a next future help to improve again this approach that seems already under this current form quite reliable.
References
- Niclauss N, Meier R, Bedat B, Berishvili E, Berney T. Beta-Cell Replacement: Pancreas and Islet Cell Transplantation. Endocr Dev. 2016; 31: 146-162.
- Mari A, Schmitz O, Gastaldelli A, Oestergaard T, Nyholm B, Ferrannini E. Meal and oral glucose tests for assessment of β-cell function: modeling analysis in normal subjects. Am J Physiol Endocrinol Metab. 2002; 283:1159-1166.
- Breda E, Cavaghan MK, Toffolo G, Polonsky KS, Cobelli C. Oral glucose tolerance test minimal model indexes of beta-cell function and insulin sensitivity. Diabetes. 2001; 50: 150-158.
- Ferrannini E, Natali A, Muscelli E, Nilsson PM, Golay A, Laakso M, et al. On behalf of the RISC Investigator: Natural history and physiological determinants of changes in glucose tolerance in a non-diabetic population: the RISC Study. Diabetologia. 2011; 54: 1507-1516.
- Ferrannini E, Mari A, Nofrate V, Sosenko JM, Skyler JS. DPT-1 Study Group. Progression to diabetes in relatives of type 1 diabetic patients: mechanisms and mode of onset. Diabetes. 2010; 59: 679-685.
- Meier JJ, Breuer TG, Bonadonna RC, Tannapfel A, Uhl W, Schmidt WE. Pancreatic diabetes manifests when beta cell area declines by approximately 65% in humans. Diabetologia. 2012; 55: 1346-1354.
- Abdul-Ghani MA, Jenkinson CP, Richardson DK, Tripathy D, DeFronzo RA. Insulin secretion and action in subjects with impaired fasting glucose and impaired glucose tolerance: results from the Veterans Administration Genetic Epidemiology Study. Diabetes. 2006; 55: 1430-1435.
- Yu P, Li Q, Liu F, Sun Y, Zhang J. ΔI60/ΔG60 as a Good Index for Estimating Beta Cell Function by Using Non-specific Insulin Assay. West Indian Med J. 2016; 2014: 333.
- Matthews DR, Hosker JP, Rudenski AS, Naylor BA, Treacher DF, Turner RC. Homeostasis model assessment: insulin resistance and B-cell function from fasting plasma glucose and insulin concentration in man. Diabetologia. 1985; 28: 412-419.
- Levy JC, Matthews DR, Hermans MP. Correct Homeostasis Model Assessment (HOMA) evaluation uses the computer program. Diabetes Care. 1998; 21: 2191-2192.
- Meier JJ, Menge BA, Breuer TG, Müller CA, Tannapfel A, Uhl W, et al. Functional assessment of pancreatic beta-cell area in humans. Diabetes. 2009; 58: 1595-1603.
- Caumo A, Perseghin G, Brunani A, Luzi L. New insights on the simultaneous assessment of insulin sensitivity and beta-cell function with the HOMA2 method. Diabetes Care. 2006; 29: 2733-2734.
- Kim SK, Kim JH, Park JY, No HS, Jang KT, Heo JS, et al. Indexes of β-cell function from the oral glucose tolerance test can modestly predict pancreatic β-cell area in Korean. Diabetes Res Clin Pract. 2011; 93: 220-227.
- Tura A, Ludvik B, Nolan JJ, Pacini G, Thomaseth K. Insulin and C-peptide secretion and kinetics in humans: direct and model-based measurements during OGTT. Am J Physiol Endocrinol Metab. 2001; 281: 966-974.
- Brun JF, Fédou C, Bouix O, Raynaud E, Orsetti A. Evaluation of a standardized hyperglucidic breakfast test in postprandial reactive hypoglycaemia. Diabetologia. 1995; 38: 494-501.
- Aloulou, I. Brun, J.F., Mercier, J. Evaluation of insulin sensitivity and glucose effectiveness during a standardized breakfast test: comparison with the minimal model analysis of an intravenous glucose tolerance test. Metabolism. 2006; 55: 676-690.
- Brun JF, Ghanassia E, Fedou C, Bordenave S, Raynaud de Mauverger E, Mercier J. Assessment of insulin sensitivity SI and glucose effectiveness SG from a standardized hyperglucidic breakfast test in type 2 diabetics exhibiting various levels of insulin resistance. Acta Diabetol. 2013; 50: 143-153.
- Caumo A, Bergman RN, Cobelli, C. Insulin sensitivity from meal tolerance tests in normal subjects: a minimal model index. J Clin Endocrinol Metab. 2000; 85: 4396-4402.
- Bergman RN, Ider YZ, Bowden CR, Cobelli C. Quantitative estimation of insulin sensitivity. Am J Physiol. 1979; 236: 667-677.
- Dalla Man C, Yarasheski KE, Caumo A, Robertson H, Toffolo G, Polonsky KS, et al. Insulin sensitivity by oral glucose minimal models: validation against clamp. Am J Physiol Endocrinol Metab. 2005; 289: 954-959.
- Dalla Man C, Caumo A, Basu R, Rizza R, Toffolo G, Cobelli C. Minimal model estimation of glucose absorption and insulin sensitivity from oral test: validation with a tracer method. Am J Physiol Endocrinol Metab. 2004; 287: 637-643.
- Eaton RP, Allen RC, Schade DS, Erickson KM, Standefer J. Prehepatic insulin production in man: kinetic analysis using peripheral connecting peptide behaviour. J Endocrinol Metab. 1980; 51: 520-528.
- Van Cauter E, Mestrez F, Sturis J, Polonsky KS. Estimation of insulin secretion rates from C-peptide levels: comparison of individual and standard kinetic parameters for C-peptide clearance. Diabetes. 1992; 41: 368-377.
- Bergman RN, Hope ID, Yang YJ. Assessment of insulin sensitivity in vivo: a critical review. Diabetes Metab Rev. 1989; 5: 411-429.
- JF Brun, E Raynaud de Mauverger, J Mercier. Calcul des parameters d'insulino-sécrétion lors du petit-déjeûner test à partir des insulinémies sans utilisation du C peptide. Ann Endocrinol (Paris) 2009, 70:413 (abstract).
- Cobelli C, Toffolo GM, Dalla Man C, et al. Assessment of beta-cell function in humans, simultaneously with insulin sensitivity and hepatic extraction, from intravenous and oral glucose tests. Am J Physiol Endocrinol Metab. 2007; 293: 1-15.
- Mari A, Tura A, Natali A, Laville M, Laakso M, Gabriel R, et al. RISC Investigators. Impaired beta cell glucose sensitivity rather than inadequate compensation for insulin resistance is the dominant defect in glucose intolerance. Diabetologia. 2010; 53: 749-756.
- Nannipieri M, Mari A, Anselmino M, Baldi S, Barsotti E, Guarino D, et al. The role of beta-cell function and insulin sensitivity in the remission of type 2 diabetes after gastric bypass surgery. J Clin Endocrinol Metab. 2011; 96: 1372-1379.
- Nannipieri M, Baldi S, Mari A, Colligiani D, Guarino D, Camastra S, et al. Roux-en-Y gastric bypass and sleeve gastrectomy: mechanisms of diabetes remission and role of gut hormones. J Clin Endocrinol Metab. 2013; 98: 4391-4399.
- Kanat M, Mari A, Norton L, Winnier D, DeFronzo RA, Jenkinson C, et al. Distinct β-cell defects in impaired fasting glucose and impaired glucose tolerance. Diabetes. 2012; 61: 447-453.
- Tura A, Pacini G, Kautzky-Willer A, Gastaldelli A, DeFronzo RA, Ferrannini E, et al. Estimation of prehepatic insulin secretion: comparison between standardized C-peptide and insulin kinetic models. Metabolism. 2012; 61: 434-443.
- JF Brun, O. Villard, T. Berney, P.-Y. Benhamou, AWojtusciszyn. Mathematic analysis of meal tests to evaluate beta cell mass in islet-transplanted patients. Oral Presentation at the 52nd EASD Annual Meeting Munich12-16 September 2016.
- Vaurs C, Brun JF, Bérard E, Chalret du Rieu M, Hanaire H, Ritz P. ß-cell pancreatic dysfunction plays a role in hyperglycemic peaks observed after gastric bypass surgery of obese patients. SurgObesRelat Dis. 2016; 12: 795-802.
- Vaurs C, Brun JF, Bertrand M, Burcelin R, du Rieu MC, Anduze Y, et al. Post-prandial hypoglycemia results from a non-glucose-dependent inappropriate insulin secretion in Roux-en-Y gastric bypassed patients. Metabolism. 2016; 65: 18-26.