
Research Article
J Dis Markers. 2022; 7(1): 1048.
UPLC-QTOF-MS-Based Metabolomics Reveal the Effect of Polysaccharides from Danggui-Shaoyao-San in Type 2 Diabetic Male and Female Rats
Xin F, Si-Han L, Jia-Jun L and Zhi-Bin W*
Key Laboratory of Basic and Application Research of Beiyao, Ministry of Education, Heilongjiang University of Chinese Medicine, China
*Corresponding author: Wang Zhi-Bin Key Laboratory of Basic and Application Research of Beiyao, Ministry of Education, Heilongjiang University of Chinese Medicine, 24 Heping Road, Harbin, China
Received: November 14, 2022; Accepted: December 19, 2022; Published: December 25, 2022
Abstract
Background: Type 2 Diabetes Mellitus (T2DM) is currently one of the most prominent and global chronic conditions. In recent years, it has been found that macromolecular polysaccharide has a significant effect on T2DM, various polysaccharides such as Angelica Sinensis Polysaccharide (ASP), Poriacocos polysaccharide and Atractylodesmacrocephala polysaccharide in DSS have effects on T2DM, but mechanism of polysaccharides of DSS(p-DSS) at the metabolic level is still unclear.
The purpose of this work is to study the male and female mechanisms of p-DSS in treating T2DM based on metabolomics.
Materials and Methods: In this study, metabolomics was used to elucidate the therapeutic mechanism of DSS in T2DM. Urinary samples were collected from male and female rats with T2DM, induced by a high-sugar and high-fat diet combined with Streptozotocin (STZ), to measure the levels of biochemical markers. Urinary metabolomics-based analysis using ultra-performance liquid chromatography coupled with quadrupole time-of-flight mass spectrometry (UPLC-Q-TOF-MS) was conducted to evaluate the differential metabolites from multiple metabolic pathways.
Results: After treatment with p-DSS for 4 weeks, biochemical indicators, including Fasting Blood Glucose (FBG), Fasting Insulin (FINS), Oral Glucose Tolerance Test (OGTT), Insulin Tolerance Test (ITT) and Homeostasis Model Assessment of Insulin Resistance (HOMA-IR), were significantly improved. Metabolomics results revealed that p-DSS regulated the biomarkers, such as PC, 2-oxoglutarate, NAAG in TCA cycle and alanine, aspartate and glutamate metabolism for male rats, on the contrary, leukotriene B4, cholic acid in arachidonic acid metabolism and primary bile acid biosynthesis for female rats.
Conclusions: Based on metabolomics, the mechanisms of p- DSS in male and female rats are not identical.
Keywords: Metabolomics; Type 2 diabetes mellitus; Polysaccharides of DSS; Male and female rats; UPLC/QTOF-MS
Introduction
According to the International Diabetes Federation (IDF) [1], today, there are more than500 million cases of diabetes worldwide, this number is expected to reach783 million by 2045. About 541 million people are estimated to have IGT (impaired glucose tolerance) globally and about 6.7 million people (20–79 years old) died of diabetes and its complications in 2021. Further, globally the proportion of undiagnosed diabetes is high, standing at 45%, and most of them are Type 2 Diabetes Mellitus (T2DM). T2DM is characterized by chronic hyperglycemia due to defective insulin secretion or action and disturbances in protein and lipid metabolism. As a result of diabetes, dyslipidemia is characterized by a high triglyceride concentration and low High- Density Lipoprotein-Cholesterol (HDL-C) concentration as well as elevated concentrations of Low-Density Lipoprotein-Cholesterol (LDL-C) particles [2], and the main feature of T2DM is insulin resistance [3]. Therefore, more studies are still required to find an effective treatment for this disease.
Empty and out solid, empty of liver, spleen and kidney is reason, phlegm turbidity and congestionis outer phenomenon, which are the basic TCM pathogenesis of this condition. Danggui- Shaoyao-San (DSS) is a famous prescription in the Synopsis of the Golden Chamber written by Zhang Zhongjing, a famous doctor in the Han Dynasty. DSS, has the advantages of activating blood, invigorating the spleen and eliminating dampness, tonifying deficiency and removing reality, dispelling blood stasis, and resolving phlegm, is composed of Angelica sinensis (Oliv.) Diels (Chinese name: Danggui), Atractylodesmacrocephala Koidz. (Chinese name: Baizhu), Paeonia lactiflora Pall. (Chinese name: Baishao), Alisma plantago-aquatica Linn. (Chinese name: Zexie), Poriacocos (Schw. ) Wolf (Chinese name: Fuling), and Ligusticum chuanxiong Hort. (Chinese name: Chuanxiong). In recently years, some studies based on DSS intervention indicated good hypoglycemic effect for T2DM mice [4,5]. Modern pharmacological studies have shown that many active ingredients in DSS, such as paeoniflorin, ferulic acid, pachymic acid, polysaccharides and et al, have effects on evading oxidative stress, ameliorating inflammation and regulating lipid metabolism in diabetes [6-11]. However, multi-components and multiple targeting characteristics of Chinese herbal medicineplay a common role in the curative effect, and thus, it is difficult to clarify the underlying mechanism of DSS.
The purpose of metabolomics is to measure metabolite concentrations in cells, tissues, organs, and biological systems to study the chemical processes involved in metabolism in a systematic fashion [12,13], which is consistent with the concept of “wholism” in TCM [14]. Mass Spectrometry (MS) is a tool widely used for metabolomics research, and Ultra-Performance Liquid Chromatography and Mass Spectroscopy (UPLC–MS) can detect a wide range of low-molecular-weight compounds, such as secondary metabolites [15]. Untargeted metabolomics studies using MS have been widely used in the identification and quantification of endogenous small molecules in T2DMand have revealed several metabolic pathways [16,17] It can construct related networks from the perspective of biological systems to explore the pathogenesis of diseases.
Materials and Methods
Chemicals and Reagents
Streptozotocin (STZ) (Sigma-Aldrich, Saint Louis, USA), Acetonitrile (Fisher Chemical), high-speed centrifuge (Sigma), enzyme-labeled detector (Shanghai Spectrum Instrument Co., LTD China), andglycated hemoglobin (GHb) and serum Fasting insulin (FINS) were measured using the ELISA Kit (Mei mian, Jiangsu, China).
Preparations of p-DSS
DSS, composed of Radix Angelicae sinensis (Dang Gui, 45g, root of Angelica sinensis (Oliv) Diels.), Radix Paeoniae alba (Bai Shao, 240g, root of Paeonia lactiflora Pall.), Poria Cocos (Fu Ling, 60g, sclerotium of Poriacocos (Schw.) Wolf.), Rhizoma Atractylodis Macrocephalae (Bai Zhu, 60g, rhizome of Atractylodes Macrocephala Koidz.), Rhizoma Alismatis (Ze Xie, 120g, rhizome of Alisma orientalis (Sam.) Juzep.) and Rhizoma Chuanxiong (Chuan Xiong, 120g, rhizome of Ligusticum chuanxiong Hort.) was purchased from Local medicine wholesale market. Using 10, 8, 6 times the quality of water to decoct successively these drugs for 3 times, each time for 1.5 hours. The filtrate was combined three times and concentrated into an extract via decompression. Then four-fold volume of ethanol (95%, v/v) was added into the extract and stored at 4°C. After 12 hours, the precipitations were collected and washed by absolute ethanol. Finally, the sample was dried to obtain crude polysaccharides of Danggui- Shaoyao-San (p-DSS). 1 g of p-DSS is equivalent to 7.5 g of crude drug.
Animals
Healthy male (6 weeks of age, mass: 200 ± 20 g) and female (6 weeks of age, mass: 150±20g) Sprague–Dawley (SD) rats were purchased from Heilongjiang University of Chinese Medicine, Heilongjiang, China. The controlled animal area was maintained at 22 ± 2°C and 55 ± 10% relative humidity under a 12-hour light/dark cycle (7:00 am–7:00 pm). All animal experiments were performed in accordance with the Guidelines for the Care and Use of Laboratory Animals of Heilongjiang University of Chinese Medicine.
Establishment and Administration of the T2DM Rat Model
T2DM rats were induced by the combination of high-fat diet feeding and low-dose STZ injection according to the method described previously with some modifications [18]. Briefly, After adaptive feeding for one week, rats were randomly divided into the control group and the T2DM group. The control group was fed with standard Normal Diet (ND), while the T2DM group was fed with high sugar and fat diet (HFD, powdered normal pellet diet, 73.5%;lard, 10%; sucrose, 10 %; cholesterol, 5 %; protein, 1%; sodium cholate, 0.5%) for 4 weeks. HFD–treated rats were injected intraperitoneally (i.p.) with a single dose of STZ (40mg/kg) dissolved in citrate buffer (pH 4.5). ND-treated rats only received an equivalent volume of citrate buffer. On the 2 weeks after injection, blood glucose concentrations were monitored from the tail vein using blood glucose meter after a 12 hour fast. Rats with Fasting Blood Glucose (FBG) over 11.1 mmol/L were considered as successful T2DM models. Successful T2DM model rats were randomly divided into model, met for min(50mg/kg), low-dose of p-DSS(p-DSSL, 110mg/kg) and highdose of p-DSS(p-DSSH, 220mg/kg) groups, Each group including 9 rats(female) or 6 rats(male). The body weight and fasting blood glucose of rats were monitored every 7 days until the end of the experiment.
Oral Glucose Tolerance Test (OGTT) and Insulin Tolerance Test (ITT)
After four weeks of treatment, OGTT and ITT were carried out respectively. For OGTT, rats were fasted for 12h and blood glucose values were determined (time = 0 min). Then rats were orally administered glucose (2g/kg) and blood glucose levels were measured at30, 60, 90 and 120 min.
For ITT, rats were fasted for 4h and blood glucose values were determined (time = 0 min). Then rats were intraperitoneally administered with insulin(0.75U/kg) and blood glucose levels were measured at30, 60, 90 and 120 min.
Blood, Urine and Tissue Sample Collection
At the end of the experiment, urine was collected in metabolic cages. Rats were anesthetized and decapitated after a 12h fast. Blood was sampled from the abdominal aorta and centrifuged at 2500 × g for 15 min, the separated serum was stored at –80°C for further assays. Liver, kidney and spleen were quickly removed, rinsed, weighted and stored at –80°C or fixed in 10%paraformaldehyde solution.
Sample Preparation and Examination
The urine/serum sample (100 μL) was mixed with acetonitrile (300 μL), and then it was vortexed for 1 min and left standing undisturbed for 20 min at -20°C, then centrifuged at 14,000 rmp for 20 min. Eventually, each sample was equally mixed into a Quality Control (QC) sample for metabolic analysis.
Chromatography and Mass Spectrometry Conditions
Intact-mass analysis was performed with a Waters SYNAPT G2-Si High Definition Mass Spectrometer in conjunction with a UPLC system (Waters). The samples were collected on an Acquity UPLC HSS T3 column (2.1×100mm, 1.8μm) with a temperature of 40 °C, and a flow rate of 0.3 mL/ min. The mobile phase consisted of solvent A (water+0.1% formic acid) and solvent B (acetonitrile+0.1% formic acid).
For serum of male rats: In positive (POS) ion mode, the gradient elution conditions were set as follows: 0–1 min, 0% phase B; 1–2 min, 0%–20% phase B; 2–17 min, 20%–100% phase B; 17– 18 min, 100% phase B, 18–20 min, 100%-0% phase B. In negative (NEG) ion mode, the gradient elution conditions were set as follows: 0-2 min, 0%-20% phase B; 2–5 min, 20%–40% phase B; 5–6 min, 40%–70% phase B; 6–12 min, 70%–100% phase B, 12–14 min, 100%-0% phase B.
For serum of female rats: In POS ion mode, the gradient elution conditions were set as follows: 0–1 min, 0% phase B; 1–2 min, 0%–20% phase B; 2–15 min, 20%–100% phase B; 15–16 min, 100% phase B, 16–17 min, 100%-0% phase B. In NEG ion mode, the gradient elution conditions were set as follows: 0-2 min, 0%-20% phase B; 2–4 min, 20%–70% phase B; 4–12 min, 70%–100% phase B; 12–13 min, 100% phase B, 13–14 min, 100%-0% phase B;
For urine of male and female rats: In POS ion mode, the gradient elution conditions were set as follows: 0–2 min, 0%-40% phase B; 2–9 min, 40%–100% phase B; 9–10 min, 100%–0% phase B; 10–11 min, 0% phase B. In NEG ion mode, the gradient elution conditions were set as follows: 0-2 min, 0%-40% phase B; 2–7 min, 40%–60% phase B; 7–9 min, 60%–100% phase B; 9–10 min, 100%-0% phase B, 10–11 min, 0% phase B. To evaluate the stability of the UPLC-MS during acquisition, a QC sample was acquired after 10 samples.
Date Analysis
The raw data were imported into the software Progenesis QI v. 1.0 for peak detection and alignment. Then unsupervised Principal Component Analysis (PCA) was used to obtain a general overview of the variance of metabolic phenotypes and supervised Partial Least Squares Discriminant Analysis (PLS-DA) was used to calculate the corresponding Variable Importance in Projection (VIP) in metabolites by EZ info software v. 3.0 (Waters). Next, the metabolites with VIP > 1 and P < 0.05 were used as potential biomarkers. To check the exact molecular weight, an online database was searched—HMDB (http://www.hmdb. ca) to explain the mass spectra and identify the structure of the compounds.
Statistical Analysis
All data was expressed as means ± Standard Error of the Mean (SEM). The statistical differences between groups were evaluated by one-way or two-way analysis of variance (ANOVA) using Graph Pad Prism 8.4 software (GraphPad, La Jolla, CA, United States). Student´s t-test was applied to compare variables in metabolomics. Data were considered significant when p < 0.05 (one symbol p < 0.05, two symbols, p < 0.01, three symbols p < 0.001, four symbols p < 0.0001).
Results
Body Weight
As shown in (Figure 1), in female and male rats, before administration (week 0), body weight of rats in the model, metformin, p-DSSH and p-DSSL group, were higher than that of rats in the control group. After treatment for four weeks, in female rats, body weight of rats in the metformin groups were gradually increased, and slowly increased in p-DSSH and p-DSSL group (Figure 1A). Additionally, it was also found that the weight gain in the metformin group was observably higher than that in the model group, a similar trend was noticed in the p-DSSH and p- DSSL group, however, no statistical significance was observed (Figure 1B). In male rats, the weight loss continued until two weeks of treatment in the model, metformin, p-DSSH and p- DSSL group, then body weight of rats in these groups were gradually increased in the last two weeks of treatment (Figure 1C). Furthermore, the weight gain in these three groups was higher than that in the model group but no statistical significance was observed (Figure 1D).
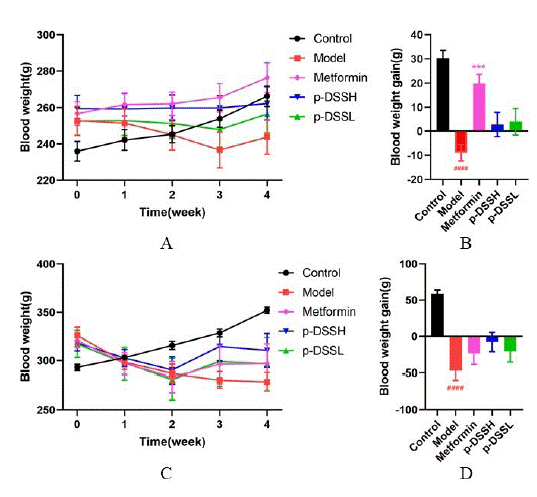
    Figure 1: General effects of metformin and p-DSS intragastric administration

on HFD/STZ-T2DM rats. BW (A), weight gain (B) in

female rats, BW (C), weight gain (D) in male rats. Data represent

mean ± SEM (n = 6-9,, Control vs. Model, ###p < 0.001, ####p < 0.0001;

Model vs. Metformin, p-DSSH and p-DSSL, ***p < 0.001). (A) and (C)

were analyzed by two-way ANOVA, (B) and (D) were analyzed by

one-way ANOVA.
Organ Indices
Visceral indices of different organs in female and male rats showed that liver and kidney indices of the model group were increased significantly compared with the control group. Metformin and p-DSS treatment notably reduced the liver and kidney indices of rats (Figure 2A,B,D & E). However, splenic index was not significantly different in all groups (Figure 2C, F).
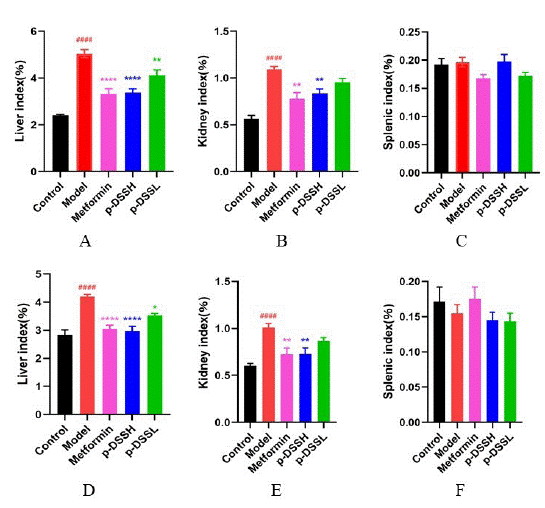
    Figure 2: Liver (A), kidney (B) and splenic index (C) in female and

male (D, E, F respectively) rats after four-week treatment. Data represent

mean ± SEM (n = 6-9, Control vs. Model, ####p < 0.0001; Model

vs. p-DSSH and p-DSSL, *p < 0.05, **p < 0.01, ****p < 0.0001). All

data were analyzed by one-way ANOVA.
Blood Glucose Levels
(Figure 3 and Figure 6C, F) presents fasting blood glucose levels in female and male rats. After STZ injection, the Model group glucose and GHb levels increased dramatically compared to Control group and glucose levels remained at this high level until the end of the experiment. In contrast, glucose and GHb levels in Metformin and p-DSSH group was significantly lower than that in Model group at week 4.
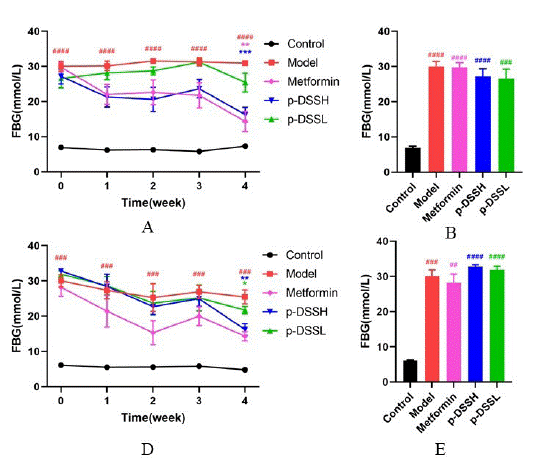
    Figure 3: p-DSS improved fasting blood glucose (FBG) in rats. FBG

in female rants (A) and male rats (D); FBG of week 0 (before intragastric

administration) in female rats (B) and male rats (E); FBG of

week 4 (4 weeks after intragastric administration) in female rats

(C) and male rats (F). Data represent mean ± SEM (n = 6-9, Control

vs. Model, ##p < 0.01, ###p < 0.001, ####p < 0.0001; Model vs. Metformin

p-DSSH and p-DSSL, *p < 0.05, **p < 0.01, ***p < 0.001, ****p

< 0.0001). (A) and (D) were analyzed by two-way ANOVA, the rest

were analyzed by one-way ANOVA.
Oral Glucose Tolerance Test
As shown in Figure 4, at the end of the experiment, glucose tolerance was seriously impaired in Model group. The glucose Area Under the Curve (AUC) for the OGTT value in Model group rats was significantly larger than that of Control group. The glucose AUC was significantly lower following oral gavage of metformin and p-DSS to rats compared to Model group, and the best effect was observed in the Metformin group followed by the p-DSSH group, while the p-DSSL group showed the lowest effects. In addition, results were similar regardless of gender.
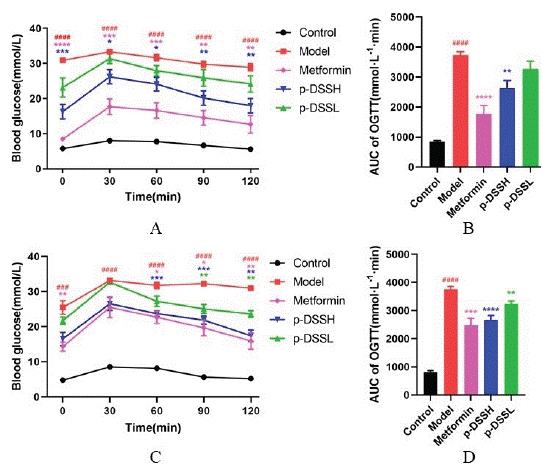
    Figure 4: Effects of p-DSS on oral glucose tolerance in female and

male rats. Blood glucose levels during OGTT in female (A) and male

rats (C); AUC based on OGTT data in female (B) and male rats (D).

Data represent mean ± SEM (n = 6-9, Control vs. Model, ####p <

0.0001; Model vs. Metformin p-DSSH and p-DSSL, *p < 0.05, **p <

0.01, ***p < 0.001, ****p < 0.0001). (A) and (C) were analyzed by twoway

ANOVA, the rest were analyzed by one-way ANOVA.
Insulin Tolerance Test
Insulin sensitivity was evaluated by ITT at the end of the experiment. The results revealed a higher blood glucose level at each time point and AUC in group, while metformin and p-DSS treatment effectively improved insulin sensitivity (Figure 5). Additionally, fasting serum insulin levels and HOMA-IR indexes increased significantly in Model group, while metformin and p- DSS treatment attenuated IR of T2DM rats (Figure 6).
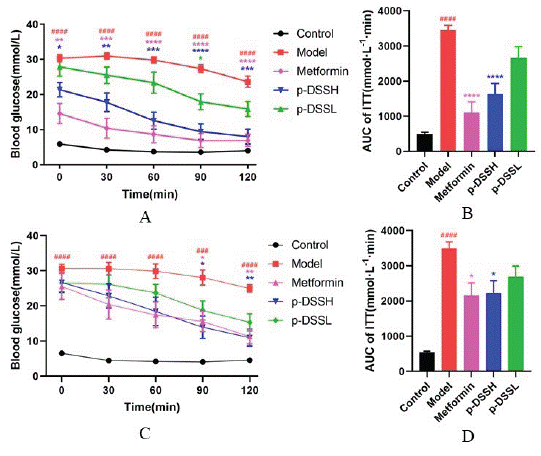
    Figure 5: Effects of p-DSS on insulin tolerance test in female and

male rats. Blood glucose levels during ITT in female (A) and male

rats (C); AUC based on ITT data in female (B) and male rats (D). Data

represent mean ± SEM (n = 6-9, Control vs. Model, ###p < 0.001, ####p

< 0.0001; Model vs. Metformin p-DSSH and p-DSSL, *p < 0.05, **p <

0.01, ***p < 0.001, ****p < 0.0001). (A) and (C) were analyzed by twoway

ANOVA, the rest were analyzed by one-way ANOVA.
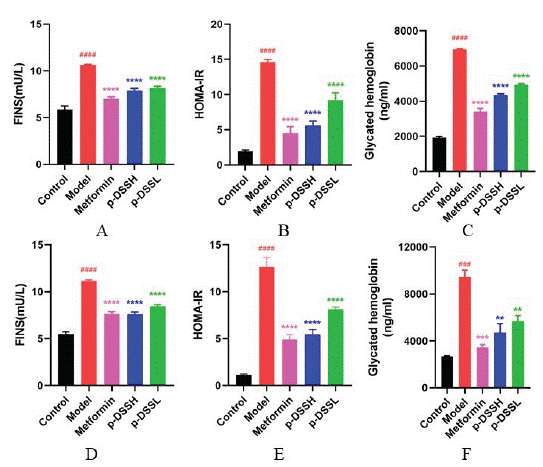
    Figure 6: The FINS in female (A) and male rats (D), HOMA-IR level

in female (B) and male rats (E) and GHb in female (C) and male (F)

rats after treatment. Data represent mean ± SEM (n = 6-9, Control

vs. Model, ###p < 0.001, ####p < 0.0001; Model vs. Metformin p-DSSH

and p-DSSL, **p < 0.01, ***p < 0.001, ****p < 0.0001). All data

were analyzed by one-way ANOVA.
Metabolomics Results
The PCA score plot suggested that the inter-groups were well separated, the p-DSSH and metformin groups were closer to the control group than the p-DSSL and model groups, indicating that metformin and p-DSSH had a better therapeutic effect than p-DSSL group (Figure 7). In addition, we screened the metabolites with VIP value > 1 and P < 0.05 (Figure 8), and then searched for these metabolites in the Kyoto encyclopedia of genes and genomes database (KEGG http://www.kegg.com) and Human Metabolome Database (HMDB https://hmdb.ca/). Finally, by comparing the relative content changes in these differential metabolites, twelve urine potential metabolites were identified in male and nineteen in female rats (Table 1 and Table 2). Therefore, results suggested that p-DSS can upregulate the biomarkers, such as O-Sulfotyrosine, oxoglutaric acid, norepinephrine sulfate, cervonoylethanolamide in male rats, and gamma-CEHC, tetrahydrodeoxycortisol, indoxyl sulfate in female rats, and down regulate the biomarkers such as isobutyryl- L-carnitine, N-acetyl aspartyl glutamic acid, 3-Nitrotyro-sine in male rats and12-HETE, Cer (d18:0/14:0), leukotriene B4 in female rats. Their main urine metabolic pathways including alanine, aspartate and glutamate metabolism, glycerophospholipid metabolism, citrate cyclein male rats and arachidonic acid metabolism, tryptophan metabolism, steroid hormone biosynthesis in female rats (Figure 9).
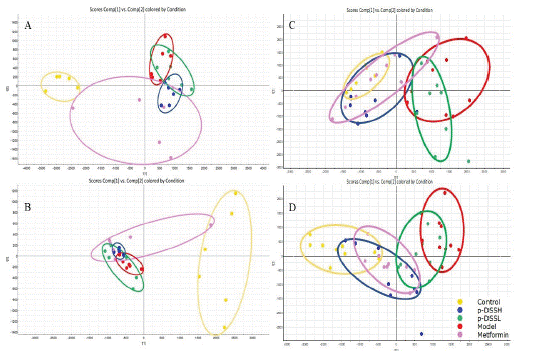
    Figure 7: Principal Component Analysis (PCA) scores plot of male

rat urine in positive (A) and negative (B) ion modes; female rat

urine in positive (C) and negative (D) ion modes.
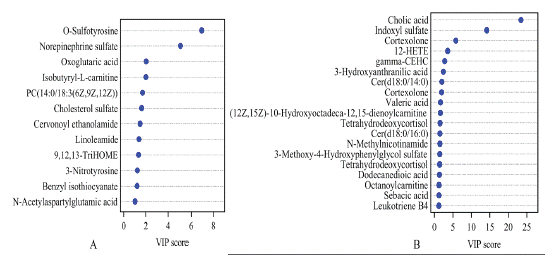
Figure 8: The VIP plot of male (A) and female (B) rats.
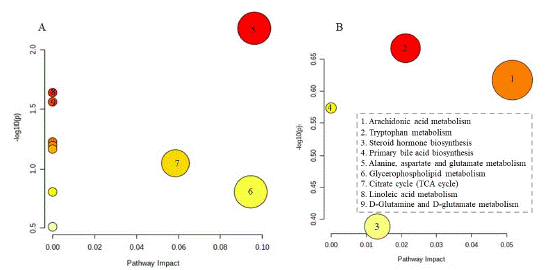
    Figure 9: Main urine metabolic pathway impact analysis of male (A)

and female (B) rats.
    No.

    Tr(min)

    m/z

    Chemicial formula

    Metabolites

    Ionization mode

    VIP


    1

    10.58

    710.5137

    C40H74NO8P

    PC(14:0/18:3(6Z,9Z,12Z))

    M+H-H2O

    1.69


    2

    10.39

    661.4877

    C18H34O5

    9,12,13-TriHOME

    2M+H

    1.33


    3

    9.02

    245.1589

    C11H21NO4

    Isobutyryl-L-carnitine

    2M+3H2O+2H

    2.00


    4

    10.53

    327.0812

    C11H16N2O8

    N-Acetylaspartylglutamic    acid

    M+Na

    1.02


    5

    10.2

    559.5173

    C18H33NO

    Linoleamide

    2M+H

    1.37


    6

    10.27

    337.0245

    C8H7NS

    Benzyl    isothiocyanate

    2M+K

    1.21


    7

    9.09

    372.2681

    C24H36O3

    Cervonoylethanolamide

    2M+3H2O+2H

    1.47


    8

    10.70

    465.3067

    C27H46O4S

    Cholesterol sulfate

    M-H

    1.61


    9

    2.90

    242.0122

    C9H11NO6S

    O-Sulfotyrosine

    M-H2O-H

    6.94


    10

    3.69

    337.0408

    C5H6O5

    Oxoglutaric acid

    2M+FA-H

    2.02


    11

    4.91

    271.0585

    C9H10N2O5

    3-Nitrotyrosine

    M+HCOO

    1.23


    12

    3.17

    230.0127

    C8H11NO6S

    Norepinephrine    sulfate

    M-H2O-H

    5.11
Table 1: The details of twelve urine potential metabolites in male rats.
    No.

    tr(min)

    m/z

    Chemicial formula

    Metabolites

    Ionization mode

    VIP


    1

    9.96

    663.4583

    C20H32O3

    12-HETE

    2M+Na

    3.63


    2

    9.97

    512.5049

    C32H65NO3

    Cer(d18:0/14:0)

    M+H

    2.03


    3

    10.69

    439.3302

    C25H45NO5

    (12Z,15Z)-10-Hydroxyoctadeca-12,15-dienoylcarnitine

    M+NH4

    1.61


    4

    10.52

    540.5366

    C34H69NO3

    Cer(d18:0/16:0)

    M+H

    1.50


    5

    10.5

    337.2377

    C20H32O4

    Leukotriene B4

    M+H

    1.18


    6

    2.60

    153.0431

    C7H7NO3

    3-Hydroxyanthranilic    acid

    M+H

    2.44


    7

    5.04

    346.2148

    C21H30O4

    Cortexolone

    M+H

    5.78


    8

    3.94

    288.2181

    C15H29NO4

    Octanoylcarnitine

    M+H

    1.23


    9

    6.14

    350.2472

    C21H34O4

    Tetrahydrodeoxycortisol

    2M+H

    1.53


    10

    0.86

    137.0714

    C7H8N2O

    N-Methylnicotinamide

    M+H

    1.47


    11

    3.96

    229.1446

    C12H22O4

    Dodecanedioic acid

    M-H

    1.33


    12

    6.65

    408.2862

    C24H40O5

    Cholic acid

    M-H

    23.41


    13

    4.00

    203.1285

    C5H10O2

    Valeric acid

    2M-H

    1.66


    14

    3.13

    309.1372

    C15H20O4

    gamma-CEHC

    M+HCOO

    2.79


    15

    7.47

    345.208

    C21H30O4

    Cortexolone

    M-H

    1.97


    16

    1.18

    263.0233

    C9H12O7S

    3-Methoxy-4-Hydroxyphenylglycol    sulfate

    M-H

    1.44


    17

    3.5

    201.1127

    C10H18O4

    Sebacic acid

    M-H

    1.22


    18

    7.09

    349.2392

    C21H34O4

    Tetrahydrodeoxycortisol

    M-H

    1.41


    19

    3.39

    212.002

    C8H7NO4S

    Indoxyl sulfate

    M-H

    14.17
Table 2: The details of nineteen urine potential metabolites in female rats.
Discussion
Biochemical Analysis
A large number of studies have shown that some drugs in DSS can regulate glucose levels. DSS can improve the impaired glucose tolerance and insulin resistance [19]. Radix Angelicae sinensis can improve diabetic renal damage [20], and reduce inflammatory factors [21]. Ligusticum chuanxiong Hort. can prevent STZ-induced increases of urine production, urinary albumin excretion and urine albumin-to-creatinine ratio, and markedly attenuate STZ-induced renal damages [22]. In our study, for either male or female, biochemical results revealed that after treatment with p-DSS, the level of HOMA-IR was decreased compared with those in the model group. Therefore, the above results indicated that p-DSS has good effects on lowering the blood glucose level.
Metabolomics Analysis
As shown in Figure 10, for male rats, our results showed that p-DSS can effectively regulate the differential metabolites in multiple metabolic pathways related to T2DM. For some differential metabolites, such as PC, Isobutyryl-L-carnitine, NAcetyl Aspartyl Glutamic acid (NAAG), Cervonoylethanolamide, 2-Oxoglutarate and Norepinephrine sulfate, p-DSS and metformin showed the same regulatory trend, and thus, there may be some similarities in their hypoglycemic mechanisms.
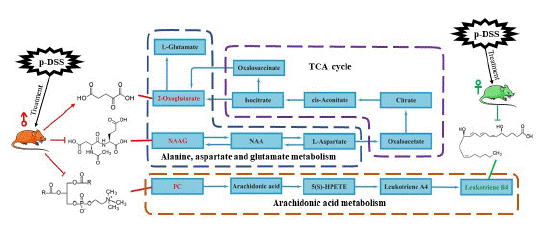
    Figure 10: Potential metabolic pathways regulated in T2DM rats

after treatment with p-DSS. The red font represents biomarkers of

male rats, and green font represents biomarkers of female rats.
It has been shown that higher NAAG was observed in the hippocampus of rats on a high-fat diet [23], and N-Acetylaspartic Acid (NAA) in the hippocampus may be a predictive marker of early diabetes [24]. NAA is the precursor of NAAG synthesis, and NAA is converted to aspartic acid and acetic acid by aspartate acylase. Abnormal levels of the enzyme lead to the accumulation of NAA, and these changes have been observed in Canavan disease and type 2 diabetes mellitus [25]. High levels of the neurotransmitter, known as NAA, can lead to abnormal nerve signaling, delayed or stalled mental development, and difficulties with general motor skills. So many N-acetylamino acids, including NAA, is classified as a uremic toxin if present in high amounts in serum or plasma [26,27], and emerging evidence suggests that more uremic retained solutes may contribute to an increased risk of diabetes [28].
Oxoglutaric acid, also known as 2-oxoglutarate oralpha-ketoglutarate (AKG). AKG is a key molecule in the TCA cycle and plays an important role in determining the total rate of this important metabolic process [29]. AKG dehydrogenase decarboxylates AKG to succinyl-CoA and carbon dioxide, and AKG dehydrogenase is a critical control point in the TCA cycle. In addition, AKG can be generated by oxidative decarboxylation catalyzed by Isocitrate Dehydrogenase (IDH). Studies have found that Dimethyl-2-Oxoglutaric acid (DM-2OG), a tricarboxylic acid cycle metabolite with antioxidant properties, can improve cellular REDOX balance and mitochondrial function [30], and AKG supplementation can promote beige adipogenesis and reduce HFD-induced obesity in middle-aged mice [31], similar results were seen in transgenic mice [32]: SIRT5 is required for brown adipose gene activation in vitro, and SIRT5 knockdown reduced intracellular AKG concentration. In our study, AKG was one of its differential metabolites, indicating that its TCA cycle may be abnormal.
In female rats, these differential metabolites were changed: Leukotriene B4, Cholic acid, gamma-CEHC, Indoxyl sulfate, Tetrahydrodeoxycortisol, Cer (d18:0/16:0) and N-Methylnicotinamide. And it had the same trend as metformin group.
Choline is an essential nutrient for humans [33]. In diet, it exists as free choline and as choline esters, of which Phosphatidylcholine (PC) is the major dietary source of choline. However, excessive dietary phosphatidylcholine intake was associated with a higher risk of T2DM [34]. Abnormally high levels of cellular PC lipids are associated with insulin resistance [35], and High Fat Diet (HFD) promotes PC overproduction and insulin resistance [36]. In addition, the more dietary phosphatidylcholine intake, the higher the risk of T2DM [37].
Leukotrienes are lipid mediators whose production is increased during inflammation. Activated phospholipase A2 releases arachidonic acid from membrane phospholipids. Liberated (soluble) arachidonic acid can be metabolized by 5-lipoxygenase (5-LO) to produce leukotrienes including LTB4 and cysteinyl leukotrienes, LTC4, LTD4, and LTE4. It has been found [38] that LTB4 is an important mediator of insulin resistance development in T2D, and LTB4 can mediate β-cell destruction by increasing reactive oxygen and nitrogen species. Moreover, excessive local leukotriene B4 levels indicate poor skin host defense in diabetic mice [39]. Some studies have shown that the liver LTB4 level in STZ-induced T2DM rats is significantly increased compared with the normal group [40]. In addition, LTB4 is significantly increased in obesity, and liver LTB4/LTB4 receptor 1 (Ltb4r1) may be a potential therapeutic target for NAFLD [41]. In our study, arachidonic acid metabolism was a metabolic pathway shared by both sexes. p-DSS can significantly reduce urinary PC in male rats and LTB4 in female rats, indicating that p-DSS may have a certain regulatory effect on lipid metabolism and arachidonic acid metabolism.
Conclusion
This study showed that p-DSS could affect glycometabolism in T2DMrats by improving a series of biochemical indicators, regulating disordered metabolites and their metabolic pathways to a normal state. However, the mechanisms of p-DSS in male and female rats are not identical. It is worth noting that p-DSS can effectively treat T2DM by regulating biomarkers, such as PC, 2-oxoglutarate, NAAG in TCA cycle and alanine, aspartate and glutamate metabolism for male rats, or leukotriene B4, cholic acid in arachidonic acid metabolism and primary bile acid biosynthesis for female rats. Thus, the results obtained in this study indicated that p-DSS can be used as a potential drug to treat T2DM through multiple links and targets.
Author Contributions
Xin F: writing – review and editing, resources, conceptualization. Si-han L: writing – original draft, methodology, investigation, validation, formal analysis, visualization. Jia-jun L: investigation, validation. Zhi-bin W: funding acquisition.
Funding
This work was supported by the National Natural Science Foundation of China (Grant No., 81973746); the Science Foundation of Heilongjiang Province (Grant No. QC2017114); the Science Foundation of Heilongjiang Province of Administration of Traditional Chinese Medicine Technology (Grant No. ZHY16- 089); the Science Foundation of Heilongjiang Province Harbin City Technology Bureau (Grant No. 2016RAQXJ214).
References
- International Diabetes Federation. IDF Diabetes Atlas. https://www.idf.org/
- Mooradian AD. Dyslipidemia in type 2 diabetes mellitus. Nat Clin Pract Endocrinol Metab. 2009; 5: 150-159.
- Rask-Madsen C, Kahn CR. Tissue-specific insulin signaling, metabolic syndrome, and cardiovascular disease. Arterioscler Thromb- Vasc Biol. 2012; 32: 2052-2059.
- Shi JJ, Liu HF, Hu T, Gao X, Zhang YB, Li WR, et al. Danggui-Shaoyao- San improves cognitive impairment through inhibiting O-GlcNAcmodification of estrogen α receptor in female db/db mice. J Ethnopharmacol. 2021; 281: 114562.
- Liu IM, Tzeng TF, Liou SS, Chang CJ. Beneficial effect of traditional chinese medicinal formula danggui-shaoyao-san on advanced glycation end-product-mediated renal injury in streptozotocindiabetic rats. Evid Based Complement Alternat Med. 2012; 2012: 140103.
- Bi Y, Han X, Lai Y, Fu Y, Li K, Zhang W, et al. Systems pharmacological study based on UHPLC-Q-Orbitrap-HRMS, network pharmacology and experimental validation to explore the potential mechanisms of Danggui-Shaoyao-San against atherosclerosis. J Ethnopharmacol. 2021; 278: 114278.
- Fu X, Wang Q, Wang Z, Kuang H, Jiang P. Danggui-Shaoyao-San: New Hope for Alzheimer’s Disease. Aging Dis. 2015; 20: 502-513.
- Ghosh S, Chowdhury S, Sarkar P, Sil PC. Ameliorative role of ferulic acid against diabetes associated oxidative stress induced spleen damage. Food Chem Toxicol. 2018; 118: 272-286.
- Yang H, Song L, Sun B, Chu D, Yang L, Li M, et al. Modulation of macrophages by a paeoniflorin-loaded hyaluronic acid-based hydrogel promotes diabetic wound healing. Mater Today Bio. 2021; 12: 100139.
- Kim JH, Sim HA, Jung DY, Lim EY, Kim YT, Kim BJ, et al. Poriacocus Wolf Extract Ameliorates Hepatic Steatosis through Regulation of Lipid Metabolism, Inhibition of ER Stress, and Activation of Autophagy via AMPK Activation. Int J Mol Sci. 2019; 20: 4801.
- Fu X, Liu Q, Sun X, Chang H, Liu Y, Han J. Research Advances in the Treatment of Alzheimer’s Disease with Polysaccharides of Danggui- Shaoyao-San. J Alzheimers Dis. 2022; 85: 7-19.
- Chen ZZ, Gerszten RE. Metabolomics and Proteomics in Type 2 Diabetes. Circ Res. 2020; 126: 1613-1627.
- Nicholson JK, Lindon JC. Systems biology: Metabonomics. Nature. 2008; 455: 1054-1056.
- Ju WJ, Zhao ZK, Chen SL, Zhou DD, Yang WN, Wen XP, et al. Buzhongyiqi Decoction Protects Against Loperamide-Induced Constipation by Regulating the Arachidonic Acid Pathway in Rats. Front Pharmacol. 2020; 11: 423.
- Wasai M, Fujimura Y, Nonaka H, Kitamura R, Murata M, Tachibana H. Postprandial glycaemia-lowering effect of a green tea cultivar Sunrouge and cultivar-specific metabolic profiling for determining bioactivity-related ingredients. Sci Rep. 2018; 8: 16041.
- Arneth B, Arneth R, Shams M. Metabolomics of Type 1 and Type 2 Diabetes. Int J Mol Sci. 2019; 20: 2467.
- Pan L, Li Z, Wang Y, Zhang B, Liu G, Liu J. Network pharmacology and metabolomics study on the intervention of traditional Chinese medicine Huanglian Decoction in rats with type 2 diabetes mellitus. J Ethnopharmacol. 2020; 258: 112842.
- Reed MJ, Meszaros K, Entes LJ, Claypool MD, Pinkett JG, Gadbois TM, et al. A new rat model of type 2 diabetes: the fat-fed, streptozotocin- treated rat. Metabolism. 2000; 49: 1390-1394.
- Shi JJ, Liu HF, Hu T, Gao X, Zhang YB, Li WR, et al. Danggui-Shaoyao-San improves cognitive impairment through inhibiting O-GlcNAcmodification of estrogen α receptor in female db/db mice. J Ethnopharmacol. 2021; 281: 114562.
- Sui Y, Liu W, Tian W, Li XQ, Cao W. A branched arabinoglucan from Angelica sinensis ameliorates diabetic renal damage in rats. Phytother Res. 2019; 33: 818-831.
- Wang K, Cao P, Shui W, Yang Q, Tang Z, Zhang Y. Angelica sinensis polysaccharide regulates glucose and lipid metabolism disorder in prediabetic and streptozotocin-induced diabetic mice through the elevation of glycogen levels and reduction of inflammatory factors. Food Funct. 2015; 6: 902-909.
- Yang WJ, Li YR, Gao H, Wu XY, Wang XL, Wang XN, et al. Protective effect of the ethanol extract from Ligusticum chuanxiong rhizome against streptozotocin-induced diabetic nephropathy in mice. J Ethnopharmacol. 2018; 227: 166-175.
- Raider K, Ma D, Harris JL, Fuentes I, Rogers RS, Wheatley JL, et al. A high fat diet alters metabolic and bioenergetic function in the brain: A magnetic resonance spectroscopy study. Neurochem Int. 2016; 97: 172-180.
- Samoilova J, Matveeva M, Tonkih O, Kudlau D, Oleynik O, Kanev A. A Prospective Study: Highlights of Hippocampal Spectroscopy in Cognitive Impairment in Patients with Type 1 and Type 2 Diabetes. J Pers Med. 2021; 11: 148.
- Surendran S. Upregulation of N-acetylaspartic acid alters inflammation, transcription and contractile associated protein levels in the stomach and smooth muscle contractility. Mol Biol Rep. 2009; 36: 201-206.
- Tanaka H, Sirich TL, Plummer NS, Weaver DS, Meyer TW. An Enlarged Profile of Uremic Solutes. PLoS One. 2015; 10: e0135657.
- Toyohara T, Akiyama Y, Suzuki T, Takeuchi Y, Mishima E, Tanemoto M, et al. Metabolomic profiling of uremic solutes in CKD patients [published correction appears in Hypertens Res. Metabolomic profiling of uremic solutes in CKD patients. Hypertens Res. 2010; 33: 944-52.
- Koppe L, Fouque D, Soulage CO. Metabolic Abnormalities in Diabetes and Kidney Disease: Role of Uremic Toxins. Curr Diab Rep. 2018; 18: 97.
- Wu N, Yang M, Gaur U, Xu H, Yao Y, Li D. Alpha-Ketoglutarate: Physiological Functions and Applications. BiomolTher(Seoul). 2016; 24: 1-8.
- Faulkner A, Tamiato A, Cathery W, Rampin A, Caravaggi CM, Jover E, et al. Dimethyl-2-oxoglutarate improves redox balance and mitochondrial function in muscle pericytes of individuals with diabetes mellitus. Diabetologia. 2020; 63: 2205-2217.
- Tian Q, Zhao J, Yang Q, Wang B, Deavila JM, Zhu MJ, et al. Dietary alpha-ketoglutarate promotes beige adipogenesis and prevents obesity in middle-aged mice. Aging Cell. 2020; 19: e13059.
- Shuai L, Zhang LN, Li BH, Tang CL, Wu LY, Li J, et al. SIRT5 Regulates Brown Adipocyte Differentiation and Browning of Subcutaneous White Adipose Tissue. Diabetes. 2019; 68: 1449-1461.
- Zeisel SH, da Costa KA. Choline: an essential nutrient for public health. Nutr Rev. 2009; 67: 615-623.
- Li Y, Wang DD, Chiuve SE, Manson JE, Willett WC, Hu FB, et al. Dietary phosphatidylcholine intake and type 2 diabetes in men and women. Diabetes Care. 2015; 38: e13-e14.
- van der Veen JN, Lingrell S, McCloskey N, LeBlond ND, Galleguillos D, Zhao YY, et al. A role for phosphatidylcholine and phosphatidylethanolamine in hepatic insulin signaling. FASEB J. 2019; 33: 5045-5057.
- Pacana T, Cazanave S, Verdianelli A, Patel V, Min HK, Mirshahi F, et al. Dysregulated Hepatic Methionine Metabolism Drives Homocysteine Elevation in Diet-Induced Nonalcoholic Fatty Liver Disease. PLoS One. 2015; 10: e0136822.
- Li Y, Wang DD, Chiuve SE, Manson JE, Willett WC, Hu FB, et al. Dietary phosphatidylcholine intake and type 2 diabetes in men and women. Diabetes Care. 2015; 38: e13-e14.
- Filgueiras LR, Serezani CH, Jancar S. Leukotriene B4 as a Potential Therapeutic Target for the Treatment of Metabolic Disorders. Front Immunol. 2015; 6: 515.
- Brandt SL, Wang S, Dejani NN, Klopfenstein N, Winfree S, Filgueiras L, et al. Excessive localized leukotriene B4 levels dictate poor skin host defense in diabetic mice. JCI Insight. 2018; 3: e120220.
- Roselló-Catafau J, Hotter G, Closa D, Ortiz MA, Pou-Torello JM, Gimeno M, et al. Liver lipoxygenase arachidonic acid metabolites in streptozotocin-induced diabetes in rats. Prostaglandins Leukot Essent Fatty Acids. 1994; 51: 411-413.
- Liu X, Wang K, Wang L, Kong L, Hou S, Wan Y, et al. Hepatocyte leukotriene B4 receptor 1 promotes NAFLD development in obesity. Hepatology. 2022.