
Research Article
J Drug Discov Develop and Deliv. 2015;2(1): 1011.
Development and Evaluation of Chloroquine Phosphate Microparticles using Solid Lipid as a Delivery Carrier
Ogbonna JDN¹*, Nzekwe IT², Kenechukwu FC¹, Nwobi CS¹, Amah JI¹ and Attama AA¹
¹Department of Pharmaceutics, University of Nigeria, Nsukka, Nigeria
²Department of Pharmaceutics and Pharmaceutical Technology, Nnamdi Azikiwe University, Awka, Nigeria
*Corresponding author: Ogbonna John Dike N, Department of Pharmaceutics, University of Nigeria, Nsukka, 410001, Nigeria
Received: February 17, 2015; Accepted: May 05, 2015; Published: May 07, 2015
Abstract
The aim of the study was to formulate and evaluate in vitro-in vivo Chloroquine (CQ)-loaded Solid Lipid Microparticles (SLMs). CQ-loaded SLMs were prepared by hot homogenization, lyophilized and characterized using particle size, pH stability, Loading Capacity (LC) and Encapsulation Efficiency (EE). In vitro release of CQ was performed in SIF and SGF and in vivo study done using Peter’s Four day in mice, there after kidney and liver of the mice were subjected to histological studies.
The formulations exhibited high entrapment efficiency and yield. Timedependent pH stability studies showed little variations with range from 3.93±0.21- 5, 46±0.23. The release profiles of CQ-loaded SLMs showed a gradual, steady release of the drug at various intervals in both SIF and SGF compared to the commercial CQ samples for 8 h. The in vivo study showed a high percentage reduction in parasitemia with minimal effect on vital organs. The SLMs exhibited sustained release with a pH-dependent release profile as the highest release was obtained in SIF than in SGF. The results showed that the percentage reduction in parasitemia of the optimized SLMs formulation (87.01%) had better activity than the commercial sample (84.12%).
The histological studies revealed that the SLMs formulations have no harmful effects on the organs of the mice. SLMs formulations might be an alternative for delivery of CQ to patients with parasitemia.
Keywords: Solid lipid microparticles; Chloroquine; Parasitemia; Haematological parameters; Histological studies
Abbreviations
C0 is SLMs unloaded with CQ; C1 is SLMs loaded with 3 % of CQ; C2 is SLMs loaded with 5 % of CQ; C3 is SLMs loaded with 7 % of CQ
Introduction
Resistance to antimalarial medicines is a recurring problem in recent years, thus parasitic resistance to artemisinins has been detected and if this resistance to artemisinins develops and spreads to other large geographical areas, the public health consequences could be dire. This treatment failure of the new antimalarials have prompted the quest to formulate CQ in novel alternative delivery systems as it is always the cheapest for the local populace, mostly affected by malaria. Solid Reverse Micellar Solutions-based (SRMS-based) SLMs is a new formulation field with advantages over other carrier systems with high potentials for sustained drug release and gastro-protection [1]. Some proposed mechanisms of action of lipid-based systems to enhance oral bioavailability of compounds includes; increased rate of dissolution into aqueous environment from oil droplets of high surface area, promotion of absorption via intrinsic lipid pathways and enhanced thermodynamic activity via supersaturation of the aqueous environment of the gastrointestinal tract [2,3]. SLMs attract increasing attention in alternative delivery systems as they combine advantages of traditional carriers; for example they can be produced on a large industrial scale, are toxicologically highly acceptable and also allow the control of drug release [4].
Parasitic diseases are of immense global significance as around 30 % of world’s population experience parasitic infections. Malaria, the most life threatening disease among the parasitic infections accounts for 1 to 2 million deaths round the globe every year with the estimate each year that more than 200 million people are infected with malaria worldwide [5]. Malaria, a common problem in areas of Asia, Africa and Central and South America is responsible for 1 in 5 childhood death in Africa and at least fifty per cent of Nigerian population experience one episode of malaria every year [6]. It is the cause of 1/5 of death before the age of 5 years and 1/3 of deaths for children in urban and rural areas of Nigeria respectively [7]. Malaria preferentially affects children younger than 5 years of age, pregnant women, and non-immune individuals [8] becoming more difficult to treat because of multidrug parasite resistance. In humans, malaria is caused by four distinct blood–borne Ampicomplexan parasite species: Plasmodium vivax, Plasmodium malariae, Plasmodium ovale and Plasmodium falciparum being responsible for almost all malaria related deaths as it causes the most severe malaria [9]. Plasmodium berghi transmitted by Anopheles mosquitoes are practical model organism in the Laboratory for the experimental study of human malaria as the symptoms are to a certain degree comparable to symptoms of cerebral malaria in patients infected with the human malaria parasite P. falciparum [10]. In addition, P. berghei is used in research programs for development and screening of anti-malarial drugs and for the development of an effective vaccine against malaria. The recent call for the elimination and eradication of the disease requires research from multiple fronts, including developing strategies for the efficient delivery of new medicines [11].
CQ is a 4-aminoquinoline compound for oral administration. It is indicated for suppressive treatment and acute attacks of malaria due to P. vivax, P. malariae, P. ovale, and susceptible strains of P. falciparum including treatment of extra intestinal amoebiasis as it is rapidly and almost completely absorbed from the gastrointestinal tract [12]. The drug is generally safe and toxicity occurs when very high doses are administered via parenteral route.
Previously, formulation and evaluation of halofantrine-loaded Solid Lipid Microparticles (SLMs) have been done by our research group [13]. The aim of the present work was to formulate CQ-loaded SLMs and assess the antimalaria activity of the formulations both in vitro and in vivo in P. berghei infected mice and compare their activity with commercial CQ sample tablets.
Materials and Methods
Materials
The materials used were pure CQ sample (Juhel Pharmaceuticals, Nigeria), commercial CQ sample (Evans Pharmaceuticals, Nigeria), Phospholipon® 90H (P90H) (Phospholipid GmbH, Köln, Germany), sorbic acid, sorbitol, polysorbate 80 (Merck, Darmstadt, Germany), distilled water (Lion Water, Nigeria), goat fat (obtained from a batch processed in our Laboratory). All other reagents and solvents were of analytical grade and were used without further purification.
Parasites: P. berghei NK-65, a strain free of contamination with Eperythrozoon coccoides and sensitive to CQ, was used for in vivo antimalarial study. This strain is known to induce high mortality in mice, providing a good model to estimate antimalarial efficacy in reducing parasitemia, and is sensitive to all currently used antimalarial drugs. It was obtained from Nigerian Institute of Medical Research (NIMR), Lagos, Nigeria.
Animals: Animal experiments were carried out according to the Principles of Laboratory Animal Care and legislation in force in Nigeria. Eperythrozoon-free Swiss albino mice (CD1) weighing 20 to 25 g were obtained from Department of Pharmacology and Toxicology, University of Nigeria.
Methods
Extraction of goat fat: The lipid (goat fat) used in the formulation was first extracted from goat fat (Capra hircus) using wet rendering method [14]. Briefly, adipose tissue of goat was grated and subjected to moist heat by boiling with about half its weight of water in a water bath for 45 min. The molten fat was separated from the aqueous phase after filtering with a muslin cloth and stored in a refrigerator until used.
Preparation of lipid matrix: The lipid matrix was prepared using fusion technique according to Friedrich et al. Attama et al. [15,16]. Briefly, a 70 g quantity of the prepared goat fat was weighed (Adventurer, Ohaus, China), melted in a beaker placed in a water bath at a temperature of 60°C;. Thereafter 30g of P90H was added to the melted goat fat and stirred using a magnetic stirrer and hot plate (Jenway 400, EU), until an even mix was obtained. The molten lipid matrix was then placed in a cold water bath for 30 min at room temperature until solidification to obtain the Solidified Reverse Micellar Solution (SRMS).
Preparation of SLMs: The Solid Lipid Microparticles were prepared to contain: lipid matrix (17 % w/w), CQ (0, 3, 5, 7 %w/w), polysorbate 80 (1.5 %), sorbic acid (0.05 %), sorbitol (4 %w/w) and water (to 100 %w/w). The lipid matrix consisted of goat fat and P90H. For each batch, the lipid matrix was placed in a stainless steel bowl and heated at 60°C; until it had melted completely. The remaining excipients were weighed out appropriately and mixed with the corresponding quantity of water at 70 °C;. The excipients mixture with water at 70oC was poured into the lipid matrix to form the lipid matrix-mixture and homogenized at 5000 rpm for 10 min with an Ultra-Turrax homogenizer (IKA® T25, Basic Digital, Germany). The hot emulsion was then poured into a bottle and allowed to recrystallize at room temperature for 24 h and the resultant unloaded SLMs batch C1 obtained. The same procedure was adopted for the CQ-loaded SLMs with varying quantity of the drug (concentrations of 3 %, 5 %, and 7 % for batches C2, C3, and C4 respectively) as shown in (Table 1), except that the drug was poured into the melted matrix and mixed, thereafter the excipients mixture was poured into the lipid matrix-drug mixture. The SLMs obtained after cooling at room temperature were lyophilized to obtain water-free SLMs using a freeze-dryer (Amsco/ Finn-Aqua Lyovac GTZ, Germany) [13,17]. Briefly, lyophilisates of the SLMs are obtained by freezing the formulations at a pressure of 2.7 Pa and temperature of -30 °C; followed by sublimation and drying at 15-25 °C. All these operations took 6-12 h.
    Code
    CQ (%)
    Lipid matrix (%w/v)
    Polysorbate 80 (%)
    Sorbitol (%)
    Sorbicacid (%)
    Distilled water q.s (%)


    C1
    0
    17
    1.5
    4
    0.05
    100


    C2
    3
    17
    1.5
    4
    0.05
    100


    C3
    5
    17
    1.5
    4
    0.05
    100


    C4
    7
    17
    1.5
    4
    0.05
    100


    *Key: C1,    C2, C3 and C4 are 0 %, 3 %, 5 % and 7 %    CQ-loaded SLMs respectively
Table 1: Formula and composition of chloroquine phosphate SLMs.
Characterization of the formulated SLMs
Particle size analysis: Particle size analysis was carried out on the SLMs after formulation according to Ogbonna et al. [13]. A 5 mg of the SLMs from each batch was dispersed in distilled water and smeared on a microscope slide using a glass rod. The mixture was covered with a cover slip and viewed using a polarized photomicroscope (Hund®, Weltzlar, Germany), attached with a Motic image analyser which is an Automated imaging system at a magnification of ×400. Triplicate readings were taken.
Determination of the loading capacity of the formulated SLMs: Loading capacity (LC) expresses the ratio between the entrapped Active Pharmaceutical Ingredient (API) and total weight of the lipids [18]. The loading capacity of the formulated SLMs was determined using the formula below:
Where,W1 = weight of lipid added in the formulation and Wa= amount of API entrapped by the lipid
Determination of the percentage yield of the SLMs: After lyophilization, the water-free SLMs from all the batches were weighed. The yield of SLMs (%w/w) was calculated according to the following formula [14].
Where, W1= weight of SLMs formulated (g), W2 = weight of drug added (g), W3 = weighed of the lipid matrix + polysorbate 80 + sorbitol + sorbic acid (g).
Determination of encapsulation efficiency of the SLMs: A 100 mg of the SLMs from a batch was placed in a beaker containing 100 ml of distilled water. The dispersion was shaken properly and then filtered. The filtrate was then analysed spectrophotometrically at a wavelength of 254 nm using a UV-VIS spectrophotometer (Unico 2102 PC UV/Vis Spectrophotometer, USA). The encapsulation efficiency EE % was calculated using the formula [19].
Time dependent pH stability studies of the formulations: The formulations were subjected to pH analysis using a pH meter (Jenway 3510, EU) on days 0, 7, 60 and 90 to check the effect of storage with time on the pH stability of SLMs. The particles were stored as lyophilized powder and resuspended at the programme time point. Briefly, pH of 20 ml dispersion of SLMs from each batch was determined and triplicates readings taken.
Preparation of calibration plot: The wavelengths of maximum absorption were determined at 254 nm by scanning some samples in the various media; distilled water, simulated intestinal fluid (SIF, pH = 6.8) and simulated gastric fluid (SGF, pH = 1.2). A calibration curve was obtained at ten concentration levels of a standard CQ solution (1.00- 10.00 mg/ml). The calibration plots of CQ obtained in these media were used to calculate the corresponding concentrations of drug released in each medium. Linearity was analyzed using the least square regression method in triplicate at each concentration level.
In vitro release studies: The dissolution medium consisted of 200 ml of freshly prepared simulated gastric fluid (SGF, pH = 1.2) 37± 1°C;. The dialysis membrane (MWCO 6000-8000 Spectrum Labs, The Netherland) was pre-treated by immersing it in the dissolution medium for 24 h, prior to the commencement of each release procedure. In each case about 500 mg of the formulation containing 3 %, 5 % of CQ and the commercial CQ sample was enclosed in a dialysis membrane containing 3 ml of the dissolution medium securely tied with a thermo-resistant thread and immersed in the dissolution medium containing 100 ml SGF, under agitation by a stirrer at 100 rpm. At predetermined time intervals, 5 ml aliquots of the dissolution medium (SGF, pH = 1.2) was withdrawn and immediately replaced with 5 ml of fresh SGF and analyzed spectrophotometrically (Unico 2102 PC UV/Vis Spectrophotometer, USA) at 254 nm. The amount of drug released at each time interval was determined using the standard Beer’s plot for chloroquine phosphate at 254 nm. The same procedure was repeated using formulations containing 3 %, 5 % of CQ and the commercial CQ sample with simulated intestinal fluid (SIF, pH =6.8) as the dissolution medium. Triplicate readings were done in each case.
In vitro release kinetics: The dissolution data for the SLMs were analyzed to determine the in vitro release kinetics using Higuchi square root equation kinetic models.
According to Higuchi relationship, the amount of drug released per unit surface area is proportional to the square root of time. This equation explains diffusion release rate as indicated below:
Qt = KHt¹ (4)
Where KH is Higuchi rate constant, Qt is the quantity of drug released at specific time interval [20].
Evaluation of anti-malaria activity
Preparation of the animals: The animal experimental protocols were in accordance with the guidelines for conducting animal experiments stipulated by our Institution’s Animal Ethics Committee and in compliance with the Federation of European Laboratory Animal Science Association and the European Community Council Directive of November 24, 1986 (86/609/EEC) [21]. Twelve healthy, non-pregnant adult Swiss albino mice were selected and divided into three groups of four mice per group. The mice were allowed water and food ad libitum and allowed to acclimatize for seven days.
In vivo antimalarial studies: The parasite, a CQ-sensitive strain of Plasmodium berghei NK 65 which was maintained in mice was obtained from the Nigerian Institute of Medical Research (NIMR), Yaba, Lagos. The 4-day test was performed as described by Peters et al. [22]. Each mouse was inoculated intraperitoneally (i.p) with 0.2 mL of infected blood containing about 10,000,000 Plasmodium berghei parasitized erythrocytes and left for four days. On day 4 after parasitic inoculation, parasitemia levels were measured and average parasitemia calculated for each group. Oral administration of the drug was carried out as follows: Group A received SLMs containing CQ (C1); group B received commercial CQ sample and group C received no treatment at all, group D was not inoculated with the parasite and the treatment doses were based on body weights. The baseline Packed Cell Volume (PCV), Haemoglobin content (Hb), White Blood Cell Content (WBC) and Red Blood Cell Content (RBC) were taken. These parameters were also determined before treatment, after parasite inoculation and post treatment. The parasite count was done 4 days after infection and also post treatment from thin blood smears of the tail blood of mice, fixed with methanol and stained with Giemsa’s stain. The efficacy of the developed formulations was determined by monitoring the mean percentage parasitemia suppression activity against time.
Percentage parasitemia was calculated based on the parasite count pre-treatment and post-treatment using the formula;
Histological studies: The mice were sacrificed seven days post treatment and the liver and kidney of a mouse from each group subjected to histological studies. Tissue sections of the liver and kidney of mouse from each group (A, B and C) were fixed in 10 % normal saline and dehydrated in ascending grades of ethanol. Thereafter, the tissues were cleared in chloroform overnight, infiltrated and embedded in molten paraffin wax. The blocks were later trimmed and sectioned at 5-6 μm. The sections were deparaffinized in xylene, rinsed with water and subsequently stained with Haematoxylin and Eosin (H and E) and fixed for viewing which was done with a moticam (D-MOTICAM 580, U.S) fitted to the polarized photomicroscope attached with a Motic image analyser which is an Automated imaging system at a magnification of ×400
Statistical analysis
Statistical analysis was done using SPSS version 14.0 (SPSS Inc. Chicago, IL, United States). All values were expressed as mean ± SD. Data were analyzed by one-way ANOVA. Differences between means were assessed by a two-tailed Student’s T-test. P < 0.05 was considered statistically significant.
Percentage recovery of SLMs
The results of percentage recovery of the SLMs presented in Table 2 showed that percentage recovery values of SLMs (batches C1, C2, C3 and C4) ranged from 73.65 to 78.28 %.
    Code
    MPS (µm) *,†
    Yield (%)*,†
    LC (%)*,†
    EE (%)*,†
    pH stability    studies *,†


    1 week
    2 month
    3 months


    C1
    16.52±0.27
    77.41±0.17


    5.40±0.23
    4.89±0.15
    4.72±0.23


    C2
    17.69±1.33
    78.28±1.25
    6.87±0.51
    61.81±2.71
    4.54±0.21
    4.60±0.22
    4.72±0.28


    C3
    19.25±0.56
    77.54±1.65
    18.30±0.75
    63.72±0.38
    4.20±0.20
    4.38±0.19
    4.51±0.24


    C4
    22.75±1.20
    73.65±2.01
    23.42±1.05
    48.66±1.18
    3.93±0.21
    4.00±0.27
    4.22±0.20


    *Key: MPS is Mean particle size, LC is    Loading capacity, EE is Encapsulation efficiency
      *Mean_SD. † n= 3
Table 2: Particle size, yield, loading capacity, Encapsulation efficiency and pH stability studies.
Mean particle diameter and morphology of SLMs
The photomicrographs of SLMs Figure 1 (A-D) showed that the shapes of CQ-loaded SLMs formulated were fairly spherical. The values of mean particle diameter presented in Table 2, showed that unloaded SLMs (C1) exhibited the lowest mean particle diameter, while CQ-loaded SLMs containing 5 and 7 % CQ i.e., batches C3 and C4 had the largest mean particle diameter of 19.25±0.56 μm and 22.75±1.20 μm respectively.

    Figure 1:  (A-D): Photomicrographs A to D showing SLMs of unloaded, 3 %, 5
% and 7 % CQ-loaded SLMs respectively.
Time-dependent pH stability studies of the formulations
The pH of the SLMs presented in Table 2, showed that the unloaded SLMs containing no drug (C1) exhibited a significant reduction in pH from approximately 5.40±0.23 to 4.72±0.20 at 3 months (p < 0.05). However, the pH of the SLMs formulated with SRMS (CQ-loaded SLMs) showed a slight variation in pH with time thereby exhibiting insignificant reduction in pH at 3 months (p > 0.05).
Encapsulation efficiency (EE %) and loading capacity (LC)
Table 2 also showed the EE % and the LC of various batches of formulated CQ-loaded SLMs. EE % ranged from 48.66 % for batch C4 SLMs to 63.72 % for batch C3 SLMs. However, LC increased with increase in drug loading as shown in Table 2. Batch C4, with 7 % CQ, exhibited the highest loading capacity of 23.42 g of CQ/100 g lipid.
Preparation of calibration plot
According to Beer-Lambert’s law,
A = KlC (6)
Where A is the absorbance, K is Beer-Lambert’s constant, l is the path length and C is the concentration of the drug. Calibration plots indicated linear relationships between absorbance and concentration of CQ with all the solvents used.
In vitro release of chloroquine
The results of in vitro release presented in Figure 2 showed that CQ-loaded SLMs had sustained release properties in SIF (pH =6.8). At 1 h, SLMs of C2, C3 and commercial CQ sample showed 10, 5 and 20 % release respectively. At 8 h, SLMs of C2, C3 and commercial CQ sample showed 34, 30 and 65 % release respectively. The SLMs batches could not reach maximum release at 8 h; they only exhibited about 30-34 % of drug release while the commercial CQ sample released most of the CQ (65 %) in 8 h.
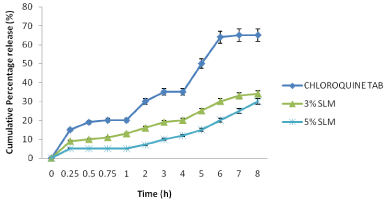
    Figure 2:  Release profile of the SLMs formulated and the commercial sample
in SIF (pH = 6.8).
In SGF the CQ-loaded SLMs also had good sustained release properties (Figure 3). At 1 h, SLMs of C2, C3 and commercial CQ sample exhibited 9, 5 and 18 % release respectively. At 8 h, SLMs of C2, C3 and commercial CQ sample showed 29, 22 and 58 % release respectively. The SLMs batches could not reach maximum release at 8 h; they exhibited about 22-29 % of drug release while the commercial CQ sample released most of the CQ (58 %) in 8h.
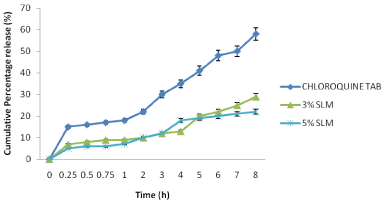
    Figure 3:  Release profile of the SLMs formulation and commercial sample
in SGF (pH = 1.2).
In vitro release kinetics
The drug release kinetics was studied using Higuchi kinetic model as shown in Table 3. Higuchi plot of amount of drug release against square root of time for all the batches of CQ-loaded SLMs were linear (r² ≈ 0.9). However, plot of log Q against log t according to Higuchi in the SLMs (C1 and C2) gave n value of > 0.5 in SIF (pH = 6.8) and SGF (pH = 1.2) media.
    Batches
    SIF
    SGF


    KH
    r2
    n
    KH
    r2
    n


    C1
    1.904
    0.980
    1.510
    1.685
    1.969
    1.473


    C2
    2.338
    0.899
    1.406
    1.840
    0.983
    1.314


    *key: r2 =regression coefficient, KH= Higuchi rate constant, n = constant
Table 3: Higuchi Kinetic model for the release studies.
In vivo antimalarial studies
In vivo studies: The Figures 4, 5, 6 and 7 showed variations in percentage packed cell volume (PCV), percentage haemoglobin (Hb), red blood cell (RBC) and white blood cell (WBC) respectively of the mice in groups A, B and C while Figure 8 (percentage parasitemia reduction) showed that group A mice which received SLMs containing CQ had 87.10 % parasite clearance; group B which received commercial formulation of CQ had 84.12 % parasite clearance and group C which received no treatment had 14.89 % parasite clearance.
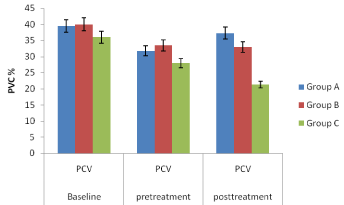
    Figure 4:  Percentage packed cell volume (PCV) of the mice in groups A, B
and C.
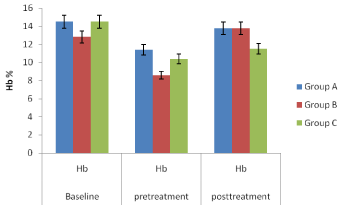
Figure 5: Percentage haemoglobin (Hb) of the mice in groups A, B and C.
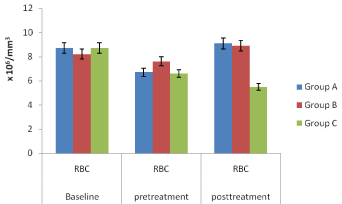
Figure 6: Red blood cell (RBC) of the mice in groups A, B and C.
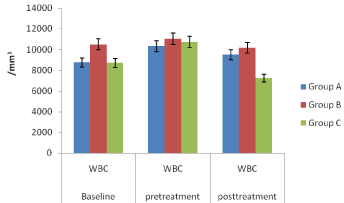
Figure 7: White blood cell (WBC) of the mice in groups A, B and C.
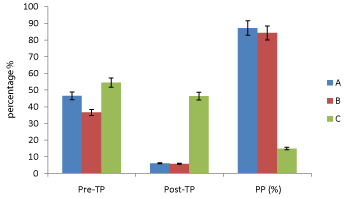
    Figure 8:  Percentage parasitemia reduction where Pre-TP is pre-treatment
parasitemia, Post-TP is posttreatment parasitemia, PP (%) is percentage
parasitemia reduction (%).
Histological studies: The photomicrographs from the histological studies of the liver are shown in Figures 9&10 while that of the kidney are shown in Figures 11&12. The pictograms of red blood cells of infected and treated mice in groups A, B and C are shown in Figures 13&15 respectively.
Discussion
Chloroquine has been used for decades as the primary and most successful drug against malaria. Concomitant with the emergence of chloroquine-resistant Plasmodium strains, there is need to formulate CQ as novel SLMs and evaluate their activity. In this study, an SLMs delivery system of CQ was developed and evaluated both in vitro and in vivo for enhanced oral delivery of CQ.
Percentage recovery of SLMs
The results of percentage recovery of the SLMs presented in Table 2 showed that all the CQ-loaded SLMs exhibited overall higher percentage recovery values than the unloaded SLMs (batches C1) except batch C4 which had yield of 73.65 %. High values of the percentage recovery of the SLMs indicated that the formulation technique adopted was reliable [1].
Mean particle diameter and morphology of SLMs
There was an increase in particle size as the quantity of drug loaded in the SLMs increase. This increase in the particle size was proportional to the amount of drug entrapped in the formulation [23]. The particle sizes also showed variations which may have been dependent on the orientation of the particles on observation. Even though it is expected that only spherical particles would be present in all formulations (not shown), it should also be realized that the polymorphic nature of the lipid matrices used could determine the shape of the particles as some of the formulations have irregular shape and fluffy feel.
Time-dependent pH stability studies of the formulations
The pH of all the batches of SLMs was in acidic region throughout the study. Change in pH of a liquid drug formulation could be a function of degradation of the drug or the excipients. A prior stable drug may be affected by degradation of excipients with storage through generation of an unfavorable pH (increase or decrease) or reactive species for the drug [16]. However, there was slight decline in the pH values in the drug unloaded SLMs formulation may be due to release of free fatty acids from the lipid matrix [24].
It would, therefore, be reasonable to infer that the rise in pH of the CQ-loaded SLMs is due either to a rise in the particle surface pH or the likely interaction of the ions present in the medium with the components of the formulation [25]. The little increase in pH of the CQ-loaded SLMs indicated that the preparation would need a buffer to keep the pH more stable [13].
Encapsulation efficiency (EE %) and loading capacity (LC)
The ability of the SLMs to accommodate active molecules is an important property and this can be expressed by the entrapment efficiency (EE %) and loading capacity. The EE% and LC were affected by the total amount of drug in the formulation. Lipid matrices containing 3 % of CQ exhibited the highest encapsulation efficiency while the lowest loading capacity is exhibited by C4. Both EE % and LC are dependent on several parameters such as the lipophilic properties of the CQ (API), the screening of the most appropriate lipid composition/ratio and surfactant combination, as well as the production procedure used; this could be as a result of saturation of the lipid matrix [16,26]. Loading capacity increased with increased drug loading. Owing to the higher EE % and LC of C2 and C3 batches, their formulations were optimized for in vitro and C1 for in vivo studies.
Preparation of calibration plot
The regression coefficients (r²) in distilled water, SIF and SGF were 0.983, 0.954 and 0.935 respectively thereby indicating linear relationships.
In vitro release of chloroquine
Resistance to antimalaria are occurring as a consequence of several factors, including poor treatment practices, inadequate patient adherence to prescribed antimalarial regimens and substandard forms of the drug [27-29]. The results of in vitro release are presented in Figure 2&3. The release profiles of CQ-loaded SLMs based on SRMs showed a gradual, steady release of the drug at various intervals in both SIF and SGF compared to the commercial CQ samples which had greater release per time interval in both media. Therefore commercial CQ sample showed the fastest drug release throughout the 8 h in both SIF and SGF; this may be due to presence of non-encapsulated drug while the CQ-loaded SLMs (C2 and C3) showed more sustained release of the drug significantly different from commercial CQ sample (p < 0.05). This may be due to presence of encapsulated drug in the inner core of the SLMs [1]. The batches of CQ-loaded SLMs based on SRMS exhibited sustained release properties for once daily administration. Therefore the SLMs formulations could better be used for sustain release delivery of CQ as once daily dosing can be administered as about 35 % of the SLMs in both media were release after 8 h.
In vitro release kinetics
According to Higuchi relationship, the amount of drug released per unit surface area is proportional to the square root of time. The drug release kinetics showed that Higuchi plot of amount of drug release against square root of time for all the batches of CQ-loaded SLMs were linear (r² ≈ 0.9). The batches C1 and C2 SLMs have n values > 0.5 indicating that diffusion was not the only predominant mechanism of drug release in these batches [30] as shown in Table 3. Therefore, the release mechanisms studied showed that CQ-loaded SLMs exhibited mixed mechanisms of release; release mechanism involving both diffusion and erosion controlled release.
In vivo antimalarial studies
In vivo studies: The Figures 4-7, pretreatment and post treatment hematological parameters showed the variations in PCV, Hb, RBC and WBC were significant except for WBC in group B. Figure 8 showed that group A mice which received SLMs containing CQ had the highest parasite clearance followed by the commercial CQ sample (group B). Group C which received no treatment had negligible parasite clearance. The CQ-loaded SLMs and commercial CQ sample showed more parasite clearance significantly different from Group C which received no treatment (p < 0.05) while the CQ-loaded SLMs and commercial CQ sample showed parasite clearance not significantly different (p > 0.05)
Histological studies: Figure 9 of groups A and B showed varying degrees of periportal hepatitis (mainly mononuclear cell infiltration of the portal area-P). Note the infiltrating cells (arrow). Figure 10 of groups D showed varying degrees of periportal mononuclear infitration of cells-periportal hepatitis (arrow) while the group H shows normal portal area and hepatocytes. Figure 11 of groups A and B showed tubular dilatation and mild areas of tubular degenerationsblack arrow. Figure 12 of group D showing apparently normal Glomerulus (GM) and renal tubules (white arrow) but mild tubular degeneration in group C (black arrow).
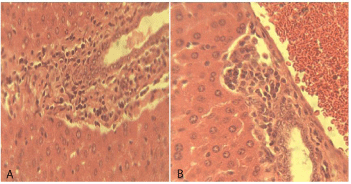
    Figure 9:  Photomicrograph of liver section of mice treated with SLMs of CQ
and commercial sample of CQ, groups A and B respectively. H and E x 400.
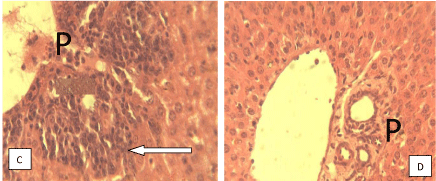
    Figure 10:  Photomicrograph of liver section of mice with no treatment and no
parasite innoculation, groups C and D respectively. H and E x 400.
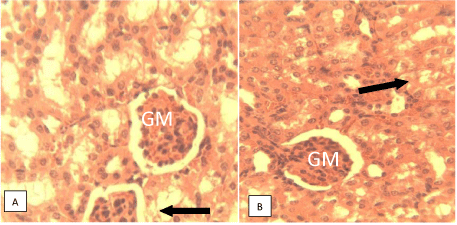
    Figure 11:  Photomicrograph of kidney section of mice treated with SLMs of
CQ and commercial sample of CQ, groups A and B respectively. H and E x
400.
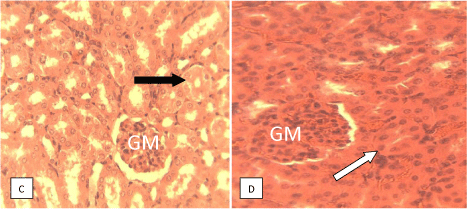
    Figure 12:  Photomicrograph of kidney section of mice with no treatment and
no parasite innoculation, groups C and D respectively. H and E x 400.
The observation from the histological studies conducted on the liver of the mice from various groups, showed varying degrees of hepatitis on the liver and varying degree of tubular dilatation of the mice in groups A, B and C while group D showed normal portal area and hepatocytes. The studies on the kidneys of various animals from various groups revealed cases of mild tubular dilatation and very mild tubular degeneration.
The red blood cells of mice in groups A, B (Figure 13-15) showed that blood cells that have been infected with the parasites (black arrow), but the number infected decreased in number owing to treatment with SLMs formulation while the red blood cells on parasite infected but untreated mice (Figure 15) showed more black arrows which demonstrated that the number of infected cells increased in number.

    Figure 13:  Red blood cells of mice treated with SLMs containing CQ, Group
A.

Figure 14: Red blood cells of mice treated with commercial CQ, Group B.

    Figure 15:  Red blood cells of mice infected with parasite without treatment,
group C.
Conclusion
SLMs formulations of CQ might be an alternative for delivery of CQ to patients with parasitemia as the dose orally administered once daily did not reached 50 % of the in vitro drug release both in SIF and SGF after 8 h. The SLMs formulation had high parasitemia clearance for the in vivo study using mice coupled with absence of harmful effects on vital organs of the mice there by establishing guaranteed safety of the SLMs formulations.
Declaration of Interest
This research work was funded by the International Foundation for Science (IFS), Sweden (IFS No. F/4467-2) and Organization for the Prohibition of Chemical Weapons (OPCW), The Hague. Dr. A. A. Attama is highly grateful to the Foundation and the Organization.
Acknowledgements
We thank Phospholipid GmbH, Köln, Germany for providing sample of Phospholipon® 90H.
References
- Chime SA, Attama AA, Agubata CO, Ogbonna JD, Onunkwo GC. Micromeritic and antinociceptive properties of lyophilized indomethacin loaded SLMs based on solidified reverse micellar solutions. Journal of Pharmacy Research. 2012; 5: 3410-3416.
- Prabhu S, Ortega M, Chan Ma. Novel lipid based formulations enhancing the in vitro dissolution and permeability characteristics of a poorly watersoluble model drug, piroxicam. Int J Pharm. 2005; 301: 209-216.
- Vikas AS, Vipin K, Mahesh K, Manoj G, Pratim KC. Dissolution Enhancement of Drugs. Part I: Technologies and Effect of Carriers. Int J Health Res. 2009; 2: 107-124.
- Jaspart S, Piel G, Delatte L, Evrad B. Solid lipid microparticles: Formulation, preparation, characterization, drug release and applications. Expert Opin Drug Deliv. 2005; 2: 75-87.
- Greenwood B, Mutabingwa T. Malaria in 2002. Nature 2002; 415: 670–672.
- Saganuwan AS, Onyeyili PA, Ameh EG, Etuk EU. In vivo antiplasmodial activity by aqueous extract of Abrus precatorius in mice. Rev Latinoamer Quím. 2011; 39: 32-44.
- Akubue PI. Textbook of Pharmacology. Onitsha, Nigeria. 1st ed. Africana First Publishers Limited 2006.
- Tracy JW and Webster LT. Drugs used in the chemotherapy of protozoal infections. Goodman & Gilman’s; the Pharmacological Basis of Therapeutics- 10th edition. Hardman JG, Limbird LL, editors. In: McGraw-Hill. New York, USA; 2001; 1069-1095.
- Medha J, Sulabha P, Shobhona S, Vandana P. Design and in vivo pharmacodynamic evaluation of nanostructured lipid carriers for parenteral delivery of artemether: Nanoject. Int J Pharm. 2008; 364: 119–126.
- Hall N, Karras M, Raine JD, Carlton JM, Kooij TWA, Berriman M, et al. A comprehensive survey of the Plasmodium life cycle by genomic, transcriptomic, and proteomic analyses. Science. 2005; 307: 82-86.
- Wells TN, Alonso PL, Gutteridge WE. New medicines to improve control and contribute to the eradication of malaria. Nat Rev Drug Discov. 2009; 8: 879-891.
- Patel AK, Prajapati BG, Moria RS, Patel CN. In vitro evaluation of marketed antimalarial chloroquine phosphate tablets. J Vect Borne Dis. 2005; 42: 147–150.
- Ogbonna JDN, Kenechukwu FC, Nwobi CS, Chibueze OS, Attama AA. Formulation, in vitro and in vivo evaluation of halofantrine-loaded solid lipid microparticles. Pharm Tech Dev. 2014; 18: 1-8.
- Attama AA, Nkemnele MO. In vitro evaluation of drug release from selfemulsifying drug delivery systems using a biodegradable homolipid from Capra hircus. Int J Pharm. 2005; 304: 4-10.
- Friedrich I, Reichl S, Muller-Goymann CC. Drug release and permeation studies of nanosuspensions based on solidified reverse micellar solutions (SRMS). Int J Pharm. 2005; 305: 167- 175.
- Attama AA, Okafor CE, Builders PF, Okorie O. Formulation and in vitro evaluation of a PEGylated microscopic lipospheres delivery system for ceftriaxone sodium. Drug Deliv. 2009; 16: 448- 457.
- Jaspart S, Bertholet P, Piel G, Dogne JM, Delattre L, Evrad B. 2007. Solid lipid microparticles as sustained release system for pulmonary drug delivery. Eur J Pharm Biopharm. 2007; 65: 47–56.
- Doktorovova S, Souto EB. Nanostructured lipid carrier-based hydrogel formulations for drug delivery: A comprehensive review. Expert Opin Drug Deliv. 2009; 6: 165–176.
- Morkhade DM, Joshi SB. Evaluation of gum dammar as a novel microencapsulating material for ibuprofen and diltiazem hydrochloride. Indian J Pharm Sci. 2007; 67: 263–268.
- Singh J, Gupta S, Kaur H. Prediction of in vitro drug release mechanisms from extended release matrix tablet using SSR/SR2 techniques. Trends App Sci Res. 2011; 6: 400–409.
- European Community Council Directive on the ethics of experiments involving laboratory animals (86/609/EEC), 24 November 1986.
- Peters W, Ze-Lin L, Robinson BL, Warhurst DC. The chemotherapy of rodent malaria, XL. The action of artemisinin and related sesquiterpenes. Ann Trop Med Parasitol. 1986; 80: 483-489.
- Chime SA, Onyishi IV, Obitte NC, Onunkwo GC, Odo GI. Sustained release artemether-loaded solid lipid microparticles, based on solidified reverse micellar solution (SRMS). Innovare J Sci. 2013; 1: 1-7.
- Chime SA, Attama AA, Onunkwo GC. Sustained release indomethacin-loaded solid lipid microparticles based on solidified reverse micellar solution (SRMS): In vitro and in vivo evaluation. J Drug Del Sci Tech. 2012; 22: 485-492.
- Gao P, Guyton ME, Huang T, Bauer JM, Stefanski KJ, Lu Q. Enhanced oral bioavailability of a poorly water soluble drug PNU-91325 by supersaturable formulations. Drug Dev Ind Pharm. 2004; 30: 221–229.
- Uronnachi EM, Ogbonna JDN, Kenechukwu FC, Attama AA, Chime SA. Properties of zidovudine loaded solidified reverse micellar microparticles prepared by melt dispersion. Journal of Pharmacy Research. 2012; 5: 2870-2874.
- Thiam S, Thior M, Faye B, Ndiop M, Diouf ML, Diouf MB, et al. Major reduction in anti-malarial drug consumption in Senegal after nation-wide introduction of malaria rapid diagnostic tests. PLoS One. 2011; e18419.
- Wilson A. A systematic review and meta-analysis of the efficacy and safety of intermittent preventive treatment in children (IPTc). PloS One. 2011; e16976.
- Nnamani PO, Hansen S, Windbergs M, Lehr C-M. Development of artemether-loaded nanostructured lipid carrier (NLC) formulation for topical application. Int J Pharm. 2014; 477: 208–217.
- Ofoefule SI, Chukwu A. Sustained release dosage forms: design and evaluation of oral products. - In: Textbook of Pharmaceutical Technology and Industrial Pharmacy, Samakin (Nig.) Enterprises Lagos. 2002; 94-120.