Research Article
Austin J Earth Sci. 2014;1(1): 6.
Geophysical and Geotechnical Investigation of Pavement Structures and Bridge Foundations
Reda Amer1*, Ahmed Saad2, Tharwat Abd Elhafeez2, Hassan El Kady2 and Mohamed Madi3
1Department of Earth & Environmental Sciences, Tulane University, USA
2Department of Geology, Al Azhar University, Egypt
3Orascom Construction Industries, Egypt
*Corresponding author: :Reda Amer, Department of Earth & Environmental Sciences, Tulane University, 6823 St. Charles Avenue, New Orleans, LA 70118, USA
Received: April 27, 2014; Accepted: May 12, 2014; Published: May 14, 2014
Abstract
This paper presents the results of the integration of conventional investigation methods (visual condition survey, boreholes, asphalt coring, and Standard Penetration Test) with Ground Penetrating Radar (GPR) to generate detailed pavement condition information for a section of the Cairo-Alexandria desert highway and evaluation of the Janaklis bridge deck. Comparison and correlation of the different data types demonstrated that the effectiveness of the GPR as a supplementary tool to conventional pavement condition investigations in identifying anomalies in the buried pavement structure and bridge deck. GPR results indicated that the block cracking of the highway section is related to the presence of moisture and/or clay in the subgrade soils which induces stress in the hot mix asphalt (HMA) layer due to elasticity and volume change between wet and dry states. GPR image shows deterioration in the middle of the Janaklise bridge deck which could be due to changes in concrete material properties associated with the delamination process, or to moisture infiltration into the delaminated area from the water canal. Low strain Pile Integrity Testing (PIT) was performed using Pile Echo Tester (PET) and indicated that there are no detected defects of the Janaklis bridge piles. GPR and PET provide a time and cost-effective means of obtaining high resolution data required for the design and rehabilitation of airport runways, highways, and bridges.
Keywords: Geotechnical; Ground penetrating radar (GPR); Pavement structures; Bridge deck; Bridge foundations
Introduction
The most common flexible pavement distresses are cracking, roughness, weathering, raveling, rutting and bleeding. Pavement maintenance is required to improve the quality of the pavement surface, extend pavement life and enhance pavement performance in a costeffective and efficient way. If the distresses identified in a pavement are related to structural deficiencies, the pavement section is most likely not a candidate for preventive maintenance treatment, and should be scheduled for rehabilitation or reconstruction. Conventional methods of pavement failure investigation include visual observation of base course condition, extraction and examination of core samples from rutted sections and analyzing lab test results from the cores. These methods are expensive and required a lot of work and time to be performed. Geophysical and geotechnical methods have been lately used as nondestructive, time and cost-effective tools to provide information about the pavement structures [1-4]. Ground penetrating radar (GPR) has been used for pavement layer thickness evaluation, bridge deck condition assessment, measurement of depth of rebar, and dowel location [5-9]. The results of these studies show that GPR can be a useful tool for estimating total repair quantities and general areas of deterioration, but less capable of pinpointing specific repair locations. The accuracy of GPR results depend on the availability of supporting information, such as from underside inspections, cores, and other measurements. In other applications, GPR was used to detect and measure moisture accumulation in hot-mix asphalt layers [10]. GPR was also used to evaluate the effectiveness of geosynthetic as a moisture barrier or as a layer separator to prevent migration of fines between layers [11]. Several conventional methods (e.g. excavation, coring, and probing with a hammer and rod) have been used to determine bridge foundation depths and to detect the extent and location of serious flaws to prevent failures under service conditions. These methods are expensive, time consuming, destructive, and limited in their application to the unknown foundation problem. Pile Integrity Testing (PIT) provide the most reasonable, inexpensive, nondestructive, and fastest alternative available to assess the bridge foundations [12-15].
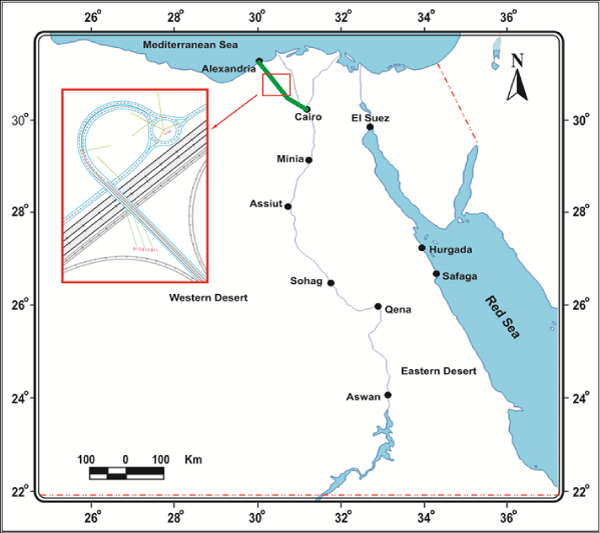
Herein, we integrated the conventional investigation methods (visual condition survey, boreholes, asphalt coring, and standard penetration test) with GPR to evaluate the pavement condition, subgrade moisture damage and assessment of bridge deck deterioration. Study sites are 33 km of the Cairo-Alexandria desert highway (from Kilometer 127 to 160) and Janaklise bridge which located at Kilometer 157 of the highway (Figure 1). We also used the Pile Integrity Test (PIT) to evaluate the bridge foundation. Results of this study used in developing nondestructive and cost-effective measures for pavement rehabilitation, bridge deck deterioration, and bridge pile integrity (Figure 1).
Figure 1: Location map of the study sites identified by the red rectangle on the general map of Egypt.
Data and Methods
Soil analysis
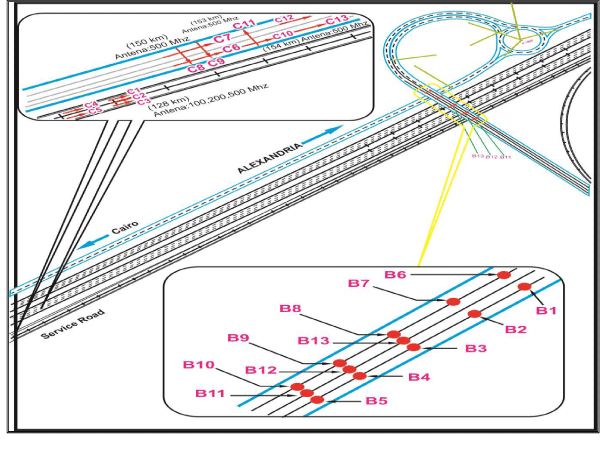
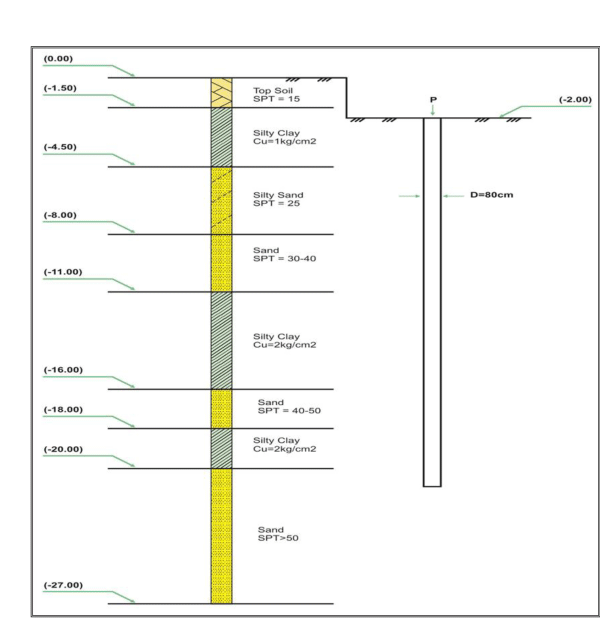
Visual condition survey of the Cairo-Alexandria desert highway from Kilometer 127 to 160 show that some sections are affected by the blocking cracks. Thirteen boreholes were drilled in the selected section to a depth ranging between 20 m to 27 m depth (Figure 2). Disturbed and undisturbed samples were retrieved from the pavement and subgrade layers for classifications and laboratory testing. Groundwater table was encountered at depth ranging between 2.1 m and 3.15 m from the ground surface. Groundwater samples were collected at for chemical analysis. Laboratory tests including sieve analysis and Atterberg limits were performed for selected samples from different boreholes. Soil was classified according to the Standard Practice for Classification of Soils and Soil-Aggregate Mixtures for Highway Construction Purposes [16]. Group Index was calculated for all samples based on the empirical formula from ASTM D 3282- 93: Group Index = (F – 35) [0.2 + 0.005 (LL – 40)] + [0.01 (F – 15) (PI – 10)] ….….(1) Where: F= percentage passing No 200 (75 µm) sieve; LL= liquid limit; and PI = plasticity index. The Standard Penetration Test (SPT) is conducted to assess subgrade soil’s bearing capacity. SPT was performed mechanically above the surface using a drop weight 63.5 kgs and an outer tube with a self-tripping mechanism that ensures a free fall height of exactly 760 mm at equal intervals of 1.5 m from the surface. The sum of the blows needed for sections penetrating from 15 cm through 45 cm has been defined (Table 1).
Figure 2: Location of boreholes and GPR sections.
    Sands

    Clays


    Number of blows per    foot
    Relative Density
    Number of blows per foot
    Consistency


    --
    --
    Below 2
    Very Soft


    0–4
    Very loose
    2–4
    Soft


    4 – 10
    Loose
    4–8
    Medium


    10 – 30
    Medium dense
    8 – 15
    Stiff


    30 – 50
    Dense
    15 – 30
    Very Stiff


    Over 50
    Very dense
    Over 30
    Hard
Table 1: Penetration resistance and soil properties according to standard penetration tests (SPT) (Peck, 1973).
Ground penetrating radar (GPR)
GPR is a high-resolution geophysical technique of imaging shallow soil and subsurface structures using electromagnetic waves. GPR system transmits short pulses of high-frequency radio waves range between l0 and 2000 MHz into the ground. Waves propagate into the ground at a velocity that is related to the electrical properties of subsurface materials. When this wave encounters the interface of two materials having different dielectric properties, a portion of the energy is reflected back to the surface, where it is detected by a receiver antenna and transmitted to a control unit for processing and display. GPR have the ability to scan large areas quickly, the ability to minimize coring and traffic control, the detection of pavement and bridge deck conditions, and the discovery of unknown subsurface conditions prior to construction. Thirteen GPR sections (C1 to C13) were carried out at the study area using RAMAC/GPR system from MALA-Geosciences (Figure 2) to evaluate the pavement and bridge deck conditions of the selected sites. The system was used with a 500 MHz antenna, and normalized dimension (0.10–0.28). Surveys involved laying out a series of survey lines, and dragging the antenna manually across the pavement surface. Marks were placed in the data at regular distance intervals, and GPS coordinates were recorded to keep track of the antenna’s location. Radar data display, filtering, and presentation were achieved via system software. Different filters were applied to remove the DC-Component from the recons, compensate signal suppression, noise removal, and image smoothing [17,18]. Filtered images were interpreted to determine the pavement layers condition, subgrade soil’s damage, and assessment of bridge deck deterioration (Figure 2).
Pile integrity testing
Pile Integrity Test (PIT) is simple, rapid, efficient and cost effective in examination of the bridge pile integrity. Low Strain Integrity Testing may be applied to any concreted pile for quality control and retrospective investigations. PIT is undertaken by striking the head of the pile with a light hand-held hammer and recording the response with a sensor or accelerometer placed in good contact with the pile head. The hammer blow induces a compressive stress-wave into the pile, which propagates axially along the pile shaft and reflects back from pile toe or a change in cross sectional area such as pile material quality, or presence of discontinuities. The reflected wave returns to the pile top at a time related to the speed of travel in the pile material. The location of reflection surface can be detected using the following equation:
L = C T/2……………. (2)
Where “L” is the length from pile head to reflected surface; “C” is velocity of stress wave; and T is the travel time of the wave for length L. The Janaklis bridge is located at Kilometer 157 of the Cairo-Alexandria desert highway and consists of 42 piles. The piles are made using the bored piles system with bentonite to support the drilling sides. The outer diameter of the piles is 0.8m with a minimum reinforcement 0.60% of the pile cross sectional area. The concrete cubic strength is specified as 400 kg/cm2. The piles were drilled to a depth of 16 m beneath the piles cap. Pile Echo Tester was used to test 18 piles (40%) out the total of 42 of Janaklis bridge piles (Figure 3). A total of 18 piles out of 42 which represents about 40% of Janaklis bridge piles were tested using a Pile Echo Tester (PET) system which is fully compliant to ASTM Sonic standards.
Figure 3: Locations of Pile Integrity Testing (PIT) carried out on the piles of Janaklis bridge.
Results and Discussion
Geotechnical evaluation
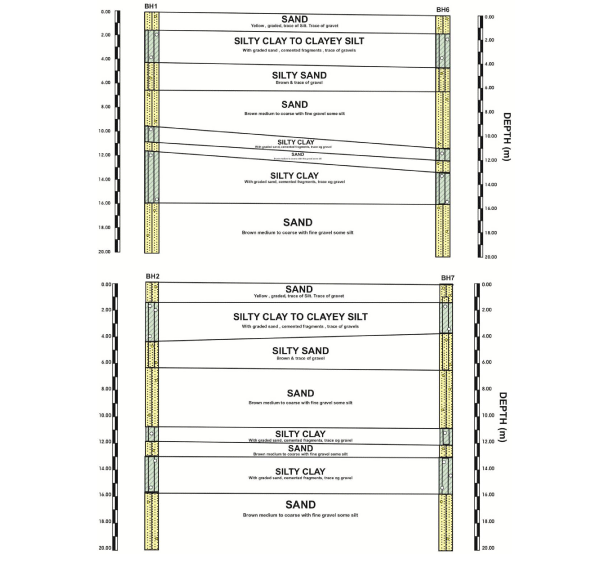
Chemical analysis of groundwater samples indicated that it is fresh water with total dissolved solids (TDS) range from 1718 to 1843 (ppm) (Table 2). The TDS, salinity, alkalinity, and sulphates concentrations increase eastward. The shallow aquifers generally recharged from the Nile River which explains increase hydrochemical elements with increasing distance from the Nile River. Soil density as typically measured by the N-Value of in-situ Standard Penetration Test (SPT) is an indication of the relative compactness and bearing capacity of a predominantly granular material such as sand, clayey sand, silty sand, and gravelly material. The water content of a granular material is mostly unimportant because the bearing strength is independent of water content, and the water content of a disturbed sample is not representative of the material. Coefficient of Uniformity (Cu) was calculated for the silty clay samples. Cu is the ratio (D60/ D10), where D60 and D10 are the particle diameters corresponding to 60 and 10% finer on the cumulative particle-size distribution curve. Results show that the subgrade soil composed of intercalations of sand, silty sand, and silty clay (Table 3, Figure 4). The results indicated that penetration index decreases as the dry density increases and slightly increases as moisture content increases. Samples locations from different depths were plotted on stratigraphic cross-sections to correlate the extension and sequence of soil layers between boreholes (Figure 5).
Figure 4: Results of Standard Penetration Test (SPT) and subgrade soil types.
Figure 5: Geotechnical cross sections between boreholes BH1-BH6, and BH2-BH7 show the subgrade layers of the Cairo-Alexandria desert highway section.
    No.
    Parameter (Unit    ppm)
    Molecular Formula
    B.H No.


    2
    8


    1
    Total Dissolved    Solids
    Ionized Salts
    1718
    1843


    2
    Alkalinity as    sodium carbonate
    Na HCO3
    265
    265


    3
    Salinity as sodium    chloride
    NaCl
    585
    702


    4
    Sulphate as sulpher    trioxide
    SO3
    694
    701


    PH value
    Log (1/H+)
    6.6
    6.8
Table 2: Hydrochemical results of groundwater samples.
    Layer
    Depth from the    Surface (m)
    Number of blows per    foot
    Coefficient of    Uniformity Kg/cm2
    Relative Density
    Lithology


    1
    0
    15
    -
    Medium dense
    Top Soil


    2
    1.5

    1

    Silty Clay


    3
    4.5
    25
    -
    Medium dense
    Silty Sand


    4
    8
    30 – 40
    -
    Dense
    Sand


    5
    11

    2

    Silty Clay


    6
    16
    40 – 50
    -
    Dense
    Sand


    7
    18

    2

    Silty Clay


    8
    20
    > 50

    Very Dense
    Sand
Table 3: Results of Standard Penetration Test (SPT) and Coefficient of Uniformity (Cu).
Results of sieve analysis and Atterberg limits of selected samples from boreholes 2, 3, 5, 8, and 10 are shown in Table (4). Sieve analysis demonstrates that over 35% of all samples passing a No 200 (75 μm). According to ASTM D 3282 – 93 soil classification standards, all samples are fall within plastic clay soil group A-7. The material of group A-7 includes mixtures of fine clayey soil and up to 64% of sand and gravel retained on a No 200 (75 µm) sieve. Materials of this group has moderate plasticity indexes in relation to the liquid limits and may be elastic as well as subject to high volume change between wet and dry states. Group index was calculated using ASTM D 3282–93 empirical formula and show that all borehole samples have a group index greater than 20 which indicates a poor sub grade material. Subgrade materials affect the pavement performance and life of service. Poor sub grade has low stiffness and low resistance to deformation and therefore, cannot support a high amount of loading which resulted to pavement failure. This type of sub grade should be removed and replaced with higher quality fill or addition of stabilization with a cementitious or asphaltic binder to increase sub grade stiffness and/or reduce swelling tendencies [19]. Another option is to use additional base layers to spread pavement loads over a large sub grade area (Table 2).
    Test Number
    1
    2
    3
    4
    5


    Borehole Number
    2
    3
    5
    8
    10


    Borehole Depth (m)
    14.5
    13.5
    18
    14.5
    12.5


    Water Content (WC    %)
    19.9
    23
    28
    21
    23


    Sieve analysis, %    Passing No. 10 (2.0 mm)
    100
    100
    100
    100
    100


    Sieve analysis, %    passing No. 40 (425 µm)
    100
    100
    100
    100
    100


    Sieve analysis, %    passing No. 200 (75 µm)
    41
    38
    43
    37
    40


    Liquid Limit (LL %)
    88.5
    93
    102
    90
    94


    Plastic Limit (PL    %)
    26.1
    33.3
    34.1
    34.1
    30.4


    Plasticity Index    (PI %)
    62.4
    59.7
    67.9
    55.9
    63.6


    Group Index
    93
    43
    117
    28
    68


    Classification
    A-7
    A-7
    A-7
    A-7
    A-7
Table 4: Pavement Subgrade soil classification according to (ASTM D 3282 – 93) standards.
GPR data analysis and interpretation
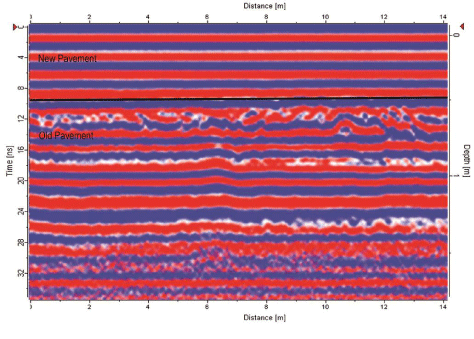
GPR sections were processed and analyzed to determine the thickness of pavement layers, detect changes in the pavement structure, identify subgrade defects, and assessment of bridge deck deterioration. When dealing with older highway where numerous sections have been received partial rehabilitation, it is extremely difficult to maintain reliable layer thickness information. The GPR rapidly identified the old pavement, and the new pavement profile C7. Figure 6, shows GPR image of the old roadway had been rehabilitated buried beneath 35 cm flexible base overlay and 15cm new thin hot mix asphalt (HMA) surfacing. The old pavement consisted of a stabilized subgrade, 30 cm flexible base, and 10 cm thin HMA surfacing [20].
Figure 6: GPR profile (C7) shows the new and old pavement layers.
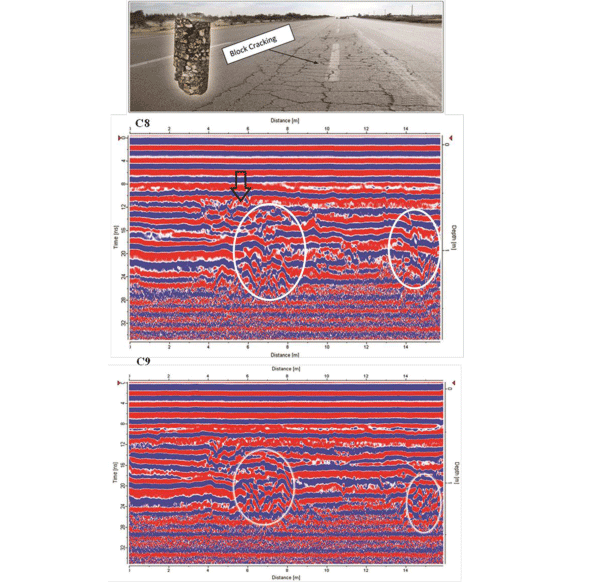
Visual survey of the Cairo-Alexandria desert highway indicated that some sections have block cracking at the center of the roadway (Figure 7). These cracks initiate at the top of the HMA and propagate downward allow water to penetrate into the underlying layers and accelerating the development of fatigue cracks. GPR profiles C8 and C9 were carried out at cracked areas. GPR images of these profiles show that the intensity of reflection increased at a depth of 60 cm to 120 cm (Figure 7). Strong reflection and disturbances at these locations in the pavement subgrade indicate the presence of moisture and/or clay and soils with high electrical conductivity. GPR results are correlated well with boring data which indicated that poor subgrade elastic soil which may be subject to high volume change between wet and dry states. The block cracking may be occurred due to volume change of the subgrade which induces stress in the HMA layer that exceeds the tensile strength of the asphalt mixture.
Figure 7: GPR profile C8 and C9 carried out at a pavement section with blocking cracks shows higher reflection a depth of 60 cm to 120 cm due to presence of moisture and/or clay and soils with high electrical conductivity.
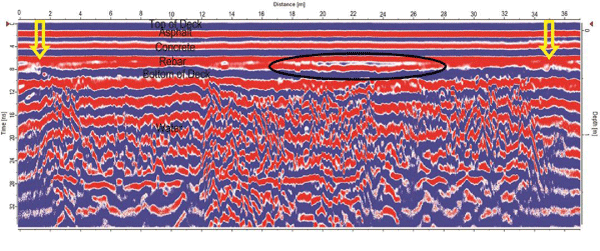
The Janaklis Bridge is 33m long with a 20 m wide roadway and is located at Kilometer 71 of the Cairo-Alexandria desert highway over water canal. GPR data analysis of the bridge deck shows the beginning and end of the deck and deck layer interfaces that appears as dielectric discontinuities. The concrete deck is 40 cm thick with nominal 10 cm thick asphalt overly. There increase in the GPR reflections amplitudes from the top rebar and the bottom of the deck indicative of deterioration located at the middle of the bridge between 19 m and 26m on the GPR profile and identified by the black ellipsoid on Figure 8. The increased reflection amplitude could be due to changes in concrete material properties associated with the delamination process, or to moisture infiltration into the delaminated area. The presence of free water beneath the slab could have a major impact on the presence of additional moisture.
Figure 8: GPR image of the Janaklis bridge deck profile C10 shows the significant layer interfaces and the underlain free water canal. The yellow arrows identify the beginning and ending of the bridge deck.
Bridge pile integrity
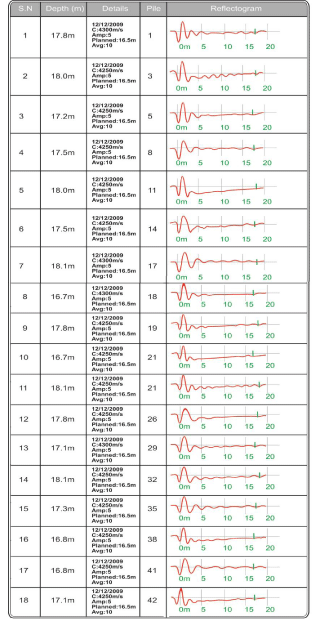
It is a common observation that the reflection of a pile is observed as positive or negative accelerated pulses. Steady velocity signal between the time of impact and pile bottom reflection is displayed as a negative pulse, whereas velocity increase (positive pulse) indicates a reduction in pile cross section or concrete quality. In general, relatively sharply defined positive reflections are attributed to impedance changes due to pile defects, while slowly changing positive reflections are usually caused by soil resistance. Pile Integrity Test (PIT) acceleration records of 15 piles of the Janaklis bridge show negative velocity reflections indicative of there are no defects below the top of the piles (Figure 9). Piles number 17, 35, and 41 show positive reflections at depths 5 m, 3m, and 4m, respectively. The positive reflections of these piles are slow changing which related to stiffness of the soil surrounding the pile. Therefore, the Janaklise pile integrity is satisfactory and all piles are good with no detected defects of the piles cross section.
Figure 9: Pile Integrity Test (PIT) acceleration records of Janaklis bridge piles.
Conclusion
This study integrated conventional methods with the Ground Penetrating Radar (GPR) towards evaluation of the pavement condition and assessment of bridge deck deterioration. Pile Integrity Test (PIT) using the sonic pulse echo was carried out to investigate bridge pile integrity. The selected sites are the Cairo-Alexandria desert highway (from Kilometer 127 to 160), and Janaklise bridge located at Kilometer 157 of the highway. The geotechnical evaluation consisted of visual survey, borehole drilling, coring, and Standard Penetration Test of the pavement sections and underlying subgrade soils. The results indicated that sub grade material is poor and has low stiffness and low resistance to deformation and therefore, cannot support a high amount of loading which resulted to pavement failure. Analysis of GPR images of the highway sections with block cracking show that the presence of moisture and/or clay subgrade soils with high electrical conductivity at these locations. The block cracks may be occurred due to volume change of the subgrade which induces stress in hot mix asphalt (HMA) layer that exceeds the tensile strength of the asphalt mixture. The geotechnical evaluation demonstrated the ability of GPR to map out subgrade moisture damage. GPR image of the Janaklise bridge deck show that there is deterioration in the middle of the bridge located between 19 m and 26m. The deterioration could be due to changes in concrete material properties associated with the delamination process, or to moisture infiltration into the delaminated area from the water canal. Analysis of PIT reflection records indicated that the Janaklise pile integrity is satisfactory and all piles are good with no detected defects of the piles cross section.
- Muller W. Ground Penetrating Radar (GPR) - Its applications within Main Roads and results of recent Concrete and Timber Field Trials. Presented at Road System and Engineering Technology Forum, Road System and Engineering Group, Queensland Department of Main Roads. 2001.
- Chen DH, Bilyeu J, Scullion T, Lin DF, Zhou F. Forensic Evaluation of Premature Failures of Texas Specific Pavement Study – 1 Sections. Journal of Performance of Constructed Facilities. 2003; 17: 67-74.
- AASHTO M 43. Standard Specification for Sizes of Aggregate for Road and Bridge Construction. American Association of State Highway and Transportation Officials, Washington, DC. 2005.
- Verdugo R, de la Hoz K. Strength and Stiffness of Coarse Granular Soils. Geotechnical Symposium in Rome. 2003; 16–17.
- Timo Saarenketo, Tom Scullion. Road Evaluation with Ground Penetrating Radar, Journal of Applied Geophysics. 2000; 43: 119-138.
- Saarenketo S. Implementation of Ground Penetrating Radar Technology in Asphalt Pavement Testing”, Proceedings of the Ninth International Conference on Asphalt Pavements, International Society for Asphalt Pavements (ISAP). Kopenhagen, Denmark. 2002.
- Barnes CL, Trottier JF. Effectiveness of Ground Penetrating Radar in Predicting Deck Repair Quantities. ASCE Journal of Infrastructure System. 2004; 10: 69-76.
- Al-Qadi IL, Lahouar S, Jiang K, McGhee K, Mokarem D. Validation of Ground Penetration Radar Accuracy for Estimating Pavement Layer Thicknesses. Paper No. 05-2341, Proceedings, Transportation Research Board 84th Annual Meeting, Washington, DC. 2005; 9-13.
- Uzarowski L, Maher, M., and Balasundaram, A. Practical Application of GPR to Supplement Data from FWD for Quick Pavement Performance Prediction. Annual Conference of the Canadian Society of Civil Engineers, Toronto, ON. 2005.
- Rmeili E, Scullion T. Detecting Stripping in Asphalt Concrete Layers Using Ground Penetrating Radar, Paper No. 97-0508, Presented at Transportation Research Board, Washington, DC, 1997.
- Al-Qadi IL and Loulizi A. Using GPR to Evaluate the Effectiveness of Moisture Barriers in Pavements. MC Forde, editors. In: Structural Faults and Repair 99, 8th International Conference, London, England. 1999.
- ASTM Standard D 6760. Standard Test Method for Integrity Testing of Concrete Deep Foundations by Ultrasonic Cross hole Testing,’’ ASTM International, West Conshohocken, PA. 2002.
- Paikowsky SG, Chernauskas LR. Review of Deep Foundations Integrity Testing Techniques and Case Histories. BSCES-GEO-Institute Deep Foundation Seminar. 2003.
- Massoudi N, Teferra W. Non-Destructive Testing of Piles Using the Low Strain Integrity Method. Proceedings of the Fifth International Conference on Case Histories in Geotechnical Engineering: New York, NY. 2004.
- Paikowsky SG, Cannif MC, Lesny K, Kisse A, Amatya S, Muganga R. LRFD Design and Construction of Shallow Foundations for Highway Bridges. NCHRP Report 651, Transportation Research Board, Washington, DC. 2010.
- ASTM D 3282-93. Standard Practice for Classi?cation of Soils and Soil-Aggregate Mixtures for Highway Construction Purposes.
- Fenner TJ. Ground–penetrating–radar for identification of mine tunnels and abandoned stopes: Society for Mining, Metallurgy, and Exploration, Inc., Annual Met., Preprint No. 1992; 92-115.
- Papadakis JLP, Wellner RW, Becker MA, Frank RR, Moses PS. Small–scale mineral cavity exploration utilizing high–resolution ground–penetrating–radar, in Proc., Symp. On the Appl. Of Geophysics. 1996.
- Abd Elhafeez T, Amer R, Saad A, El Kady H, Madi M. Evaluation of Flexible Pavement Mixtures Using Conventional Tests and Ultrasonic Wave Propagation. Advanced in Civil Engineering Materials. 2014; 3: 1-20.
- Peck RB, Hanson WE, Thornburn TH. Foundation Engineering. 2nd edn. John Wiley & Sons. 1974.
