
Review Article
Austin J Earth Sci. 2017; 3(1): 1021.
Gas Sand Detection Using Rock Physics and Pre-Stack Seismic Inversion a Real Example from Offshore Nile Delta
El-Mowafy H*
Department of Geology, Al-Azhar University, Egypt
*Corresponding author: :Hamed Z. El-Mowafy, Department of Geology Al-Azhar University, Egypt and Geoscientist Consultant, Houston, Texas. 6327 Borg Breakpoint Dr, spring, Texas, 77379, USA
Received: February 02, 2017; Accepted: March 17, 2017; Published: March 30, 2017
Abstract
Well logs and three-dimensional (3-D) partial angle stacks and full angle stack seismic volumes are used in this study with the purpose of detecting gas sands using rock physics and pre-stack inversion workflows. Integration of prestack inversion and rock physics analysis can improve the characterization of the late Pliocene gas sandstone reservoir, offshore Nile Delta. The inversion was performed using a deterministic wavelet set. Rock physics was used to enhance the VP, VS, and density volumes from the inversion. The present study performed in three phases: AVO analysis, pre-stack inversion, and Lambda-Mu- Rho (LMR) analysis. The results from the different cross plots (e.g. P-Impedance vs. Vp/Vs) show that the gas sands are clearly separated from brine sands and shale. By maximizing the potential offered from the elastic properties such as λρ, μρ and Vp/Vs ratio we were able to define the limits and cutoffs which sufficiently separate the gas sand bodies. The resulted volumes were used to better define the late Pliocene reservoir and optimize a new well location. The pre-stack inversion and AVO/rock physics studies resulted in a new Gas Initial in Place (GIIP) calculation that was doubled in the P50 case from the original estimation based only on the seismic amplitude data. The chance of success was increased and a new well is proposed to drain the gas in the eastern flank of Channel 1.
Keywords: Gas sand; AVO; Pre-stack inversion; Rock physics
Abbreviations
Vp: p-wave velocity; Vs: s-wave velocity; AVO: Amplitude Versus Offset; λρ: lambda-rho; μρ: mu-rho; GIIP: Gas Initial in Place
Introduction
The Nile Delta Basin covers an extensive area including onshore, shelf and deepwater environments. The Nile Delta offshore is rapidly emerging as a major gas province. High-quality three-dimensional (3-D) seismic data, coupled with data from thirteen consecutive successful deep-water exploration and appraisal wells, have highlighted clear phases of erosion and deposition within the upper Pliocene deep-marine slope channels [1]. Scarab field is part of the offshore Nile Delta and lies in West Delta Deep Marine (WDDM) concession, 50–100 km offshore in the deep water of the present-day Nile Delta (Figure 1). A series of successive exploration and appraisal wells drilled by BG Egypt and Rashpetco encountered gas-bearing sands in slope canyon settings on the concession (Figure 2). The Scarab field is submarine delta slope canyon system, with complex turbiditic channel-levee reservoirs. They record delta front submarine flows, mass wastage and related slope processes on the proto-Nile Delta. Detailed studies of the geometry of the canyon systems, from seismic extractions, core data, wire line logs and high-resolution FMI imaging [1] reveal a complex canyon fill.
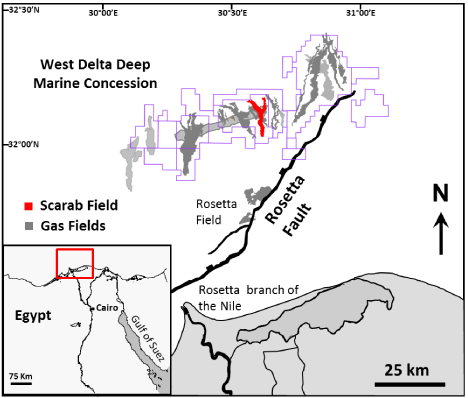
    Figure 1: Location map of the western Nile Delta and study area (red box).
Upper Pliocene gas fields are in grey and Scarab field is in red modified from
[1].
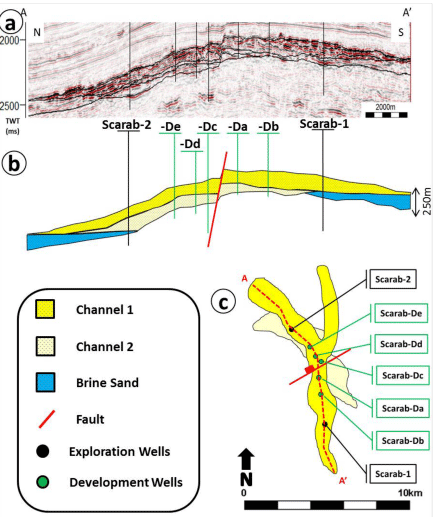
    Figure 2: (a) An arbitrary seismic section through the channels, (b) a
schematic section and (c) a map illustrating the Scarab field. The seismic
data in this and the other seismic displays have a normal polarity with a soft
kick (e.g., gas sand) a peak (black) and a hard kick (e.g., seabed and gaswater
contacts) a trough (red).
The basic building blocks of the canyons are regional incision surfaces that can be mapped from the seismic. These define the cutting of the canyons, and the canyon geometry. Canyons are not channels themselves but are filled with a complex sequence of turbid tic deposits which include thalweg channel deposits, transgressive sandstones, slumps, crevasse splays and various over bank deposits. The key elements of a canyon fill are summarized in (Figure 3). The term channel is reserved to describe specific confined sand-dominated elements within each of the canyon complexes. Scarab field consists of two stacked channels that were discovered in 1998 and came on production at the end of March 2003.
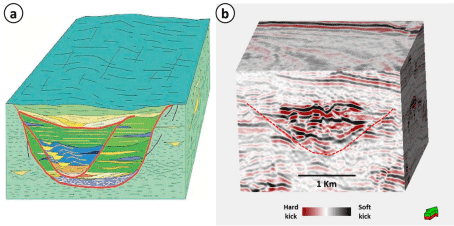
    Figure 3: (a) Schematic block diagram of the depositional model for
representative canyon complexes [1] and (b) actual seismic of Scarab field.
Red lines represent canyon incision surfaces cutting through background
slope deposits. Canyons are filled with a complex sequence of turbidite
deposits that include sand-filled channels, channel levees, crevasse splay
sands, over bank deposits, and slumps.
The available data for this study are sorted into well logs and seismic data. The available well logs are Gamma Ray (GR), deep resistivity (RD), P-wave velocity (Vp), S-wave velocity (Vs), and density (ρ) logs for seven wells. Other attributes as λρ were calculated from the original logs. The available seismic volumes are partial angle stacks of near (0°- 15°), mid (15°- 30°) and far (30°- 45°). In addition to full angle stack seismic volume.
The study has three phases; AVO analysis, pre-stack inversion, and Lambda-Mu-Rho (LMR) analysis. The resulted volumes were used to better define the reservoir and optimize the new well location.
Avo Analysis
The AVO response can be tested by plotting the reflection coefficients versus offset and cross plot the slope and intercepts of the curve. The classification of AVO response should be based on the position of the reflection of interest on an A (intercept) versus B (gradient) cross plot. This can be done using well control and amplitude-calibrated seismic data. (Figure 4a) depicts a color scheme used to classify seismic anomalies based on Rutherford and Williams’ (1989) classification. The polarity convention in this display denotes a decrease in acoustic impedance by a peak.
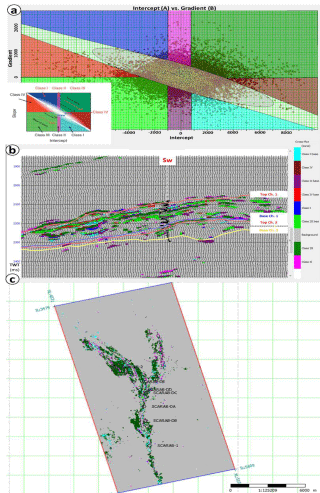
    Figure 4: AVO intercept vs. gradient cross plot (a) for a single cross-line that
passing through B well location (b). (c) Amplitude extraction from the AVO
classification scheme over top Channel 1 reservoir. Note that the dominant
color is the dark green which refers to class III gas sand.
Using this color scheme, four zones of AVO response were outlined on the AB cross plot shown in (Figure 4a) with top-gas points plotted in upper right corner and bottom gas points plotted in lower left corner. These responses were mapped back to the seismic section where they neatly picked out the top and bottom reflectors from the gas sands (Figure 4b). Using top of the reservoir, (Figure 4c) shows an amplitude extraction from the AVO classification scheme map to show the AVO response in a 3D manner. Plio-Pleistocene gas sands are usually Class III sands [2].
Pre-stack inversion
Using the partial angle stacks of near (0°- 15°), mid (15°- 30°) and far (30°- 45°) with proper deterministic wavelets, the pre-stack inversion estimates P-impedance (Zp) and S-impedance (Zs). Simultaneously with these volumes, Vp, Vs and Vp/Vs volumes were computed as well as the Lamé parameter volumes of lambda-rho (λρ) and mu-rho (μρ). It starts from an initial low-frequency model of P-wave velocity, S-wave velocity, and density. As the program iterates, it improves the fit between the recorded seismic traces and model-based synthetic traces by locally modifying the P-impedance model together with local deviations of the relationship between P-impedance, S-impedance, and density. Using well-logs, a variety of crossplots were created to see which one separates the lithologies the most. The clustered points on the Acoustic Impedance (AI) versus Vp/Vs cross plot show a good separation among the gas sand, brine sand and shale lithologies. The same was done with the P-impedance and Vp/Vs volumes obtained from the pre-stack inversion. The differentiation between gas sand, brine sand, and shale was performed with P-impedance vs. Vp/Vs cross plot. (Figure 5) shows the gas sand detection in the cross plot, section, and map.
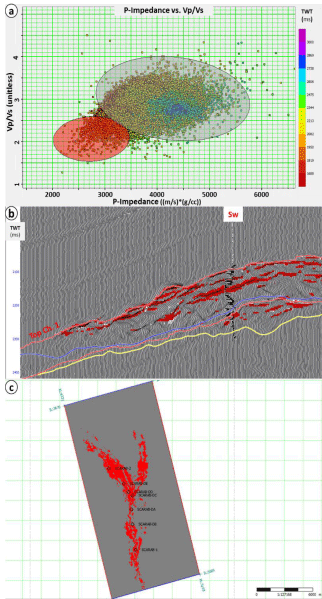
    Figure 5: (a) P-impedance vs. Vp/Vs cross plot using the inversion results.
(b) Seismic cross section displayed as wiggle traces highlighting gas sands.
(C) Amplitude extraction from the cross plot over top of Channel 1 reservoir.
The red color shows potential gas points while the grey color shows potential
shale points.
Assuming water saturation and volume of shale cut-offs equal to Sw<50% and Vsh<40%, respectively, we defined a Vp/Vs cut-off value (≈ 2.6) that separates gas-bearing sands from other lithologies. Subsequently, we can implement that cut-off on the Vp/Vs volume to detect gas-bearing sands.
Rock physics analysis
Following the work and recommendations of [3] the cross plot λρ - μρ was analyzed further as λ is described as the most sensitive fluid indicator. The physical interpretation of the lambda (λ) and mu (μ) attributes is: The λ term, or incompressibility, is sensitive to pore fluid, whereas the μ term, or rigidity, is sensitive to the rock matrix. The Lamé parameters were obtained during the simultaneous inversion from Zp and Zs. In theory, we cannot decouple the effects of density from λ and so, the output will be lambda-rho (λρ) and mu- rho (μρ) volumes and it is, therefore, most beneficial to crossplot λρ versus μρ to minimize the effects of density. The λρ-μρ crossplot can be used to define the gas sand with a λρ cut-off ranging between 6 and 7 GPa.g/cc as shown in (Figure 6a). This cut-off (≈ 6.6 GPa.g/cc) was mapped back to the seismic section passing through Scarab-De well (Figure 6b). The map in (Figure 6c) shows the same results in a 3D manner. Note that the results from this analysis are consistent with the results obtained from the AVO analysis and those obtained from inversion shown in (Figures 4) and (Figures 5), respectively.
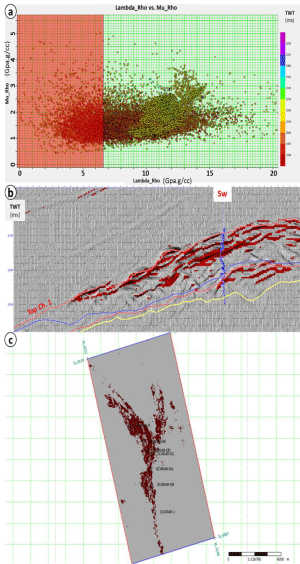
    Figure 6: (a) Attribute cross plot for λρ - μρ. (b) Seismic cross section
displayed as wiggle traces highlighting gas sands. (c) Amplitude extraction
from the λρ-μρ cross plot over top of Channel 1 reservoir. The dark red color
represents gas sand. The points less than the λρ cut-off of 6.6 GPa.g/cc are
defined as the good gas sands.
Results
The results from the different cross plots show that the separation of gas sands is better defined than brine sands and shale. By maximizing the potential offered from the elastic properties such as λρ, μρ and Vp/Vs ratio we were able to define the limits and cutoffs which sufficiently separate the gas sand bodies. An accurate reservoir Gas Initial in Place (GIIP) estimation was required to history-match the early commissioning of the fields to ensure optimal production rates and ultimate gas reserves. Based only on the seismic amplitude data, the GIIP estimation was not exceeding 30 Billion Cubic Feet (BCF) which was not enough to drill a new well. After the pre-stack inversion and AVO/rock physics studies, the new GIIP calculation was doubled in the P50 case. The chance of success was increased. A new well is now proposed to be drilled in the eastern flank to drain the gas (Figure 7).
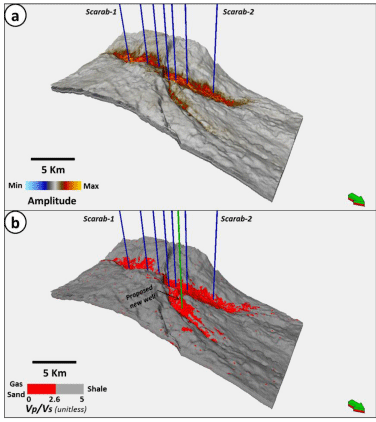
    Figure 7: Amplitude slice over Channel 1 reservoir (a) compared with Vp/Vs
slice (b). Note that all wells were drilled in the main channel body. Based on
the study, a new well (in green) is proposed in the eastern branch.
Conclusion
AVO analysis was used in an attempt to distinguish different lithologies at the reservoir zone. The cross plots allow isolation and comparison of the AVO responses. AVO attribute slice at the top of Channel 1 reservoir shows the dominance of AVO class III which was expected in the Pliocene channelized gas sands. The P-impedance-Vp/ Vs and λρ-μρ cross plots separate different lithologies in particular: gas and shale. Both cross plots are used successfully to outline the gas sands. The attribute slice over the top Channel 1 reservoir shows the distribution of the gas sands that is consistent with the AVO analysis results. The pre-stack inversion results were successfully used for accurate GIIP estimation and it added new reserves.
Acknowledgment
The author would like to thank the Egyptian General Petroleum Corporation (EGPC) and Rashid Petroleum Company (RASHPETCO) for providing the data and for the permission to publish this study. I would also like to thank Islam Ali from RASHPETCO for help and advice.
References
- Samuel A, Kneller B, Raslan S, Andy S, Parsons C. Prolific deep-marine slope channels of the Nile Delta Egypt. AAPG Bulletin. 2003; 87: 541-560.
- Rutherford SR, Williams RH. Amplitude-versus-offset variations in gas sands. Geophysics. 1986; 54: 680-688.
- Goodway W, Chen T, Downton J. Improved AVO fluid detection and lithology discrimination using Lame petrophysical parameters from P and S inversions. CSEG meeting abstracts. 1997; 148-151.