
Research Article
J Endocr Disord. 2021; 7(1): 1044.
Analysis of Micro-RNAs Profile Identifies miR-3065-3p, miR-4650-3p, miR-29b-2-5p, and miR-3915 as Novel Biomarkers in Gestational Diabetes Mellitus
Bhushan R1, Gupta D2, Rani A3, Upadhyay S1, Tripathi A4 and Dubey PK1*
1Banaras Hindu University, Centre for Genetic Disorders, Institute of Science, India
2Department of Obstetrics and Gynecology, Ashirwad Hospital, India
3Department of Obstetrics and Gynecology, Banaras Hindu University, India
4Department of Zoology, MMV, Banaras Hindu University, India
*Corresponding author: Pawan K Dubey, Banaras Hindu University, Centre for Genetic Disorders, Institute of Science, Varanasi-221005, India
Received: February 15, 2021; Accepted: March 11, 2021; Published: March 18, 2021
Abstract
Background: Gestational Diabetes Mellitus (GDM) is a metabolic disorder characterized by carbohydrate intolerance. Complete mechanisms involved in pathophysiology of GDM are still not well known and hence makes its early diagnosis and treatment a difficult task. Micro-RNAs are non-coding RNAs and have been found to be associated with many diseases including GDM. Methods: Here, we analyzed the transcriptomic datasets (GSE98043) to unravel the role of miRNAs in GDM. We processed and analyzed the microarray datasets to find differentially expressed miRNAs followed by miRNA-mRNA gene regulatory module to have a better understanding of its regulation.
Results: We identified a total of 128 Differentially Expressed (DE) miRNAs, of which the top 20 were selected for downstream processing. Four potential GDM miRNAs biomarkers namely miR-3065-3p, miR-4650-3p, miR-29b-2- 5p and miR-3915 were significantly altered in GDM. The micro-RNAs were linked to carbohydrate metabolism, insulin signaling, and cell proliferation and apoptosis. The pathways enrichment analysis shows that they are involved in insulin signaling and pathways related to cancer.
Conclusions: Our study lead to the identification of four potential GDM miRNAs biomarkers namely miR-3065-3p, miR-4650-3p, miR-29b-2-5p and miR-3915 were significantly altered in GDM and can be used as diagnostic as well as therapeutic purpose.
Keywords: Gestational diabetes mellitus; Micro-RNAs; Bio-markers; Genes; Gene ontology
Background
Gestational Diabetes Mellitus (GDM) is defined as any degree of carbohydrate intolerance, with onset or first recognition during the second or third trimester of pregnancy [1]. GDM complicates around 7% of all pregnancies while it comprises 90-95 % of all cases of diabetes in pregnancy. It is a major cause of perinatal morbidity and mortality, as well as maternal long term morbidity. The pathophysiology of GDM is still not fully characterized. Gestational diabetes mellitus is a metabolic disorder characterized by insulin resistance accompanied by low/absent beta-cell compensatory adaptation to the increased insulin demands [2].
MicroRNAs (miRNAs) are endogenous ~19-24 nt small noncoding RNAs that modulate gene expression by inducing the translational arrest and degradation of messenger RNAs. Micro-RNA is highly versatile as a single miRNA can potentially modulate multiple genes, whereas a single gene can be regulated by several miRNAs [3]. Such complex nature of miRNAs justifies its role in virtually every cellular process, as well as in development or differentiation, regulation of cell cycle [4], and immune system homeostasis [5]. Recently, several studies have reported the role of miRNAs in multiple sides of beta-cell function and differentiation [6], both in normal and diabetic conditions, as well as in beta-cell compensatory processes during pregnancy. Therefore a deep understanding of microRNA functions and genes and pathways related to it could improve the knowledge on the etiology and pathophysiology of GDM and its complications. Furthermore, due to their high stability in body fluids and their accessibility from maternal blood throughout gestation, they could serve as biomarkers for the early diagnosis and treatment of GDM.
This study aims to find altered miRNAs in GDM and their potential validated target genes, the determination of the most important miRNAs, and their related genes and pathways in Gestational Diabetes Mellitus. Here we investigated and identified GDM related Differentially Expressed miRNAs (DEmiRNAs), validated GDM related target genes, miRNA-mRNA interactions, and signaling pathways. Our results showed 128 DEmiRNAs of which the top 20 was considered for further analysis. Target genes were predicted and a consensus-based approach leads to the identification of validated GDM related target genes. Of the 128miRNAs, miR-3065-3p, miR- 4650-3p, miR-29b-2-5p, and miR-3915 are the most novel promising biomarker. Besides, Functional and pathways enrichment showed that these miRNA and their target genes have important roles in GDM and insulin metabolism.
Methods
Microarray data
Micro-RNA expression profile (GSE ID: GSE98043) datasets of human GDM have been selected that are available in the public repository: NCBI Gene Expression Omnibus (GEO) (http://www. ncbi.nlm.nih.gov/geo/) [7]. In this study, plasma from 4 pregnant women (2 from normal controls and 2 from GDM patients) were used. The Subjects were of Asian (Chinese) ethnicity and this microarray study was earlier approved by local Chinese ethics committee and participants; here we are just accessing the data from NCBI and analyzing them.
Data preprocessing and differentially expressed miRNA in GDM
The Series matrix file was downloaded and processed. The probe-level symbols were converted into gene-level symbols by using GEO2R [8]. Analyzing GDM has been done in two groups NGT (Normal Glucose Tolerant) control and GDM patients using the GEO2R tool, to detect the differentially expressed miRNAs. Top 20 differentially expressed miRNAs have been selected, of which 10 were highly up-regulated while 10 were highly down-regulated. The selection of miRNA was based on fold change value. All miRNA selected have P-values less than 0.05.
Identification of miRNA-target gene
Target genes of DE miRNAs, were identified from two databases namely Target scan [9] and miRDB [10]. Common target genes in both databases and having a target score >90 were selected and uploaded in STRING [11] for further analysis. Further CS>0.9 were taken as criteria for gene selection. Genes with TS>90 and CS>0.9 were selected.
Construction of miRNAs and mRNAs regulatory module (MMRM)
Target genes with a combined score >0.9 were then uploaded in Cytoscape 3.2.1 [12] and MicroRNA-mRNA Regulatory Module (MMRM) were constructed for up-miRNA and down-miRNA jointly. The network was analyzed and edge between ness was taken as criteria for network construction. Color and node size were attributed on the miRNA-target genes network to identify miRNA, mRNA, and GDM specific genes.
Enriched Gene Ontology and pathway analysis
Biological processes, molecular function, cellular component, and their related pathways in GDM related miRNA-target gene were identified using DAVID 7.6 [13]. Based on hypergeometric distribution, DAVID takes the genes with similar or related functions as a whole set. Significant functions were plotted against –log10 of the p-value for up and down miRNA-target genes separately. In this analysis p-value<0.05 was set as the criterion.
Results
Micro-RNA expression profile
Micro-RNA data sets were normalized and preprocessed to get expression profiles (Figure 1). Based on, A total of 128 differentially expressed miRNAs, 63 Up-regulated, and 65 Down-regulated miRNAs (p-value<0.005; fold change value ≥1.5) were identified in GDM. Out of these 128, top 20 differentially expressed miRNAs: 10 Up-miRs and 10 Down-miRs were selected for further study (Figure 2).
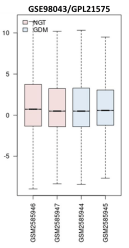
    Figure 1: Microarray data normalization. Box plot showing the distribution
of values data for the selected samples. The lines in the box are coincident,
indicating that these chips have been highly normalized.
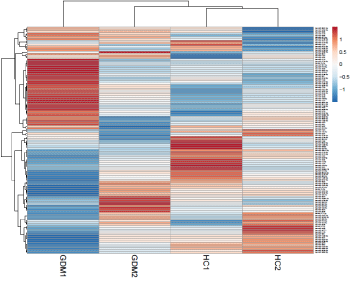
    Figure 2: Heat map for differentially expresses miRNA sets. Heat map
showing the average gene expression of differentially expressed miRNAs
(DEmiRNAs) among Gestational Diabetes Mellitus (GDM) and Healthy
Control (HC). The green to red gradation represents the gene expression
values change from small to large. ClustVis tool was used to draw heat map.
Principal component and hierarchical gene clustering analysis
PCA scatter plot reveals data clustering with axes corresponding to the two different principal components- principal component 1 (16%) and principal component 2 (72.8%) (Figure 3A). Heat-map shows a data matrix where coloring gives an overview of the numeric differences. Heat map was constructed for differentially expressed genes (Figure 3B).
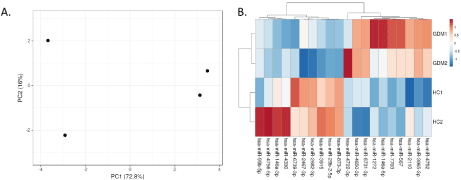
    Figure 3: Principal component analysis and Heat map for top 20 DE-miRNAs. PCA plot shows a scatter plot with principal component 1 (x-axis) and principal
component 2 (y-axis) showing total variance of 72.8% and 16% respectively. Heat map shows the expression of top 20 differentially expressed miRNA. ClustVis
tool was used for this.
Enrichment of target genes
Target genes search from two databases i.e. Target scan and miRDB, resulted in a total of 41,685 target genes for Up- and 50,831 genes for Down-regulated miRNAs. Sorting of the target genes based on target score >90 and combined score >0.9, we get a total of 162 target genes, 72 for Up-miRNAs, and 90 for Down-regulated miRNAs. In this study, novel potential genes involved in GDM were identified by comparing our computationally predicted target gene list with genes obtained from the Gene Cards database, containing experimentally validated GDM related gene Thus the result showed a total of 49 target genes, 22 for Up-miRNAs and 27 for Down-miRNAs as potential GDM specific target genes which are experimentally validated (Figure 4).
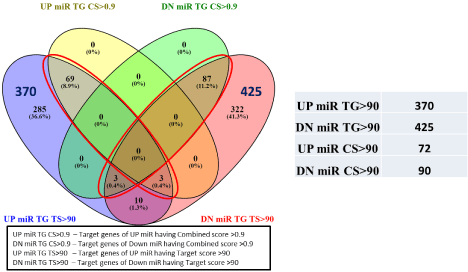
    Figure 4: Venn diagram showing the total number of target genes being regulated by DEmiRNAs. Selection of target genes based on Target Score (TS>90) and
Combined Score (CS>0.9). The red rectangle and ellipse highlights the total number of target genes UP and DOWN regulated miRNAs. Venny tool v 2.1.0 was
used to draw the vein diagram.
miRNA-mRNA Regulatory Module (MMRM) in GDM
Target genes (combined score >0.9) along with their respective miRNAs were used to construct the MMRM network. The MMRM for Up-miRs included a total of 114 genes (Figure 5A), 10 Up-miRs, and 257 edges (Figure 4) while MMRM for Down-miRs included total 166 genes (Figure 5B), 10 Down-miRs and 350 edges.
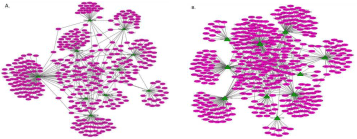
    Figure 5: MicroRNA-mRNA regulatory Module (MMRM). A. MMRM of up-regulated miRNA and their target genes. B. MMRM of down-regulated miRNA and their
target genes Blue ellipsetarget genes, Green triangle up-regulated miRNAs. Lines the correlation between genes Thickness of lines (edges) is proportional to the
combined score. Cytoscape v 3.2.1 was used to construct the network.
GO and KEGG pathway enrichment analysis
Gene ontology enrichment analysis lead to identification of significantly (p-value<0.05) enriched major processes like response to insulin stimulus, lipid and carbohydrate metabolism, tyrosine kinase and Wnt receptor signaling being regulated by these DE miRNAs (Figure 6). KEGG pathway analysis demonstrated total ten significant pathways. Long term depression, pathways in cancer, JAK-STAT signaling, Wnt signaling, Insulin signaling, and ErbB signaling are some of the major significant pathways being regulated by these DEmiRs (Figure 7).
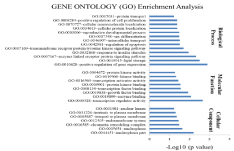
    Figure 6: Gene Ontology (GO) analysis for DE-miR in PPI network. Bar graph showing significant processes, function and cellular component enriched in diabetic
mothers for target genes of up-miR. DAVID v 6.7 was used for annotation.
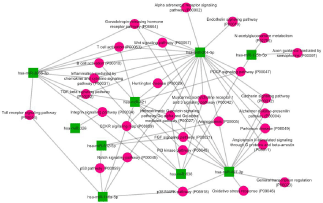
    Figure 7: KEGG Pathway analysis for DEmiRNAs in diabetic mothers. Pathway enrichment for DEmiR lead to identification of 3 significant pathways for up-miR
while 7 significant pathways for down-miR. DAVID v 6.7 was used for annotation. Red and blue bar represents pathways of up-miR and down-miR respectively.
Discussion
Gestational Diabetes Mellitus is a glucose metabolism disorder and its progresses much earlier before its clinical diagnosis which is accomplished at 24-28 weeks of gestation [7]. In recent years, incidences of GDM has increased dramatically and hence demands additional biomarkers to accurately monitor the status of gestational diabetes so that early screening in the first or second trimester of pregnancy could be feasible. Hence, deep understanding of GDM could have an important role in detecting biomarkers involved in the prognosis of GDM. Recently, diverse role of miRNA have been reported in many diseases [9-11]. Hence, it can be considered as optimal biomarkers and sensors in GDM. In the present study, we have tried to identify the blood-derived miRNAs biomarkers as well as molecular interactions that clarify biochemical mechanisms involved in GDM.
The microarray datasets, GSE98043-miRNAwas statistically analyzed in this study. We have identified a total of 128 differentially expressed miRNAs, 63 Up-regulated, and 65 Down-regulated miRNAs in GDM. For further analysis, only the top 20 differentially expressed miRNAs (10 Up and 10 Down) were selected and a heat map was generated (Figure 2). Target gene prediction led to the identification of a total of 41,685 target genes for Up- and 50,831 genes for Down-regulated miRs. These genes were further sorted based on target score and combined score leading to the identification of 49 potential validated GDM related genes (22 for up- and 27 for downmiRs) were identified (Figure 3). Then, the miRNA-mRNA regulatory module was constructed for Up-miRNAs and Down-miRNAs (Figure 4A, 4B). Validated GDM related target genes along with other neighbor-genes were enriched for their functions and pathways. Major significant functions and pathways regulated by target genes of Up-miRs were a response to insulin stimulus, lipid storage, regulation of apoptosis, cell proliferation, response to carbohydrate stimulus, Notch signaling, Wnt signaling, insulin signaling, and ErbB signaling pathways. Down-miRs were found to be involved in the regulation of fatty acid metabolism, regulation of immune response, pathways in cancer and long term depression, tyrosine kinase signaling (Figure 5).
We identified four potential GDM miRNAs biomarkers, miR 3065-3p, miR-4650-3p, miR-29b-2-5p, and miR-3915 that were significantly altered in GDM. Among these miRNAs, miR-3065- 3p and miR-4650-3p were Up-regulated while miR-29b-2-5p and miR-3915 were Down-regulated. Very less/no study on these four miRNAs makes them novel biomarkers for GDM. However, further experimental studies are required to validate these findings.
MIR-29b-2-5p has been shown to activate p53 expression and induce the p53-mediated apoptosis in Hela cells [14]. In another study, mir-29b-2-5p inhibited cell proliferation, induced cell cycle arrest, and promoted apoptosis [15]. Furthermore, in a variety of tumors including chronic lymphocytic leukemia, lung cancer, prostate cancer, and breast cancer, miR-29b-2-5p was down-regulated [16-17]. From network analysis, we revealed that mir-3065-3p, which has increased expression in GDM and enriched in insulin metabolism [18], has a role in the regulation of insulin signaling pathways. Besides its role in insulin signaling, it has also been found to regulate Wnt and JAK-STAT pathways. This implies that Insulin signaling is somehow related to Wnt and JAK-STAT.
The consensus approach led to the identification of GDM specific target genes of DEmiRNAs in GSE19649 datasets. Although these genes were not significant, however, they were found to be validated potential role players in GDM as confirmed from the results of Gene Cards search. These genes were TCF7L2, BRAF, IL10RB, CD36, and IL6ST regulated by Up-miRs namely miR-3065-3p, miR-2110, miR- 4650-3p, and miR-567 while ACSL1, AR, IL1RN, PRKG1 are genes regulated by Down-miRs namely miR-146a-3p, miR-2467-3p and mir-3915.
In conclusion, our finding suggests that the different expressions of miRNAs are one of the most important variables in GDM. We argued that, among others, miR-3065-3p, miR-4650-3p, miR-29b- 2-5p, and miR-3915 might be the most promising blood-derived miRNA biomarkers in GDM. Although, our analysis is based on the high throughput data and is not derived in our laboratory, a large number of experimental studies confirm that the pathways and genes which were involved in GDM are supported.
References
- Bhushan R, Rani A, Ali A, Singh VK, Dubey PK. Bioinformatics enrichment analysis of genes and pathways related to maternal type 1 diabetes associated with adverse fetal outcomes. Journal of Diabetes and its Complications. 2020; 34: 107556.
- Landon MD, Gabbe SG. Diabetes mellitus gestacional. Obstest Gynecol. 2011; 118: 691-705.
- Ashwal E, Hod M. Gestational diabetes mellitus: where are we now?. Clinicachimicaacta. 2015; 451: 14-20.
- Sebastiani G, Guarino E, Grieco GE, Formichi C, DelliPoggi C, Ceccarelli E, et al. Circulating microRNA (miRNA) expression profiling in plasma of patients with gestational diabetes mellitus reveals upregulation of miRNA miR-330-3p. Frontiers in endocrinology. 2017; 8: 345.
- Bowes SB, Hennessy TR, Umpleby AM, Benn JJ, Jackson NC, Boroujerdi MA, et al. Measurement of glucose metabolism and insulin secretion during normal pregnancy and pregnancy complicated by gestational diabetes. Diabetologia. 1996; 39: 976-983.
- Schiavone M, Putoto G, Laterza F, Pizzol D. Gestational diabetes: an overview with attention for developing countries. Endocrine regulations. 2016; 50: 62-71.
- Sebastiani G, Ventriglia G, Stabilini A, Socci C, Morsiani C, Laurenzi A, et al. Regulatory T-cells from pancreatic lymphnodes of patients with type- 1 diabetes express increased levels of microRNA miR-125a-5p that limits CCR2 expression. Scientific reports. 2017; 7.
- Sebastiani G, Valentini M, Grieco GE, Ventriglia G, Nigi L, Mancarella F, et al. MicroRNA expression profiles of human iPSCs differentiation into insulinproducing cells. Actadiabetologica. 2017; 54: 265-281.
- Faruq O, Vecchione A. microRNA: diagnostic perspective. Frontiers in medicine. 2015; 2: 51.
- Iljas JD, Guanzon D, Elfeky O, Rice GE, Salomon C. Bio-compartmentalization of microRNAs in exosomes during gestational diabetes mellitus. Placenta. 2017; 54: 76-82.
- Guay C, Regazzi R. Circulating microRNAs as novel biomarkers for diabetes mellitus. Nature Reviews Endocrinology. 2013; 9: 513-521.
- Barrett T, Troup DB, Wilhite SE, Ledoux P, Rudnev D, Evangelista C, et al. NCBI GEO: mining tens of millions of expression profiles-database and tools update. Nucleic acids research. 2007; 35: D760-D765.
- Davis S, Meltzer PS. GEOquery: a bridge between the Gene Expression Omnibus (GEO) and BioConductor. Bioinformatics. 2007; 23: 1846-1847.
- Sayed N, Jousselin A, Felden B. A cis-antisense RNA acts in Trans in Staphylococcus aureus to control translation of a human cytolytic peptide. Nature structural & molecular biology. 2012; 19: 105-112.
- Liu W, Wang X. Prediction of functional microRNA targets by integrative modeling of microRNA binding and target expression data. Genome biology. 2019; 20: 1-0.
- Franceschini A, Szklarczyk D, Frankild S, Kuhn M, Simonovic M, Roth A, et al. STRING v9.1: protein-protein interaction networks, with increased coverage and integration. Nucleic acids research. 2012; 41: D808-D815.
- Kohl M, Wiese S, Warscheid B. Cytoscape: software for visualization and analysis of biological networks. In Data mining in proteomics. 2011; 696: 291- 303.
- Huang TT, Gonzales CB, Gu F, Hsu YT, Jadhav RR, Wang CM, et al. Epigenetic deregulation of the anaplastic lymphoma kinase gene modulates mesenchymal characteristics of oral squamous cell carcinomas. Carcinogenesis. 2013; 34: 1717-1727.