Abstract
To evaluate the benefit of consuming agricultural products with purported health benefits, risks associated with toxicants such as heavy metals must also be considered. Black tea leaves from south India were subjected to various times of infusion in boiling water and brews were analyzed for heavy metals using atomic absorption spectroscopy. Of the metals analyzed lead, chromium, and nickel concentrations were found to increase in brews with increased infusion time. No significant differences in mean cadmium concentrations across brewing times were found in tea brews and increased brewing time did not influence cadmium leaching from black tea. Diffusion behavior of metals in black tea was found to be metal dependent and should be considered to evaluate comprehensive toxicological profiles of tea for consumption.
Keywords: Black tea; Heavy metals in tea; Antioxidants; Lead; Cadmium; Chromium; Nickel
Introduction
Commercial black tea is manufactured from the tender shoots of tea plants (Camellia sinensis) and is the most consumed beverage worldwide apart from water [1]. Black tea contains a variety of micronutrients, antioxidants, and flavonoids that provide nutrition for consumers and have been shown to protect against chemically induced cancers [2]. Numerous studies have highlighted tea as an important polyphenolic source of antioxidants that protect against degenerative disease [3-7]. It has been demonstrated that regular consumption of black tea may reduce cardiovascular risk by inducing vasodilation of conduit arteries in subjects with elevated cholesterol [8]. Brewed tea is nutrient dense with few calories and has been suggested as an ideal drink to improve overall quality of life [9-11].
Although there are many essential nutrients found in tea, there is a growing concern over potential toxicity associated with heavy metals found in common off-the-shelf ‘natural’ products [12]. The term “heavy metal” is often associated with metals that contain a high specific gravity but will be used here to indicate metals that possess known toxicity to organisms above a critical concentration.
Variations in the metal content and nutrient profiles of teas have been used previously to distinguish between their geographical origins [13]. As geographic regions differ in agricultural practices, a high variation of nutrient and non-nutrient profiles in tea is expected. To evaluate true benefit in consuming agricultural products with purported health benefits, risks associated with toxicant levels must be considered to develop consumer safety guidelines. As tea is a globally traded agriculture product, standardized routine testing protocols may become necessary to determine potential contamination related to nutrient profiles endemic to soils in various geographic regions.
Various stages of plant development require a variety of both macro and micro nutrients [14]. In the 1960s, Indian tea productivity increased because of agricultural practices that involved the use of synthetic and inorganic fertilizers. Micronutrients such as iron, manganese, boron, and molybdenum are abundantly available in tea growing regions in south India and further soil augmentation of these micronutrient profiles are uncommon [15-17].
Biosolids, comprised of commercial fertilizers and animal wastes, are known to contain heavy metals. After biosolids are applied to fields, heavy metals may be found in an inorganic form in various oxidation states or in organometallic complexes with soil [18]. Metal translocation, both complexed and inorganic, in crop plants has been reviewed and factors that control distribution of heavy metals at the subcellular level is largely unknown [19]. Criteria for crops to be defined as heavy metal hyperaccumulators may differ considerably amongst species and across soils with varying degrees of metal bioavailability [19]. Variability in agricultural practice and metal transport in Camellia sinensis should be considered when evaluating criteria for Minimum Risk Levels (MRL) for consumption.
Evaluating the impact of consuming black tea on public health lies in the determination of heavy metal content of tea leaves and the degree of leaching into tea brew [20-22]. Teas containing heavy metals can have potentially adverse effects on human health, in that trace levels have been shown to interfere with metabolic processes [23]. Many systems that involve sorption and diffusion of metals from complex biological matrices to aqueous environments are dependent on the type of metal, degree of complexation, concentration in the matrix, temperature, and inherent solubility [24]. Pb, Ni, Cd, and Cr were used as representative heavy metals to further investigate metal diffusion from tea leaves into brews. It is hoped that this study can be extended to further evaluate heavy metal contamination in tea leaves for public safety across geographic regions and agricultural practices.
Materials and Methods
One hundred black tea samples, collected from the tea growing regions of south India, were analyzed for heavy metal content within leaves. On an electronic balance (Shimadzu, AW220), two grams of randomly selected south Indian black tea with known heavy metal content was weighed and transferred into a 250-mL beaker. To the 250-mL beaker, 100 mL of 90-95°C water was added and the tea mixture was allowed to equilibrate for 6 minutes [25]. After brewing the infused solution was filtered, transferred into a 100-mL volumetric flask, and filled to volume with 90-95°C water to ensure equivalent volumes between brew times. A duplicate two-gram sample, from the same randomly selected south Indian black tea, was weighed and allowed to brew for 10 minutes. After brewing the infused solution was filtered, transferred into a 100-mL volumetric flask, and filled to volume with 90-95°C water.
Prepared tea brews were analyzed for metal content with Atomic Absorption Spectroscopy (Perkin Elmer AA-Analyst 800) affixed with a graphite furnace for quantification. Linear working range of reference (NIST SRM’s) used in tea infusion analysis was 0.1-5μg L-1 for Pb, 0.01-1μg L-1for Cd, 0.01-1μgL-1 for Ni and 0.01-1μg L-1for Cr. Limit of detection and limit of quantification were then calculated. Experimentally determined concentrations of metals infused in water from tea leaves for 6 and 10 minutes were then used to calculate percent infusions from previously determined heavy metal content in tea leaf samples.
An F-test was conducted to determine equality of variance in percent infusion of metals between infusion times. F-test results were then used to guide two-sample t-tests assumptions of equality/ inequality of variance in sample means. To determine if there was a significant difference in concentration of heavy metals across infusion times, t-tests for each metal were then performed (P<0.05, n=16).
Results and Discussion
Method validation
Prior to heavy metal quantification in tea brew, the method was validated. Results of method validation are shown in Tables 1 and 2. A series of calibration solutions were prepared and checked for linearity in the response of the instrument. A linear regression curve was plotted with concentration and absorbance. Intercept (a), slope (m) and correlation co-efficient (r2) values were used to determine method validation parameters of Limit Of Detection (LOD) and Limit Of Quantitation (LOQ) for the instrument at 95% confidence levels. The LOD and LOQ were compared to Commission Regulation No. 333/2007 [26] for levels of lead, cadmium, mercury, and tin in foodstuffs as a reference method. Method validation results are shown in Table 1, spike-recovery validation results of individual metals by AAS are shown in Table 2, and results of statistical analysis are shown in Table 3.
    Heavy metal
    Linearity
      Solution concentration
      (µg L-1)
    No. of analysis for each conc.
    Limit of Detection (LOD)*(µg L-1)
    Limit of quantitation (LOQ)#(µg L-1)
    Intercept(a)
    Slope(b)
    Standard deviation of intercept(Sa)
    Correlation   co-efficient (r2)


    Pb
    0.01, 0.20
      0.50, 1.00
      2.00 & 5.00
    3

      0.003

      0.008

      0.000004

      0.003

      0.0025122

      0.99999


    Cd
    0.01, 0.05
      0.10, 0.20
      0.50 & 1.00
    3

      0.0002

      0.0008

      -0.0000004

      0.003

      0.0002239

      0.99999


    Ni
    0.01, 0.05
      0.10, 0.20
      0.5 & 1.0
    3

      0.002
    0.005
    0.000012

      0.003

      0.0015523

      0.99991


    Cr
    0.01, 0.05
      0.10, 0.20
      0.5 & 1.0
    3

      0.0005

      0.002

      -0.0000004

      0.002

      0.0003356

      0.99999


    *LOD (µg mL-1) = ¦a¦+    3Sa/b
      #LOQ (µg mL-1) = ¦a¦+    10Sa/b
Table 1: Method validation for tea infusion.
    Heavy metal
    Heavy metal
      content in    control tea infusion (µg mL-1)
    Added
      (µgmL1)
    Recovered* (µg mL-1)
    Recovery
      (percent)
    Mean Recovery±SD(%)
    %RSD**


    Pb
    0.015
    0.05
      0.1
      0.2
    0.048
      0.099
      0.2
    96
      99
      100
    98±2.08
    2.12


    Cd

      0.008

    0.01
      0.05
      0.1
    0.0095
      0.049
      0.099
    95
      98
      99
    97±2.08
    2.14


    Ni
    0.039
    0.05
      0.1
      0.2
    0.048
      0.098
      0.2
    96
      98
      100
    98±2.00
    2.04


    Cr
    0.051
    0.1
      0.2
      0.3
    0.097
      0.199
      0.301
    97
      100
      100
    99±1.73
    1.75


    * Calculated    after removing the conc. of heavy metal in control tea infusion;
      ** % RSD = (SD x 100)/mean
Table 2: Method validation – Spike-Recovery for tea infusion.
Quantitation of heavy metals in tea brew
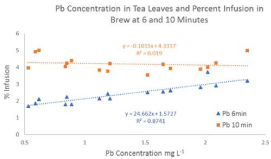
As shown in Figure 1, a positive correlation exists between Pb concentration in tea leaves and infusion into brew (R² = 0.87) at an infusion time of six minutes but no correlation was observed at ten minutes. This may indicate that Pb concentrations (0.05±0.03 mg L-1) are saturated in tea brew after ten minutes of infusion in 90-95°C water. Mean percent infusion was found to be 2.4% at six minutes and 4.2% at ten minutes (Table 3). F-test results indicated equal variance in mean percent infusion of Pb and a t-test confirmed that there is a significantly higher infusion of Pb at longer brewing times.

    Figure 1:  Pb Concentration in tea leaves and percent infusion in brew at 6
and 10 minutes.
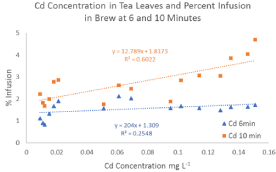
No correlation was found between Cd concentration in tea leaves and infusion into brew at six minutes (R² = 0.25) (Figure 2). A slight correlation was found between Cd infusion into brew at ten minutes and concentration in tea leaves (R² = 0.60). Mean percent infusion for Cd was found to be 1.5% at six minutes and 2.7% at ten minutes. F-test results indicated an unequal variance in mean percent infusion of Cd and a t-test, assuming unequal variance, confirmed that there is a significantly higher infusion of Cd from tea leaves at longer brewing times.

    Figure 2:  Concentration of Cd in tea leaves and percent infusion at 6 and
10 minutes.

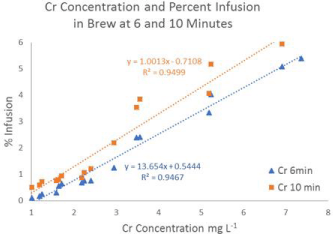
    Figure 4:  Concentration of Cr in tea leaves and percent infusion at 6 and 10
minutes.
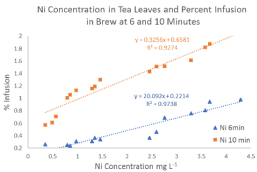
A positive correlation was found between Ni concentration in tea leaves and infusion into brew at six minutes (R² = 0.97) and ten minutes (R² = 0.93) is shown in Figure 3. This indicates that Ni levels increase in brew with longer brewing times in water at 90-95°C and with higher concentrations of Ni in tea leaves. Mean percent Ni infusion was found to be 0.5% at six minutes and 1.3% at ten minutes. F-test results indicated unequal variance in mean percent infusion of Ni and a t-test confirmed that there is a significantly higher infusion of Ni at longer brewing times.
    Metal
    Mean %Infusion6    min
    Mean    %Infusion10 min
    F-test for equality of variance F-Values(Fcrit =2.4, df =15)
    Two    sample t-test
      P-values(P<0.05, n=16)
    Significant    difference in means?


    Pb
    2.4
    4.2
    1.6
    1.6E-11
    Yes


    Cd
    1.5
    2.7
    6
    3.7E-5
    Yes


    Ni
    0.5
    1.3
    2.5
    6.8E-7
    Yes


    Cr
    1.8
    2.4
    1.3
    0.2
    No
Table 3: Statistical results for heavy metal infusions from black tea at 6 and 10 minutes.

    Figure 3:  Concentration of Ni in tea leaves and percent infusion at 6 and 10
minutes.
A positive correlation was found between Cr concentration in tea leaves and infusion into brew at six minutes (R² = 0.95) and ten minutes (R² = 0.95) is shown in Figure 3. Mean percent Cr infusion was found to be 1.8% at six minutes and 2.4% at ten minutes. F-test results indicated equal variance in mean percent infusion of Cr and a t-test confirmed that there was no significant difference in mean percent infusion of Cr across brewing times of six and ten minutes. These results may indicate that Cr effusion from black tea leaves is independent of brewing time and that Cr concentrations in tea leaves can be used to estimate percent infusion of Cr in tea brews.
Conclusion
This study confirmed that heavy metal concentrations in tea brews from south India were within safe limits when compared with previous reported levels [27-29]. It is confirmed that Pb, Cd, Cr and Ni leach into tea brew and transport behavior from tea leaves into the brew is metal dependent. Concentrations of heavy metals studied were found to be higher with longer brewing time except for Cr. Levels of metals in black tea brews are several orders of magnitude lower than concentrations found in black tea leaves and should be considered when determining a toxicological profile of metals in black tea for consumption.
Acknowledgement
The authors are grateful to the Tea Board, Government of India for the financial assistance under the X five-year plan.
References
- Harbowy ME, Balentine DA. Tea chemistry. Crit Rev Plant Sci. 1997; 16: 415-480.
- Higdon JV, Frei B. Tea catechins and polyphenols: health effects, metabolism, and antioxidant functions. Crit Rev Food Sci Nutr. 2003; 43: 89-143.
- Amarakoon M, Tappia PS, Grimble RF. Endotoxin induced production of Interleukin-6 is enhanced by vitamin E deficiency and reduced by black tea extract. 1995; 44: 301-305.
- Balentine DA. The role of tea flavonoids in cardiovascular health. Shizuoka. 2001.
- Fukino Y, Aoki N, Takeshita K, Tojo Y, Okubo T. A study on the effects of green tea intake on blood glucose in Shizuoka, Japan. 2001.
- Zhang H, Spitz MR, Tomlinson GE, Schabath MB, Minna JD, Wu X. Modification of lung cancer susceptibility by green tea extract as measured by comet assay. Cancer Detect Prev. 2002; 26: 411-418.
- Shukla Y, Pal SK, Arora A, Kalra N, Gupta YK. Beneficial health effect of black tea: increasing evidence. 2005.
- Hodgson JM, Puddey IB, Burke V, Watts GF, Beilin LJ. Regular ingestion of black tea improves brachial artery vasodilator function. Clin Sci. 2002; 102: 195-201.
- Krishnamoorthy KK. Value of tea nutritionally and therapeutically. Planter’s Chron. 1987; 81: 203-206.
- Weisburger JH. Tea and health: the underlying mechanisms. Proc Soc Exp Biol Med. 1999; 220: 271-275
- Amarakoon T. Tea for Health. Tea Research Institute of Sri Lanka. 2004.
- Schwalfenberg G, Genius SJ, Rodushkin I. The benefits and risks of consuming brewed tea: beware of toxic element contamination. J Toxicol. 2013; 2013: 370460.
- Fernández-Cáceres PL, Martin MJ, Pablos F, González AG. Differentiation of Tea (Camellia sinensis) Varieties and Their Geographical Origin According to Their Metal Content. J Agric Food Chem. 2001; 49: 4775-4779.
- Natesan S, Ranganathan V. Content of various elements in different parts of the tea plant and in infusions of black tea from southern India. J Sci Food Agric. 1990; 51: 125-139.
- Verma DP, Palani N. Phosphorous nutrition for sustained tea productivity in south India. Bull. 1995; 48: 47-58.
- Verma DP. Magnesium nutrition of tea. News Lett. 1995.
- Venkatesan S. Notes and amendments to the recommendations on manuring of tea in south India. 2007.
- Mortvedt JJ. Heavy metal contaminants in inorganic and organic fertilizers. Fertilizer Research. 1995; 43: 55-61.
- Page V, Feller U. Heavy Metals in Crop Plants: Transport and Redistribution. Processes on the Whole Plant Level. Agronomy. 2015; 5: 447- 463.
- Barooah AK, Kalita J N, Collier PD, Barbora BC. Residues of pesticides in made tea and hot water brew. 1994.
- Shanker A, Kumar V, Tewary DK. Fate of pesticide residues on tea from leaf to cup. Inter J Tea Sci. 2003; 2: 18-26.
- Kumar V, Tewary DK, Ravindranath SD, Shanker A. Investigation in tea on fate of fenazaquin residue and its transfer in brew. Food Chem Toxicol. 2004; 42: 423-428.
- Jaishankar M, Tseten T, Anbalagan N, Mathew BB, Beeregowda KN. Toxicity, mechanism and health effects of some heavy metals. Interdiscip Toxicol. 2014; 7: 60-72.
- Nestle N, Kimmich R. Concentration-Dependent Diffusion Coefficients and Sorption Isotherms. Application to Ion Exchange Processes As an Example. J Phys Chem. 1996; 100: 12569-12573.
- Indian Standard. Method for preparation of tea infusion for sensory evaluation. Bureau of Indian Standards.
- Indian Standard. Method for preparation of tea infusion for sensory evaluation. Bureau of Indian Standards.
- Onianwa PC, Adetola IG, Iwegbue C, Ojo MF, Tella OO. Trace heavy metals composition of some Nigerian beverages and food drinks. Food Chem. 1999; 66: 275-279.
- Al-Oud SS. Heavy Metal Contents in Tea and Herb Leaves. Pak J Biol Sci. 2003; 6: 208-212.
- Shen FM, Chen FW. Element composition of tea leaves and tea infusions and its impact on health. Bull Environ Contam Toxicol. 2008; 80: 300-304.
