Abstract
The aim of this study is to evaluate and discuss the impact that the restrictive measures adopted for coronavirus have had on the main air pollutants. CO and NOx trends showed a reduction in levels from January to April 2020. A reduction in NOx (54%) concentration and in CO (7.6%) was detected by comparing the average of their values measured from March 9th - April 15th in 2019 and in 2020. A reduction in NOx concentrations compared to the average of previous four years was detected in March (47%) and April 2020 (73%). PM2.5 and PM10 concentrations measured by the Lazio Regional Agency for Environmental Protection in various urban sites in Rome, were studied. PM2.5 and PM10 trends from January 1st to April 15th showed a concentration decrease, although during this period they exceeded the recommended daily level several times. PM10 has exceeded the limit value from March 28th-30th, and the analysis of the backward trajectories of the NOAA detected a desert dust transport from the Caspian Sea. PM2.5 showed high values from March 18th-22nd and from April 8th-13th. A long-range transport of air masses from regions with high SO2 emission sources was detected, while analyzing the daily trends of CO, SO2 and radon for these periods. The influence of domestic heating on PM levels was evaluated for the years 2018 and 2019. The results did not show a significant impact of domestic heating on PM levels.
Keywords: Main gaseous pollutants; PM2.5 pollution; Rome urban air; Long-range transport; COVID-19
Introduction
For just over a month, most of the world’s population was forced to stay at home to stop the spread of coronavirus epidemic. Thus, quarantine measures led to a drastic decrease in the intensity of motor vehicle traffic. Air quality is very important for population health as the International Agency for Research on Cancer (IARC) has classified outdoor air pollution as carcinogenic to humans (Group 1) [1,2]. In this study, concentrations of Carbon Monoxide (CO) and Nitrogen Oxides (NOx), were measured in the urban air of Rome from January 2020 and the data were compared with those measured at the same site in the period from January to April 2019. A further comparison was made between the NOx concentrations measured in the months of March and April 2020 and those detected in the previous four years (2016-2019) at the same site. PM2.5 and PM10 concentrations, measured by the Lazio Regional Agency for Environmental Protection [3] in various urban sites in Rome, were studied. Moreover, natural radioactivity has been used as a reliable tracer of the dilution properties of the lower atmosphere. In Rome there are no heavy industries, but it is characterized by very high vehicular traffic with about 2,700,000 private cars. In Rome contribution of road transport to total Province emissions of main air pollutants is: 54% NOx, 54% PM10, 37% CO and 3.7% SO2. Nonindustrial combustion plants contribute about 12% of NOx emissions, 38% of PM10, 49% of CO and 14% of SO2 [3]. The most useful fuel for domestic heating is methane. The aim of our study is to evaluate and discuss the impact that the restrictive measures adopted to contain the spread of the coronavirus have had on the main air pollutants. Indeed, one of the few positive things about the coronavirus pandemic is the unique and rare opportunity to evaluate the impact that motor traffic sources have on urban pollution, an opportunity not to be missed. Moreover, in Italy the coronavirus pandemic has particularly affected some regions of northern Italy, causing a high number of deaths. In these regions the level of pollutants both for the presence of industries and for the characteristic “concave” conformation of the Po Valley is higher than in other Italian regions. In fact, particulate matter, that penetrates the alveolar epithelium, [4] ozone that initiate lung inflammation [5] and nitrogen oxides that increase the susceptibility to respiratory infections, may have influenced the spread of coronavirus. Moreover, a dose–response relationship between PM exposure and adverse effects has been identified, and the improvement in health outcomes is observed when the PM exposures are reduced. Thus, the levels of particulate matter in urban air play a fundamental role in the effects on human health. Some studies have shown an association between high levels of pollutants and the number of people infected by Coronavirus [6] As the replication of the coronavirus occurs in the cells of the respiratory epithelium it causes acute inflammation and a violent respiratory disease [7]. So, the association between coronavirus and high pollutant levels, which stimulate lung inflammation, could contribute to increase the effect of the virus. Furthermore, in these months in which the Coronavirus epidemic has involved the whole world, particulate matter has taken on an even more decisive role as some authors have associated its high exposure to the spread of the virus [8,9] and a recent study has found the presence of the coronavirus on PM [10] Thus, in this particular moment the atmospheric pollution plays a determining role.
Methodology
Sampling site description
Rome is the largest metropolitan area in Italy, with an extension of 1290 km2 and about 2.9 million inhabitants (ISTAT, 2019) [11]. It has a Mediterranean climate with an average annual temperature of 15.7°C and an average annual rainfall of 798 mm. The measurements presented in this work were carried out at the monitoring station situated in the front yard of the Italian National Institute of Health (ISS) (2 km east of the city center). The ISS monitoring station is located in a large road with medium-high traffic intensity and it is about 8m from the curb. Sampling site is located in an area characterized by high vehicular traffic in fall, winter and spring while the traffic is lower in summer. Continuous measurements of CO, NOx, NO, NO2, and Radon concentrations were developed from January 1st 2019 to April 15th 2020. The inlet system for all the pollutants monitored was situated on the roof of the monitoring station at a height of ~2 m above ground level.
Quality assurance/quality control (QA/QC)
To ensure quality of data, a complete QA/QC program was followed, which include an assessment of detection limits, zero control, flow control, lack of fit (linearity) test and accuracy. The Standard Methods, UNI EN 14626: 2012 for CO (CEN, 2012a) and UNI EN 14211: 2012 for NO, NO2, NOx (CEN, 2012b), are used as a template for instruments performance testing. Calibrations were performed at the beginning of the campaign and quarterly.
Carbon monoxide and nitrogen oxide level quantification
For continuously monitoring CO and nitrogen oxide concentrations were used CO Monitor (Horiba Ltd.; Model APMA- 370) and NOx monitor (Horiba Ltd.; Model APNA- 370). Additional information relating to detection limit of the instruments and their calibration can be found in Fanizza et al., [2].
Natural radioactivity
PBL mixing Monitor (FAI Instruments, Fontenuova, Italy), a sequential automatic system, was used to estimate the low Planetary Boundary Layer (PBL) mixing ratio. Additional information relating the instrument are available in Fanizza et al., [2].
PM10, PM2.5, CO and SO2 data
The concentrations of PM10, PM2.5, SO2 and CO measured by the Lazio Regional Agency for Environmental Protection (ARPA Lazio) have been used in this study. ARPA monitoring stations are located in different areas of Rome. Eight stations have been taken into consideration for PM10 and four for PM2.5, one of these is located in a green park and it is classified as an urban background. SO2 and CO levels, related to the ARPA monitoring station located within the park (it is located about 2.5 km as the crow flies from our monitoring station), were used to identify the transport of sulphates.
Dust model and backward- trajectory analysis
Dust and sulphate simulations was performed by the Navy Aerosol Analysis and Prediction System (NAAPS) global aerosol model. NAAPS based on the Danish Eulerian Hemispheric Model [12] produces 6-day forecasts of SO2, sulfate, dust, biomass burning smoke and sea salt mass concentration with 1x1 degree resolution at 25 levels every 6h. Backward trajectories were estimated with the HYSPLIT model provided by the National Oceanic and Atmospheric Administration (NOAA) of the United States of America, available at the NOAA AIR Resources Laboratory (ARL).
Data analysis
One-way ANOVA analysis and Student Newman Keuls posthoc analysis, were used to compare annual pollutant variations considered in this study. Confidence levels of 0.001 and 0.05 were marked as highly significant and significant, respectively.
Results and Discussion
2019 and 2020 CO time series are shown in (Figure 1a). The comparison between the two-time series showed that in January the CO concentrations were higher in 2020 than in 2019. This may be due to a longer period of atmospheric stability in January 2020, as can be seen from the measurement of natural radioactivity shown in (Figure 1b). In February, with comparable atmospheric conditions between the two years, the CO concentrations were higher in 2019 than 2020. Nitrogen oxides showed the same time series (Figure 1c). From the end of February, in conjunction with the discovery of the first cases of COVID in Italy and the adoption of the first containment measures by the government, the concentrations of the main gaseous concentrations began to decrease. The most evident drop in concentrations was measured from March 9th onwards, just on the date the Italian government issued the decree called #Istayathome. Subsequently, more restrictive measures were adopted such as the closure of all activities deemed unnecessary and the movement of people, from the municipality in which they are located, was prohibited. All these restrictions have been extended until May 4th. Usually, the daily time series of nitrogen oxides and carbon monoxide present two peaks one in the morning and the other in the late afternoon related to the intensity of motor traffic (Figure 2a). The daily time series of CO and NOx showed a gradual reduction in concentrations since the entry into force of the first restrictive regulations. In addition, the daily time series of April 10th, one month after the entry into force of the restrictive measures, displayed a morning single peak detected an hour after the normal time and with concentrations reduced by about a quarter (Figure 2b). In the same period in 2019 (April 12th 2019) the CO and NOx time series showed a second peak related to traffic in the late afternoon. Around the monitoring area there are numerous pubs that attract a wide range of people and the lack of evening traffic peak may also be due to the closure of these activities to limit the possible spread of COVID-19. A reduction in NOx (54%) concentration and in CO (7.6%) was detected by comparing the average of their values measured from March 9th-April 15th in 2019 and in 2020. Our data agrees with those measured by ARPA Lazio in stations located throughout Rome. ARPA data showed a NOx reduction from 8 to 70% depending on the station considered: the 8% reduction relates to the station located in a green park; 70% to the station near traffic roads. In addition, NOx concentrations of March and April (from April 1st to 15th) 2020 were compared with those measured on the same site in the last four years (2016-2019). The results (Figures 2c&d) showed a reduction in NOx concentrations in 2020 compared to the average of the previous years. This reduction was more marked in April than in March: a reduction of 47% and 73% was detected in March and April respectively. The ARPA report [13] relating to the effects on air quality in the Lazio region of the emergency during the COVID-19 showed that in Rome the NO2 reduction, compared to the previous four years, varies in March from 55% to 44%, while in April the variation was more marked from 61% to 68% depending on the station taken into account. As with regards to CO concentration, ARPA data showed a 7.5% reduction for the station located inside a green park and a 32% reduction in a station near heavy traffic. In the ARPA report [13] the analysis of transport in the urban area of Rome showed a 61% reduction in urban travel during the period February 23rd-March 27th. The daily analysis of transport showed that the decrease has been continuous since March 5th, with percentages ranging from 15% of March 9th to 74% on April 14th. The time series of PM10 and PM2.5 from of January 1st to April 15th in the ARPA various stations located in Rome area (Figures 3a&b). Particulate matter concentrations decreased, although during this period both PM10 and PM2.5 exceeded the recommended daily level several times. For the protection of human health, the European Union (Directive 2008/EC/50) has established two limit values for PM10: 50 μg/m³ as average daily value which may not be exceeded more than 35 times in a year and 40μg/m³ as annual average value [14]. While for PM2.5 the European Union has set only the annual limit value (25μg/m³). The World Health Organization Air Quality guidelines set at 25μg/m³ the 24-hour mean of PM2.5 [15].
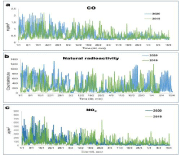
Figure 1: Daily time series of CO (a), natural radioactivity (b) and NOx (c) for the period from January 1st - April 15th years 2019 and 2020.
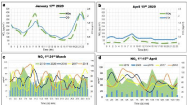
Figure 2: Diurnal variations of NOx and CO on January 17th (a) and on April 10th (b); daily time series comparison of NOx among 2020 and the last four years (2016-2019) during the periods from March 1th-March 31th (c) and from April 1th - April 15th (d).
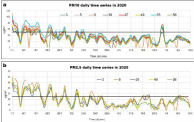
Figure 3: Daily time series from January 1st - April 15th 2020 of PM10 (a) and PM2.5 (b) in different ARPA stations.
Taking into account the period from the start of the lockdown to April 15th, PM10 has exceeded the limit value from March 28th to 30th, while PM2.5 showed high values from March 18th to 22nd, with values exceeding the limit value in two stations, and from April 8th to 13th. In the latter period the limit value was exceeded in only one station. During the lockdown period, the population had to stay at home and the use of domestic heating will certainly be increased, then this will have contributed to the levels of the pollutants. In Rome methane is the fuel most used for domestic heating, it is considered the cleanest fossil fuel since its combustion produces less carbon dioxide per joule delivered than coal or oil and less quantities of sulfur dioxide and nitrous oxide than other types of fuel [16]. In Rome, non-industrial combustion plants account for 12% of NOx and 38% of PM10 emissions. Based on the calculation of day degrees, the Italian territory is divided into 6 climatic zones identified by a capital letter from “A” (warmer) to “F” (colder). For each climatic zone, the period in which the heating can be switched on has been defined. Rome is in the climatic D zone and the heating can be switched on from November 1st to April 15th.
For central Italy, Aste et al., [17] estimated the contribution on total Natural Gas (NG) consumptions for cooking purposes and hot water production for households in the non-heating period (May, June, July, August and September) equal to 22.2%. Again, for central Italy, the average monthly heating consumption, as a percentage of total NG demand, varies from around 22.5% in January to less than 2.5% in October, for April the monthly average is estimated to be less than 7.5% [17]. To assess the influence of domestic heating on the PM levels, the concentration average of the period in which the home heating can be switched on was compared with that of the period in which it is certainly switched off, both in 2018 and in 2019. The average concentration of domestic heating on period (Figures 4a&b), called “heating” (1 November-15 April) and that of the period relating to heating off, “non-heating” (16 April-31 October) for PM10 and PM2.5, both in 2018 and in the 2019. The differences measured between the heating and non-heating periods are not significant (p-value >0.05) for all stations in 2019. In 2018, only the differences measured in station “55” and “56”, for PM10 and for PM2.5 respectively, are significant (p-value <0.05). Station “55” is classified as a traffic station, while station “56” is located in Rome center in a restricted traffic area and it is considered a residential station. For the years and the monitoring stations taken into account the results seem to indicate that domestic heating does not impact in a determinating way. From March 28th to 30th, PM10 exceeded the limit value in weather conditions favorable to the dispersion of pollutants and in the presence, in the previous days, of very low concentrations of PM10. The most probable cause of the increase in dust was linked to the arriving of air masses that transported dust of natural origin (desert dust). The advection of desert dust was investigated from March 28th to 30th. Backward-trajectories were calculated by the Hybrid Single-Particle Lagrangian Integrated Trajectory Model (HYSPLIT) [18,19] available at the NOAA Air Resources Laboratory (ARL). Through the analysis of NOAA back-trajectories the origin of dust levels observed on 28th-30th March can be attributed to desert dust from the Caspian Sea (Figure 4a). Besides, the Navy Aerosol Analysis and Prediction System (NAAPS) global aerosol model was used to produce forecasts of sulfate and dust in the period from March 28th to 30th. On March 28th NAAPS maps of dust and sulphate surface concentration showed the movement of air masses coming from North-Eastern European regions transporting both desert dust from the Caspian Sea and sulphates (Figures 4b&c). For the days March 29th and 30th on the NAAP website the data relating to the only transport of sulphates and dust are missing, however on the site there are maps that simultaneously show the transport of sulphates, dust and smoke (Figures 5a&b). The study of backward trajectories and the movement of air masses have confirmed the transport of natural origin dust. Besides, numerous ARPAs have detected, in the same days, the presence of desert dust from the Caspian Sea in the region of Tuscany, Abruzzo and in various other regions of northern Italy. The Directive 2008/50/EC specifies that contributions from natural sources can be assessed but cannot be controlled and thus exceedances of the limit value shall not be considered [14]. Furthermore, a long-range transport of air masses from regions with high SO2 emission sources can be detected analyzing the daily time series of CO (used as marker of vehicular fuel combustion), SO2 and radon. ARPA Lazio station taken into account is classified as urban background it is located in a green park. In the days from March 28th to 30th, time series analysis showed that the values of radon and CO drop, while SO2 level increased (Figure 6). The air pollution level is determined by both the intensity of its emissions and the dynamic properties of the atmospheric boundary layer, causing pollutant dilution or accumulation. Monitoring radon and its short-lived decay products provides information on the dilution potential of the Planetary Boundary Layer (PBL). Natural radioactivity increases when atmospheric stability allows the accumulation of Radon in the low layers of the PBL. The same occurs for pollutants when emission is due to local source. During phenomena of long-range transport of air masses, the vertical degree of planetary boundary layer mixing increases and radon and pollutant concentrations decrease. Therefore, the concentration of SO2 should also decrease, but the daily time series showed that it increases, so this increase can be explained only with a long-range transport of air masses from regions with high SO2 emission sources. The first study which showed that in most European countries the deposition of sulfur due to foreign sources represents an important contribution to the total deposition was that of Eliassen and Saltbones [20]. In Italy, Eliassen and Saltbones estimated that the sulphur deposition due to foreign emissions accounted for 22% of total deposition. Abdalmogith and Harrison [21], demonstrated the association of high-nitrate and -sulphate concentrations with trajectories arising within the European mainland. Manigrasso et al., [22] used natural radioactivty measurements to interpret the variations of the aerosol size distribution shape, allowing to discern whether such variations are due to the changing contribution of local sources or to long-range transport phenomena, in addition they attribuited the contribution due to the transport of SO2 to the fine fraction of the PM. The exceedances of PM2.5 daily limit values, from February 19th to April 15th, can be attributed to the transport of sulphates as shown by CO, SO2 and radon time series and confirmed by NAAPS maps (Figures 7a&b). The ARPA report [13] related a PM10 average reduction of 14% in the period March-April 2020 compared to the last four years (Figures 8).
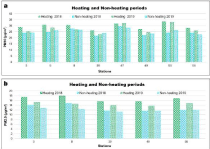
Figure 4: PM10 (a) and PM2.5 (b) levels measured during heating and nonheating periods in ARPA monitoring Stations in 2018 and 2019.
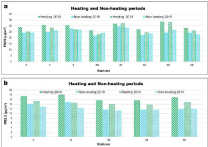
Figure 5: HYSPLIT 96 h backward air mass trajectories passing over Rome at 750, 1500 and 2500 above ground level, on March 30th at 12 UTC (a); NAAPS dust (b) and sulphate (c) plots on March 28th at 18 UTC.
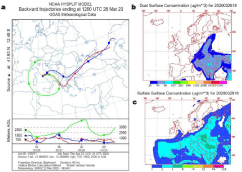
Figure 6: NAAPS sulphate, dust and smoke plots on March 29th (a) and on March 30th (b) at 12 UTC. The green shades indicate the dust, the orange ones the sulphates and the blue ones the smoke.
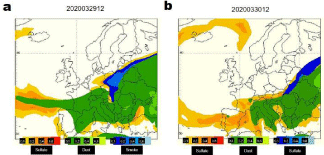
Figure 7: Daily time series of CO, SO2 and radon from March 28th -March 31st.
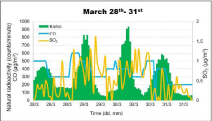
Figure 8: Daily time series of CO, SO2 and radon: from February19th - February 21st (a); from March 18th - March 21st (c) and from April 1st - April 15th (e). NAAPS sulphate plots on: February 19th at 12 UTC (b); March 22nd at 00 UTC (d); April 5th at 12 UTC (f).
Conclusion
In February, coronavirus outbreaks began in Italy and from March 10th industrial activities deemed unnecessary were closed, and the population was put under a lockdown. The restrictive measures adopted for COVID-19 have led to a drastic reduction in vehicular traffic with a consequent reduction in air pollution. In fact, CO and NOx time series showed a reduction in levels from January to April 2020. The most evident drop in concentrations was measured from March 9th onwards, just on that date the Italian government issued the decree called #Istayathome. A 54% reduction in NOx concentration and 7, 6% in CO was detected by comparing the average of the values measured from March 9th to April 15th in 2019 and in 2020. In addition, the NOx concentrations of March and April (from April 1st to 15th) 2020 were compared with those measured on the same site in the last four years (2016-2019). The results showed a reduction in NOx concentrations in 2020 compared to the average of the last 4 years of 47% for March and 73% for April. Also, the concentrations of the particulate matter decreased even if in some days the limit values were still exceeded. The influence of domestic heating on PM levels was evaluated. The heating and non-heating periods of the years 2018 and 2019 were compared and the results did not show a significant impact of domestic heating on PM levels. At the end of March, PM10 level exceeded the limit value and in the same period PM2.5 concentration also increased. The increase in PM10 was linked to the transport of dust from the Caspian Sea desert. Trend analysis of the CO, radon and SO2 associated with NAAP maps showed that the same air mass carried both desert dust and sulphate. Furthermore, a longrange transport of air masses from regions with high SO2 emission sources was detected in February, March and April. The ARPA report [13] related a PM10 average reduction of 14% in the period March- April 2020 compared to the last four years. In Italy the so-called “phase 2” or “phase of coexistence with the virus” began on May 4th. From this date, some production activities have reopened such as manufacturing, construction, wholesale and some of the services with a direct impact on 4.5 million workers. In any case, companies will have to favor smart working wherever possible. Furthermore, citizens have been granted a series of individual freedoms superior to those that characterized the lockdown. Then a gradual restart of work activities has been scheduled. With the gradual resumption of activities, urban pollution levels could increase. The continuous monitoring of pollutants, during this phase and until the resumption of normal work, will allow us to better characterize the main sources of pollutants.
References
- Straif K, Cohen A, Samet J. Air Pollution and Cancer. IARC scientific publication 161, International Agency for Research on Cancer, France. 2013.
- Fanizza C, De Berardis B, Ietto F, Soggiu ME, Schiro R, Inglessis M, et al. Analysis of major pollutants and physico-chemical characteristics of PM2.5 at an urban site in Rome. Science of the Total Environment. 2018; 616-617: 1457-1468.
- ARPA Lazio Inventario delle emissioni regionali. 2015.
- Ghio AJ, Huang YC. Exposure to Concentrated Ambient Particles (CAPs): a review Inhal Toxicol. 2004; 16: 53-59.
- Uysal N, Schapira RM. Effects of ozone on lung function and lung diseases. Curr Opin Pulm. Med. 2003; 9: 144-150.
- Conticini E, Frediani B, Caro D. Can atmospheric pollution be considered a co-factor in extremely high level of SARS-CoV-2 lethality in Northern Italy? Environ Pollut. 2020; 261:114465.
- Channappanavar R, Perlman S. Pathogenic human coronavirus infections: causes and consequences of cytokine storm and immunopathology. Semin Immunophatol. 2020; 39: 529-539.
- Bontempi E. First data analysis about possible COVID-19 virus airborne diffusion due to air Particulate Matter (PM): The case of Lombardy (Italy). Envir Resear. 2020; 186: 109639.
- Dutheil F, Baker JS, Navel V. COVID-19 as a factor influencing air pollution?. Env Pollution. 2020; 263, Part A: 114466.
- Setti L, Passarini F, De Gennaro G, Barbieri P, Pallavicini A, Ruscio M, et al. Int J Environ Res Public Health. 2020; 17: 2986.
- Istituto Nazionale di Statistica, ISTAT. 2019.
- Christensen JH. The Danish eulerian hemispheric model – A threedimensional air pollution model used for the arctic. Atmos Environ. 1997; 31: 4169-4191.
- Report QA. COVID april 2020. L’effetto sulla qualità dell’aria nel Lazio dell’emergenza COVID-19.
- European Commission (EC). Council Directive 2008/50/EC, Directive of the European Parliament and of the Council of 21 May 2008 on ambient air quality and cleaner air for Europe. The European Parliament and the Council of the European Union. Off. J. L. 2008; 152: 1-44.
- WHO AQGs. World Health Organisation. WHO Air Quality Guidelines for Particulate Matter, Ozone, Nitrogen Dioxide and Sulfur Dioxide. WHO/SDE/ PHE/OEH/06.02. 2005. WHO, Geneva. 2011; 1-22.
- EIA. Natural Gas Issues and Trends. 1998.
- Aste N, Del Pero C. Impact of domestic and tertiary buildings heating by natural gas in the Italian context. Energy Policy. 2012; 47: 164-171.
- Draxler RR, Hes GD. Description of the HYSPLIT 4 Modeling System. NOAA Tech. Memo. ERLARL-224. NOAA Air Resources Laboratory, Silver Spring. 1997.
- Draxler RR, Rolph GD. “HYSPLIT (Hybrid Single-Particle Lagrangian Integrated Trajectory) Model,” NOAA, Air Resources Laboratory, Silver Spring. 2011.
- Eliassen A, Saltbones J. Modelling of long-range transport of sulphur ver Europe: a two-year model run and some model experiments. Atmospheric Environmenr. 1983; 17: 1457-1473.
- Abdalmogith SS, Harrison RM. The use of trajectory cluster analysis to examine the long-range transport of seconday inorganic aerosol in the UK. Atmos Environ. 2005; 39: 6686-6695.
- Manigrasso M, Febo A, Guglielmi F, Ciambottini V, Avino P. Relevance of aerosol size spectrum analysis as support to qualitative source apportionment studies. Environ Pollut. 2012; 170: 43-51.
