Abstract
Elevated sea-surface temperatures are a necessary but not sufficient requirement for the formation of hurricanes and typhoons. This paper suggests a way to exploit this. Twomey [1] showed that cloud reflectivity depends on the size-distribution of cloud drops, with a large number of small drops reflecting more than a smaller number of larger ones. Mid-ocean air is cleaner than over land. Latham [2-4] suggested that reflectivity of marine stratocumulus clouds could be increased by releasing a submicron spray of filtered sea water into the bottom of the marine boundary layer. The salt residues left after evaporation would be mixed by turbulence through the full depth of the marine boundary layer and would be ideal cloud condensation nuclei. Those that reached a height where the air had a super-saturation above 100% by enough to get over the peak of the Köhler curve would produce an increased number of cloud drops and so trigger the Twomey effect. The increase in reflection from cloud tops back out to space would cool sea-surface water. We are not trying to increase cloud cover; we just want to make existing cloud tops whiter. The spray could be produced by wind-driven vessels cruising chosen ocean regions. The engineering design of sea-going hardware is well advanced. This paper suggests a way to calculate spray quantities and the number and cost of spray vessels to achieve a hurricane reduction to a more acceptable intensity. It is intended to show the shape of a possible calculation with credible if not exact assumptions. Anyone with better assumptions should be able to follow the process.
Keywords: Hurricane; Typhoon; Cloud-reflectivity; Sea-surface temperature; Twomey effect; Spray vessel
Introduction
Readers will not need reminding of the damage caused by Atlantic hurricanes in the autumn of 2017 and by Typhoon Haiyan in 2013. So far the results of attempts to control hurricanes [6,7] have been at best inconclusive. This may have been because action was taken after the hurricane had already formed so that energy levels were already very high. If you want to moderate a hurricane tomorrow, you will be far too late. You should have started last November. There were also concerns about legal liability for any events following an attempt at an unsuccessful reduction. A first assumption of this paper is that Governments of countries, which have previously suffered from hurricane damage, could all agree on what sea-surface temperatures would present a lower risk and so be a desirable target. Satellites can now make good measurements of anomalies in sea-surface temperature. The number of spray vessels to be deployed would be chosen with information based on the trajectory of temperature rise. By doing the control continuously rather than over a few days, the enormous power requirements are reduced by about two orders of magnitude.
What Temperature Reduction Do We Need?
Whitney and Hobgood [8] analyzed the relationship between hurricane intensity defined from wind velocity, and sea- surface temperatures. Figure 1 of this paper is taken from Figure 1 of theirs. The absence of events at the top end of the temperature range is a puzzle. Whatever the reason for the cut off, these data suggest that a reduction of 2 degrees Kelvin would be a useful target for initial engineering feasibility studies.
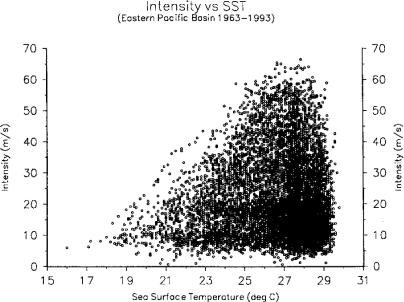
    Figure 1: The Whitney and Hobgood [8] scatter diagram showing the intensity
of 11062 observations related to sea-surface temperatures.
How Much Water Do We Have To Cool?
The oceans are an immensely complex system. Stommel and Arons show water movements depending on wind, temperature, salinity, and the rotation of the Earth [9]. Furthermore, changes of water temperature may themselves affect currents. Before any deployment of hurricane moderation, it will be necessary to study the entire ocean system in great detail but we can make a first estimate of expected energy flows. Figure 2 shows the paths of recent hurricanes. Those affecting the Caribbean, Mexico and the United States often start near Cape Verde Island close to Africa. The distance from there to Mexico is about 8000km. The ‘diameter’ of the Gulf of Mexico is about 2400km. If we take the spread of tracks at the Cape Verde end as 1000km and ignore the tracks that turn right to go North-East into mid Atlantic we have a trapezium with an area of about 1.36 x 10¹³ square metres.
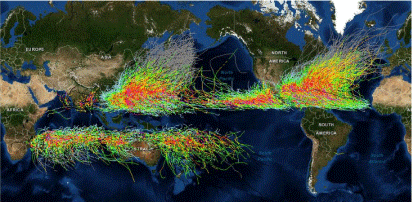
    Figure 2: Hurricane and typhoon tracks usually start far out to sea and never less than 7 degrees from the equator. From https://geozoneblog.files.wordpress.
com/2014/05/globalwrappedclipped.png.
The US National Weather service [10] gives a value for the depth of warm water below a hurricane of 150 feet, nearly 50 metres. This gives a mass of water to be cooled as 7 x 10¹⁷kg.
From Kaye and Laby, we know that the specific heat of 3.5% salt water is 3993kJ/kg. K, a little lower than fresh water. This means that the heat, which must be removed, is 5.4 x 10²¹ Joules. This is nearly 80 million times the energy release of the 15 kiloton of TNT equivalent from the weapon used at Hiroshima.
We want to operate before the hurricane season so we choose 200 days for the cooling time. If we divide energy by time, we get power. For these assumptions, the cooling power is 3.2 x 10¹⁴ watts. Even with a 100% efficient cooling plant, this is nearly 700 times more than the mean electrical power generation in the United States in 2016. This result will concentrate the minds of climate engineers.
However daunting these numbers are they are small compared with the amount of solar energy coming in to the area of the hurricanebreeding path. If we take the mean solar input to the cloud top as 300 watts per square meter, the product of input power time’s trapezium area is 4 x 10¹⁵ watts. This allows us to calculate that the reflectivity along the hurricane-breeding path must be increased by only 8% or perhaps even less if we can treat water flowing into the breeding area. Figure 3 shows a set of 20 grey-scale bars from black to white. By counting how many bars are needed to detect the brightness gradient, you can estimate the contrast-detection threshold of your own eye.

Figure 3: Most people need three or four bars to see the gradient direction.
The Twomey Effect
Twomey measured cloud reflectivity, scooped samples of cloud drops and calculated their size distribution. He found that, for the same amount of liquid water, a large number of small drops reflects more than a small number of large ones. Twomey’s results have been analyzed by Schwartz and Slingo [11] who produced an equation. Reflectivity depends on the depth of the cloud Zc, the amount of liquid water Lw and the concentration of cloud drops Nd. This is set by the concentration of condensation nuclei in the boundary layer that reach a sufficient relative humidity.
In the marine boundary layer cloud, depth Zw is typically 300 metres and Lw is 0.3mL/m³. In air over land the nuclei concentration is 1000 per cubic centimeter or more, but mid-ocean air is much cleaner, with concentrations of 10per cm³ for air masses that have been over the Antarctic up to 100/cm³. The concentrations can be measured by the NASA MODIS and TERRA satellites. Seasonal maps and monthly counts from Vallina et al. [12]. In Figure 5 and 6 and are in line with Bennartz [13].
For clouds with reflectivity between 25% and 75%, Schwartz an Slingo suggest an equation for reflectivity R as
For a concentration of 35/cm3 and the Zc and Lw values above, this predicts a reflectivity of 0.44. Doubling the concentration increases reflectivity by a little over 0.05. Figure 4 shows graphs of the equation for various conditions.
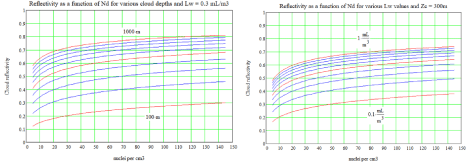
    Figure 4: The upper graph uses the Schwartz-Slingo equation to calculate cloud reflectivity as a function of nuclei concentration for cloud depth increases of 100
meters for a liquid water content of 0.3mL/m3. The lower shows reflectivity for a 300 meters deep cloud as a function nuclei concentration for liquid water increases
of 0.1mL/m³. The slopes of reflectivity with increased nuclei concentration are quite similar showing that nuclei concentrations matter more than cloud depth or
liquid water content.
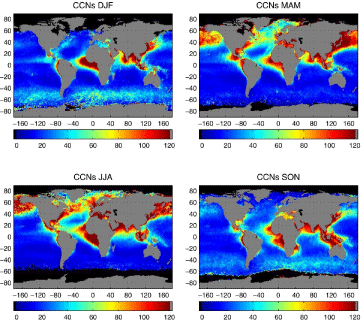
Figure 5: Seasonal maps of the concentration of condensation nuclei per cm3 form Vallina et al. [15].
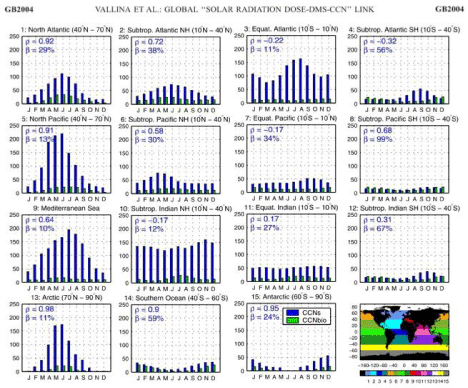
    Figure 6: Seasonal concentrations of condensation nuclei over ocean regions from Vallina. The green bars are the fraction of condensation nuclei produced by
phytoplankton, which are doing a useful job in cloud production to regulate temperature [14].
The Schwartz and Slingo equation can be rearranged to give drop concentration per cm 3 for a given reflectivity
If we know the required concentration, the depth of the marine boundary and the fraction of cloud cover we can calculate how many condensation nuclei will be needed for how much cooling.
Nuclei in the marine boundary layer come from salt residues from breaking waves, from dimethyl sulphide excreted by phytoplankton and from winds blowing polluted air from land. Viscous forces on particles with submicron dimensions are far more powerful than gravitational ones. The Stokes equation modified by Beard [15] predicts that in perfectly still air a 0.8-micron drop from a spray vessel would fall at 23 microns a second, far less that the random turbulence velocities in the boundary layer. The main loss mechanisms are coagulation with other nuclei to form clusters of material, which are big enough to fall, by collision with cloud drops and by washout from drizzle or rain. The literature has a wide range of estimates for nucleus life. If drizzle and rain were important, a low cloud fraction would be offset by a longer life. Indeed because a lower dose over a larger area is more effective, there is case for spraying under clear skies into air masses, which will later become cloudy. Intelligent fleet controllers can send vessels to the right places.
A recent paper by Ahlm et al. [15] strengthens the blue-sky argument. They found that cooling from spray under clear-sky is as large as that in the all-earth system models used in the Geoengineering Model Inter-comparison Project. While dry salt residue dimensions are about a quarter of the original drops of spray and very much smaller than cloud drops, that might grow after a successful nucleation, they will have a higher albedo and probably a longer life. They will also be more evenly spread by the time that they move towards a cloudy region. Nuclei, which are in air below the critical relative humidity, can wait their turn and have time to spread out to a wider area. If the Ahlm result is replicated it would be tempting to ignore the cloud fraction term and reduce the reflectivity increase requirement from 0.444 to only 0.552. The Schwartz-Slingo equation would then predict that a concentration increase from 35 successful condensation nuclei to 90 per cubic centimeter would suffice. If the cloud fraction were 0.5, we would need a reflectivity increase to 0.6 and a concentration increase to 235per cm³, still well below concentrations on land.
To work out how many nuclei we would need to provide requires information for the depth of the marine boundary layer and the life of nuclei. Both range widely. Depths range from 85 metres over the Arctic up to 2000 metres. If from Remillard et al. [16] we take a depth of 1500 metres and assume an even distribution through that depth, the initial number of nuclei over the trapezium of the hurricane breeding area is 7.14 x 10²³. The increase from 35 nuclei per cubic centimeter to 235 needs this number to be raised to 4.8 x 1024. This is an addition of 4.085 x 1024.
Nucleus life estimates go up to 10 days. The present design of spray vessel produces 30kg per second as 0.8-micron drops so the drop rate is 1017 per second. If we use an effective life of 3 days, we can calculate the number of spray vessels needed to maintain the higher nuclei concentration. This comes to 158. Some will be in the wrong place or out of action so we might order two hundred and adjust how many are in action for a given sea-surface temperature target. Figure 7 and 8 from Wikipedia [17] shows current paths in the North Atlantic and the Caribbean. Cooling along the hurricane-breeding path will be passed northwards, initially by the Gulf Stream. It will reduce the probability of repeating the effects of Hurricane Sandy. It will spread across the North Atlantic past Norway and so will slow the loss of Arctic ice. The Atlantic has a gyre, which returns some of the flow to the Canary current back to Cape Verde Islands, and so some fraction of the cooled flow will circle round again and less spray will be needed in later years. The phase lag will have to be taken into account by climate control-system engineers. Flow velocity in the gyre is of the order of 0.1 metres a second [18] so the time from Cape Verde back to the Gulf of Mexico is 2.5 years.
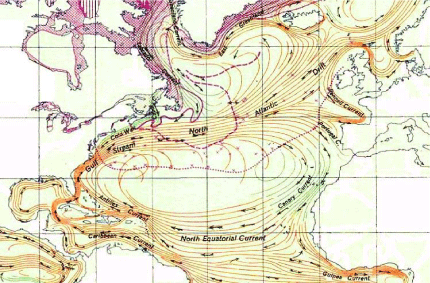
Figure 7: Flow patterns in the North Atlantic from Wikipedia show that a fraction of the cooled flow will come round again and so reduce future cooling requirements.
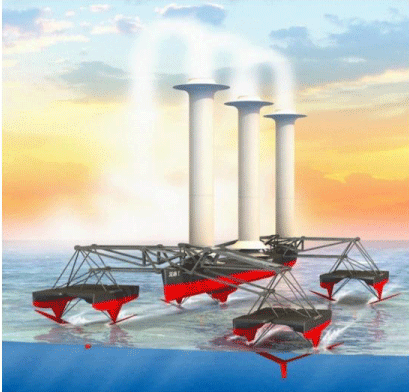
    Figure 8: An artist’s impression ©John MacNeill of a spray vessel driven by Flettner rotors. Waterline length 45 meters. Displacement 90 tonnes. Power of 300kW
for spray generation and rotor drive will be generated by the flapping motion of four variable-pitch hydrofoils.
In their AR5 report the IPPC give the total forcing from preindustrial times to 2016 as 2.3 watts per square meter [19]. If we multiply this by the area of the Earth, the total is 1.173 x 10¹⁵ watts. If we divide the suggested equatorial cooling power of 3.2 x 10¹⁴ watts by the IPCC total forcing we see that moderating hurricanes in the North Atlantic would offset 27% of the world’s warming to date. This seems a very high fraction and suggests that the effects of cooling one place will spread widely so that hurricane moderators can do less in future. The logarithmic result of the Twomey equation shows that it is better to use a low dose over a wider area.
Costs
Most ships are built in quite small numbers, often only singles. The most notable exception was the Liberty ship programme during World War II. Their displacement was 14,000 tonnes, large for that time. American industry built 2710 of them for $2 million each [20]. A second and smaller exception was Flower class corvettes, 267 of which were built for the Royal Navy. This is closer to expected numbers of spray vessels. Adjusting for the lower power rating, lower displacement and the absence of weapon systems and price index linking the 1940 price of £60,000 [21] we can estimate the massproduction costs of a 90 tonne spray vessel today at about $4 million. The capital repayment and maintenance costs of a two-hundred vessel flotilla, say 10% of capital, would be $80 million a year spread over 25 years. If there is a surplus of vessels, they can be rented out for cooling the Arctic, the Australian Barrier Reef or El Niño events. We may also be able to earn money from carrying instruments for environmental observations and acquire merit by rescuing distressed yachts-people.
Bloomberg [22] quoting Watson and Johnson gives an estimate of $202 billion US costs for Atlantic hurricanes in 2017. A benefit-to-cost ratio of 2500 would be attractive. In comparison to the cost estimates for sea level rise and future strength hurricanes which marine cloud brightening could moderate, the benefit-to-cost ratio would be very close to infinity! Owning a marine cloud brightening fleet may even be cheaper than the cost of international climate conferences. The Paris conference was budgeted at 170 million Euros [23]. We can be much more pessimistic than the assumptions used in this paper.
Conclusions
Although the amounts of energy involved in hurricane generation are enormous, they are still far below those of the solar input and so hurricanes could be controlled by adjustments to the reflectivity of marine clouds and resulting changes to sea surface temperatures.
Deploying countermeasures long before the hurricane season will greatly reduce the power rating of cooling plant. The crude engineering estimate of the necessary cooling power along the hurricane-breeding path between the Cape Verde Islands and the Gulf of Mexico is a surprisingly large fraction of the IPCC AR5 figure for the difference between preindustrial times and 2016.
The Twomey effect is based on physical observations of cloud properties and can be regarded as robust but the use of the Schwartz- Slingo analysis depends on knowledge of initial nuclei concentration, cloud fraction and the effective life of sprayed nuclei, which are variable and less well known.
The feasibility of the proposal needs a careful study of present ocean current patterns and the ways in which they might change. It would be an advantage to treat a larger ocean area if phase-lag problems can be overcome.
As well as hurricane moderation, marine cloud brightening could preserve present sea levels, reduce the loss of Arctic ice, prevent coral bleaching and allow some control of El Niño events.
If index-linked comparisons with the 1940 costs of Flower class corvettes are valid, the benefit-to-cost ratio of sea surface cooling is attractive.
The capitalist system will find it difficult to pay corporations for stopping things happening that might not have happened. However, it might be possible for Governments, insurance companies or owners of coastal real estate to pay for an agreed, measureable reduction of sea-surface temperatures. We do pay police forces to prevent crime. Socialized defense has proved better than the use of War Lords.
Acknowledgments
Work on climate engineering at Edinburgh University is privately supported.
References
- Twomey S. Pollution and the Planetary Albedo. Atmospheric Environment. 1974; 8: 1251-1256.
- Latham J. Control of global warming. Nature. 1990; 347: 339-340.
- Latham J, Bower K, Choularton T, Coe H, Connelly P, Cooper G, et al. Marine cloud brightening. Philosophical Transactions of the Royal Society A. 2012; 370: 4217-4262.
- Latham J, Parkes B, Gadian A, Salter S. Weakening of hurricane via marine cloud brightening. Atmospheric Science Letters. Wiley Online. 2012; 13: 231- 237.
- Salter SH, Stevenson JTM, Tsaimis A. Engineering ideas for Brighter clouds. Roy. Soc. Chem. Issues in Science and Technology. 2014; 38.
- Project Stormfury.
- Willoughby HE, Jorgensen DP, Black RA, Rosenthal SL. Project STORMFURY, A Scientific Chronicle, 1962-1983, Bull. Amer. Meteor. Soc. 1985; 66: 505-514.
- Whitney LD, Hobgood JS. The relationship between sea-surface temperature and maximum intensities of tropical cyclones in the Eastern North Pacific Ocean. Journal of climate. 1997; 10: 2921-2930.
- Stommel H, Arons AB. On the abyssal circulation of the world ocean - II. An idealized model of the circulation pattern and amplitude in ocean basins. Deep Sea Research. 1953; 6: 217-218.
- US National Weather Service. Warm water depth.
- Schwartz SE, Slingo A. Enhanced shortwave radiative forcing due to anthropogenic aerosols. In Clouds Chemistry and Climate (Crutzen and Ramanathan eds.). 1996: 191-236 Springer Heidelberg.
- Vallina SM, Simo R, Gasso S, de Boyer-Montegut C, del Rio E, Jurado E, et al. Analysis of a potential‘solar radiation dose dimethylsulfide-cloud condensation nuclei’ link from globally mapped seasonal correlations. Global Biochemcial cycles. 2007; 21.
- Bennartz R. Global assessment of marine boundary layer cloud droplet number concentration from satellite. Journal of Geophysical Research. 2007; 112: 12.
- Beard KV. Terminal velocity and shape of cloud precipitation drops aloft. Journal of the Atmospheric Sciences. 1976; 33: 851-864.
- Ahlm L, Jones A, Stjern CW, Muri H, Kravitz B, Kritstjansson JE. Marine cloud brightening - as effective without clouds. Atmos. Chem. Phys. 2017; 17: 13071-13087.
- Remillard J, Kollias P, Luke E, Wood R. Marine boundary layer cloud observations in the Axores. American Meteorological Society. 2012; 25: 7381-7398.
- North_Atlantic_Gyre.png.
- Richardson PL, Reverdin G. Seasonal cycle of velocity in the Atlantic North equatorial countercurrent as measured by surface drifters current meters and ship drifts. J. Geophysical Research. 1987; 92: 3691-3708.
- Anthropogenic and Natural Radiative Forcing.
- Liberty-Ship.
- Slemmings B. Corvette costs.
- The Most Expensive U.S Hurricane Season Ever: By the Numbers. 2017.
- 2015 United Nations Climate Change Conference.
