Abstract
Azimuthal resistivity sounding was carried out at five (5) locations around three abandoned dumpsites at Owerri, Orlu, and Okigwe in Imo State, Southeastern Nigeria. The Schlumberger Electrode Array was employed in the survey. The constant current electrode spacing (a) and potential electrode spacing (b) were rotated about the center of each Azimuthal resistivity sounding station at 45. A secondary data of chemical water analysis of eight (8) water samples and three leachate samples from three (3) dumpsites were collected. The result of the azimuthal study showed that the minimum and maximum coefficient of anisotropy were 1.00 and 1.82, respectively, and a mean value of 1.33. The polygons were spherical, thus indicating that the study area is anisotropic. The movement of the contaminants was aided by the dominant NW-SE and NE-SW fault trend orientations. The spatial map of pH, conductivity and heavy metals concentrations showed probable locations with uncompromised water resources. These locations were in accord with the identified fault trend orientations.
Keywords: Azimuthal resistivity; Sounding; Imo River basin; Potential electrode; Anisotropic polygon
Abbreviations: ARS; E; W; N; S; NW; SE; NE; SW; MPL; SON; WHO; EC; m
Introduction
Studies have shown that although groundwater is covered by several layers of earth, it is often contaminated by pollutants from the earth’s surface as a result of various environmental problems. Groundwater contaminants often emanate from landfills, dumpsites, chemicals from pesticides and insecticides, fertilizers, spills from mineral exploration, etc. [8,18,25]. The channels through which these pollutants travel through the earth’s layers into aquifers include cracks and faults. Most often, the geologic formations overlaying aquifers determine the rate at which contaminants reach the water table, especially during the process of groundwater recharge [4].
    ARS    locations
    Location
    Longitude
    Latitude


    1
    Chybyke Filling Station Aba Road,    Owerri.
    7.0405
    5.46577


    2
    Young Shall Grow Motor Park Egbu    Road, Owerri.
    7.0461
    5.47452


    3
    Township School, Holy Rosary Church,    Orlu.
    7.04193
    5.79193


    4
    Ikpa Nkoto    Dumpsite Ihube Okigwe.
    7.33942
    5.85795


    5
    Ihube-Okigwe, Along Umuahia Express    way.
    7.34113
    5.85608
Table 1: GPS locations of the dumpsites.
Many diseases are transmitted to both plants and animals via bad water. Most often, drinking water is emphasized; thus, many people now drink either sachet or bottled water. Surveys show that some of the bottled and sachet water in public spaces have poor water quality (Ajala, 2020). Moreover, household activities such as cooking and washing are performed using water from wells. Studies have shown that contaminated water when used in washing fruits, vegetables, plates, spoons, and other kitchen utensils can be dangerous to health [11,12,27]. Using contaminated water for irrigation has a danger of disease transmission due to pathogenic microorganisms present in the water [16,21,24].
The current study area is characterized by many active and abandoned open dumpsites, and as such, some of the people’s aquifers are likely to be polluted. The leaching of contaminants into aquifers poses significant threats to groundwater quality. The aquifer protective linings used in modern dumpsites and landfills were not applied at the dumpsites in the study area. These dumpsites were considered the most likely sources of contaminants that usually migrate into the shallow and deeper aquifers of the study area [10]. Thus, there is always a need to monitor people’s aquifers. The use of hydrogeochemical methods for monitoring groundwater quality is more popular but has several drawbacks, such as the high cost of drilling wells, the exorbitant cost of chemical analysis, and low spatial coverage. Other studies for monitoring contaminant flow into groundwater were performed with vertical electrical soundings employing the Schlumberger array, Wenner array, and dipole-dipole array in combination with geochemical analysis of water resources [3,6,20]. Contaminated groundwater tends to be more conductive due to the presence of ions and metals that must have leached into the aquifer. The Anisotropic Resistivity Survey (ARS), which is a special type of vertical electrical sounding, can determine the possible directional channels through which the contaminants often flow into an aquifer. This approach provides valuable information for constructing models that can serve as barriers to the flow of contaminants into aquifers within the vicinities of designated municipal dumpsites. This ARS research report assesses the pathway of contaminant leaching into the aquifer.
Groundwater storage and flows, both vertical and longitudinal, are controlled mainly by the presence of fractures on impermeable solid earth [5,7]. According to large-scale studies, the rapid flow of groundwater through inflated cracks and fissures is known to transfer ephemeral pollutants into groundwater, and management during spring is often hindered by poor knowledge of fault characteristics [7].
A fracture is an ordinary break in the rock, while a fault is a break in the rock where the rocks move relative to each other. These planes, along which stress occurs, cause partial loss of cohesion in the rock [9]. This implies that a fracture can give rise to a fault. Faults can act as barriers to slowing groundwater flow; they can act as conduits for accelerating groundwater flow, or amazingly, they can both slow and speed groundwater up [17].
Azimuthal resistivity sounding can determine the fault orientation in the subsurface of the Earth. Knowledge of the fault orientation describes the possible track path through which contaminants reach an aquifer. In this study, the potential pathways through which pollutants travel from dumpsites to aquifers were mapped.
Location and Geology of the Area
The research focuses on Imo State, situated within the Imo River Basin in Southeastern Nigeria. The Study area lies between longitude 60 38' 30'' - 70 21' 00''and latitude 5014'00'' - 5058' 30'' (Figure 1). Imo State has three major geopolitical regions, and each has at least one urban center that generates both domestic and industrial waste, which is often disposed of in solid waste dumpsite. Waste managers usually collect wastes from sites nearer residential areas and drop them at legally designated locations for incineration during the dry season. These dumpsites can be relocated to another location as can be directed by the government in power. Many abandoned dumpsites are present in the area of study. The dumpsites under study are no longer active.
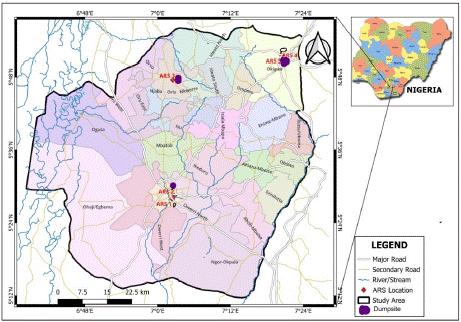
Figure 1: Map of the study area showing the locations of dumpsites, water samples and ARS stations.
The Imo River basin in southeastern Nigeria has a substantial sequence of sedimentary rocks spanning approximately 5480 meters with various geological ages. These rocks indicate a profound history of geological processes shaping the basin over millions of years, and understanding their composition and structure is crucial for applications in hydrogeology, natural resource exploration, and environmental studies. Insights from Uma (1986) provide valuable information on the basin's geological history and potential resources, enhancing our understanding of the region's geology and its implications for both natural and human activities.
Materials and Methods
Principles of the Electrical Resistivity Method
Electrical resistivity is an intrinsic property that reflects how strongly a given material opposes or resists the flow of electric current. Electrical resistivity studies in geophysics may be understood in the context of current flow through a subsurface medium consisting of layers of materials with different individual resistivities (Rhett 2000). The apparent resistivity is given by
Where k is the geometric factor that depends on the type of electrode array employed. A Schlumberger electrode array was used (Fig. 2).

Azimuthal Resistivity Sounding (ARS)
The variation in the electrical properties of a material with a change in direction is known as anisotropy, and incorporating this change into the electrical resistivity gives rise to Azimuthal Resistivity Sounding (ARS). This method is a variation of resistivity measurement that assesses both the magnitude and direction of electrical anisotropy [2]. Moreover, the ARS is used by hydrologists for the identification and characterization of fractured rocks because fractured rock is electrically anisotropic. Azimuthal resistivity surveys are frequently performed to identify the primary direction of electrical anisotropy. Identifying and characterizing fractures in rocks with low porosity is crucial, as the overall porosity and permeability are primarily influenced by the intensity, orientation, connectivity, aperture, and infill of fracture systems [23]. The importance of characterizing rock fractures in groundwater contaminant studies is that fractures serve as a pathway for contaminants from the soil to the groundwater. According to Skyernaa and Jorgensen [23], if apparent resistivities are measured in different directions and are plotted as radii, anisotropy figures are produced. These figures are ellipses in the simple case of parallel fractures, having the long axis parallel to the strike of the fracture.
In carrying out azimuthal resistivity sounding, any of the electrode arrays can be employed to measure the electrical resistance of earth layers, which are usually converted into apparent resistivity using the appropriate geometric factor. The variation in apparent resistivity with respect to the azimuthal position can be used to calculate the relative fracture density and dominant fracture orientation. The maximum observed apparent resistivity is parallel to the direction of the fractures, while the true earth resistivity has a maximum at right angles to the fractures. The apparent resistivity in different directions is plotted as a function of the azimuth in radial coordinates to generate an anisotropy figure. For an isotropic homogeneous formation, this polygon assumes a circular shape. Any deviation from circular to elliptical is indicative of an anisotropic nature [2]. The system is governed by a scaled version of Laplace's equation if the frequency of fracture is sufficiently high at an appropriate scale to render the system homogeneous but anisotropic. The solution of this equation yields the potential, v, at any surface point x, y resulting from the magnitude of the current input (Keller and Frischknecht, 1966).

Where is known as the coefficient of anisotropy
Data Acquisition and Analysis
The ARS data, water samples, and leachate samples were collected from three geographical locations in the study area; Owerri, Orlu, and Okigwe. There were five (5) ARS stations erected at the abandoned old dumpsites. The resistivity data were acquired using an ABEMTM terameter SAS 4000 with a maximum electrode separation of 100 m. A Schlumberger array (Figure 2) was used. The maximum and minimum apparent resistivities were generated using the appropriate geometric factor (Eq. 2). The data generated were presented in Table 2. Furthermore, the coefficient of anisotropy was deduced using Eq. 3. The constant current electrode spacing (a) and potential electrode spacing (b) were rotated about the center of each ARS station, in increments from 300 through 3600. This allows earth's resistivity measurements to be taken in the north, south, northeast, southwest, east, west, southeast and northwest directions. In the azimuthal resistivity, the changes in apparent resistivity values were interpreted as an indication of fracture anisotropy
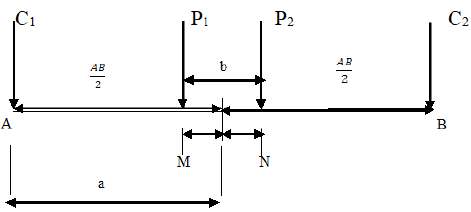
Figure 2: Schlumberger electrode spacing.
The result of physio chemical analysis of water samples and leachate samples were collected from a secondary source [10]. These were used to generate the spatial distribution of Ph, conductivity, and heavy metal concentrations The spatial distribution of Ph, conductivity, and heavy metal concentrations were estimated using ordinary kriging described by Equation 4. This is as a result of the nature of the available data. The concentration data are randomly distributed without any discernible global trend.

Where , represents the estimated value of the chemical parameters at each the location,
N denotes the number of known data points used in the interpolation
is the kriging weight assigned to each known data point.
is the known value at each location.
With the help of arcgis software the spatial maps of Ph, conductivity, and heavy metal concentrations generated.
Results and Discussion
Azimuthal Resistivity Results
The coefficient of anisotropy (λ) is a measure of the difference in conductivity between different directions within the study area. It ranged between 1.01 and 1.82, with a mean value of 1.33 (Table 2). The higher the coefficient of anisotropy is the higher the permeability and the higher the hydraulic conductivity. Invariably, the rate at which contaminants permeate into the water resources will be high. There are some degrees of anisotropy in the groundwater flows.
    N-S
    E-W
    NW-SE
    NE-SW


    ST.
    a(m)
    b(m)
    K(m)
    R(Ω)
    ρ(Ωm)
    R(Ω)
    ρ(Ωm)
    R(Ω)
    ρ(Ωm)
    R(Ω)
    ρ(Ωm)
    ρmax(Ωm)
    ρmin(Ωm)
    λ


    1
    5
    2.5
    11.78
    52.29
    615.98
    70.13
    826.13
    65.16
    767.59
    58.9
    693.61
    826
    616
    1.16


    10
    2.5
    58.91
    13.98
    823.56
    15.70
    924.89
    16.82
    990.87
    16.3
    960.82
    995
    824
    1.10


    15
    2.5
    137.45
    7.31
    1004.35
    9.19
    1263.4
    10.09
    1386.87
    8.83
    1213.27
    1387
    1004
    1.18


    20
    2.5
    247.4
    5.61
    13888.9
    6.66
    1647.2
    6.709
    1659.81
    6.19
    1531.90
    1660
    1389
    1.09


    25
    2.5
    388.77
    4.39
    1705.92
    5.01
    1946.2
    4.996
    1942.3
    4.63
    1800.39
    1942
    1800
    1.04


    2
    5
    2.5
    11.78
    37.03
    436.21
    34.69
    408.65
    61.14
    720.23
    35.9
    423.37
    720
    409
    1.33


    10
    2.5
    58.91
    7.48
    440.65
    7.15
    421.21
    7.56
    445.36
    6.89
    405.89
    445
    406
    1.05


    15
    2.5
    137.45
    3.76
    516.81
    3.76
    516.81
    2.85
    391.73
    3.24
    445.34
    517
    392
    1.15


    20
    2.5
    247.40
    2.35
    581.39
    2.37
    586.34
    1.82
    450.27
    2.11
    522.01
    586
    450
    1,14


    3
    5
    2.5
    11.78
    311
    3663.58
    174
    2049.7
    226
    2662.28
    67.7
    797.86
    3664
    2050
    1.34


    10
    2.5
    58.90
    1740
    102503
    1020
    60088
    1650
    97201.5
    544
    32035.3
    102503
    32135
    1.79


    15
    2.5
    137.45
    634.1
    87159.8
    517.2
    71089
    534.4
    73453.3
    412
    56670.7
    87160
    56671
    1.24


    20
    2.5
    247.40
    312.4
    77295.2
    304.3
    75276
    264.1
    65338.3
    315
    77980.5
    77981
    65338
    1.09


    4
    10
    5.0
    23.56
    16.8
    395.81
    28.9
    680.88
    14.4
    339.26
    29.4
    692.66
    692.66
    681
    1.01


    20
    5.0
    117.81
    4.13
    486.56
    3.47
    408.80
    4.14
    487.73
    5.81
    684.48
    685
    408
    1.30


    30
    5.0
    274.89
    3.89
    1069.32
    1.58
    454.33
    1.28
    351.86
    3.47
    953.87
    1069
    351.9
    1.74


    40
    5.0
    494.80
    1.75
    865.9
    0.87
    430.48
    0.62
    306.78
    0.94
    465.11
    864
    307
    1.68


    5
    10
    5.0
    23.56
    4.4
    103
    10.6
    249
    14.5
    342
    601
    141.6
    342
    103
    1.82


    20
    5.0
    117.81
    30.00
    3534.30
    21.8
    2568.3
    27.9
    3286.90
    15.20
    1790.71
    3534
    1790
    1.41


    30
    5.0
    274.89
    12.10
    3326,17
    10.2
    2803.9
    11.9
    3271.19
    6.20
    1704.32
    3326
    1704
    1.40


    40
    5.0
    494.80
    8.74
    4324.55
    5.08
    2513.6
    4.9
    2424.52
    3.00
    1484.40
    4325
    1484
    1.71
Table 2: The Azimuthal resistivity.
The flow of contaminants is relatively uniform in all directions, with only slight directional variations in the flow paths. This suggests that the movement of contaminants through the subsurface significantly affects preferential pathways or barriers and that the overall flow behavior is nearly isotropic in all directions. There is the presence of a preferential flow path. The radial plot of resistivity as a function of electrode spacing gives rise to the polygons below. The anisotropic polygons indicate the directions of the fracture orientations. At ARS station one, the topsoil at a depth of 3.3 m shows a bimodal anisotropic peak (Figure 3a), and the major fault orientation is trending in the E-W direction. At depths of 6.6 m, 10 m and 13.3 m, the major fault trends are in the NW-SE and NE-SW directions. The direction of the fault is predominantly NW-SE,which is in agreement with the faulting associated with the Middle Albian tectonic phase that produced the Abakiliki-Benue rift. At ARS Station 2, in Owerri, southwest of the Aba Road dumpsite, the anisotropic polygon (Figure 3b) exhibited a unimodal peak in the NW-SE direction at a depth of 3.3 m. Deeper than 13.2 m, the fracture orientation occurs in two directions, NW-SE and N-S. At this depth, the fault orientations are bimodal in the N-S and NE-SW directions. In general, the anisotropic polygon (Figure 3c) shows consistent N-S dominant trending fracture anisotropy at station three (3), which is in Orlu within the Ameki Formation which is. At ARS Stations 4 and 5 at the Ikpa Nkoto dumpsite in Okigwe, the anisotropic polygons (Figure 3d & 3e) show a N-S trend at a depth of 26.4 m.

Figure 3a: The anisotropic polygon from ARS Station 1.

Figure 3b: Anisotropic polygon from ARS Station 2.

Figure 3c: Anisotropic polygon from ARS Station 3.

Figure 3d: Anisotropic polygon from ARS Station 4.

Figure 3e: Anisotropic polygon from ARS Station 5.
Table 3 The pH, electrical conductivity and heavy metal concentrations in the samples [1].
    Samples
    Longitude
    Latitude
    pH
    𝜎 ( S/cm)
    Fe conc.    mg/L
    Cu Conc.    (mg/L
    Pb    Conc.(mg/L)


    BHW 1
    7.4633
    5.9514
    7.39
    81
    0.12
    0.10
    0.06


    BHW 2
    7.0464
    5.4747
    6.92
    40
    0.18
    0.06
    0.08


    SW 1
    7.0418
    5.4716
    7.22
    3.0
    0.11
    0.13
    0.12


    SW 2
    7.0414
    5.4715
    7.50
    79
    0.05
    0.17
    0.46


    SW 3
    7.0364
    5.4681
    7.14
    39
    2.20
    0.08
    0.02


    BHW 3
    7.0418
    5.7983
    6.70
    42
    1.12
    0.20
    0.00


    SW 4
    7.0446
    5.8002
    6.65
    55
    0.26
    0.18
    0.14


    BHW 4
    7.0436
    5.7975
    6.62
    48
    0.12
    0.10
    0.06


    SW 5
    7.3360
    5.8476
    6.57
    56
    0.23
    0.13
    0.00


    BHW 5
    7.3429
    5.8643
    6.66
    37
    0.33
    0.04
    0.00


    SW 6
    7.3371
    5.8476
    6.91
    10
    0.18
    0.16
    0.00


    BHW 6
    7.0177
    5.4604
    6.10
    70
    0.55
    0.20
    0.15


    BHW 7
    7.0441
    5.4756
    5.90
    68
    0.40
    0.05
    0.13


    BHW 8
    7.0360
    5.4546
    6.10
    149
    0.31
    0.05
    0.03


    BHW 9
    7.0447
    5.4680
    6.30
    219
    0.19
    0.00
    0.00


    BHW 10
    7.0443
    5.4689
    5.20
    40
    0.20
    0.08
    0.01


    LS 1
    7.0431
    5.7986
    4.20
    133
    2.14
    1.62
    0.34


    LS 2
    7.0446
    5.8003
    4.70
    192
    2.16
    1.02
    0.16


    LS 3
    7.0383
    5.8578
    5.10
    156
    3.41
    1.80
    0.48


    LS 4
    7.0415
    5.4681
    6.40
    4315
    32.5
    4.00
    5.24


    WHO MPL


    6.5-8.5


    2.00
    0.015
Table 3: The pH, electrical conductivity and heavy metal concentrations in the samples [10].
Where MPL is the maximum permissible limit, BHW is the borehole water, and LS is the leachate sample.
Spatial Mapping of pH, Conductivity and Heavy Metal Concentration
The Maximum Permissible Limit (MPL) of the pH value in drinking water by the World Health Organization (WHO) and the Standards Organization of Nigeria (SON) is 6.5-8.5.
The spatial map of the pH concentration (Figure 4) shows that three quarters of Imo state, Imo River Basin were identified as locations with low PH concentration value. The northwestern, north central and southeastern parts of area studied were delineated as having water resources with low PH concentration value. This probably is supported by the identified NW-SE fault trend orientation. The spatial map serves as a guide for prospecting of portable water in the study area.
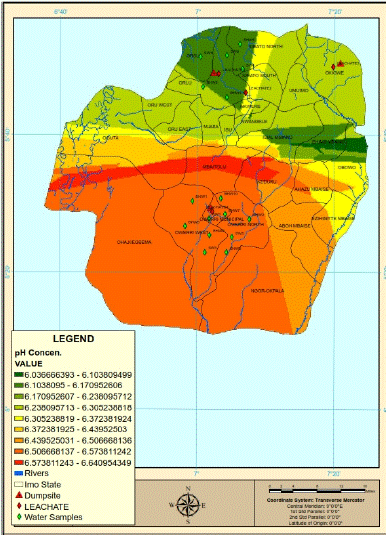
Figure 4: Spatial distribution of pH concentration in the study area.
The MPL of Electrical Conductivity (EC) for drinking water is 100 and 250 μS/cm for SON and the WHO, respectively. The spatial variation in the electrical conductivity of water and leachate in the study area (Figure 5) indicated three divisions of electrical conductivity; low, moderate and high electrical conductivity levels. Three quarters (75%) of the study area were identified as locations with moderate to high electrical conductivity values. Locations with water resources characterize with high electrical conductivity are likely to have aquifers contaminated with metal.
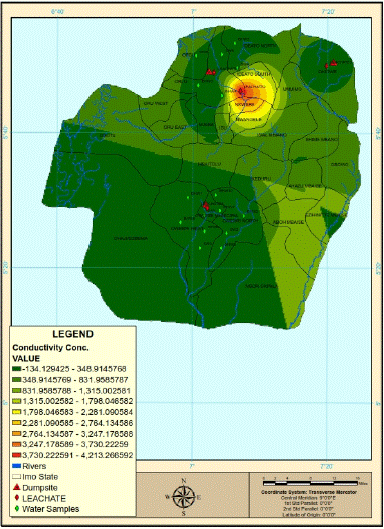
Figure 5: The spatial variation in electrical conductivity in the study area.
A spatial map (Figure 6) showed the distribution of iron concentrations in the groundwater of Imo state, Imo River Basin. There is a relatively high concentration of iron in the water resources around the Ideato area in the northern part of the area studied.
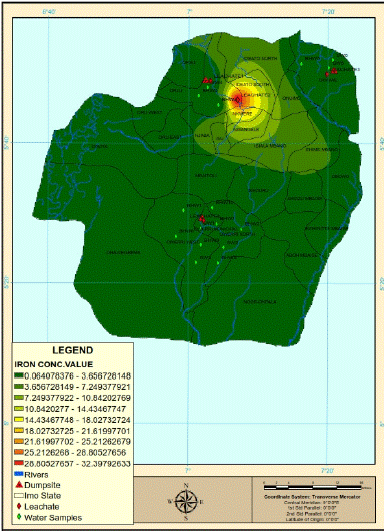
Figure 6: The spatial variation in iron concentration in the study area.
The spatial variation of copper concentration in the water resources of the area (Figure 7) showed that almost 50% of the study area is likely to have aquifer containing water with iron concentrations above the permissible limits of the WHO and SON. This will adversely affect public health to a large extent considering the expanse of land involved. These locations are mostly urban settlements with dense population.
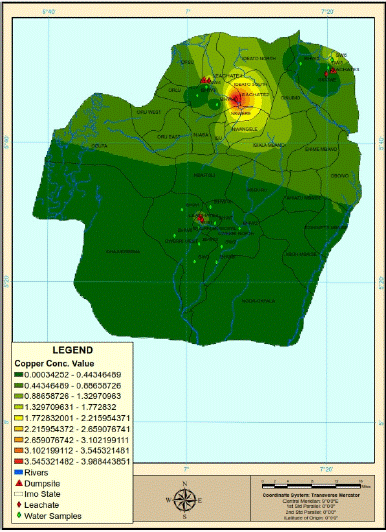
Figure 7: The spatial variation in the copper concentration in the study area.
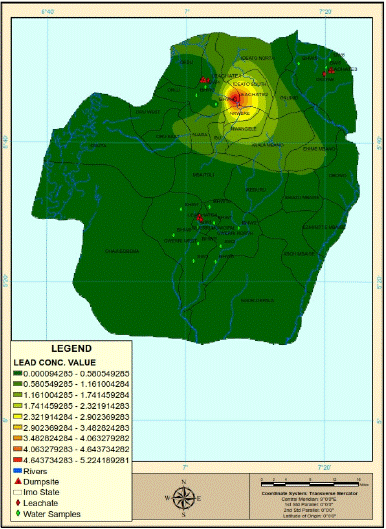
Figure 8: The spatial variation in lead concentration in the study area.
Conclusion
This study utilized Azimuthal Resistivity Sounding (ARS) and hydrogeochemical data to thoroughly investigate groundwater contamination around three abandoned dumpsites in Owerri, Orlu, and Okigwe, Imo State, Southeastern Nigeria. The Schlumberger Electrode Array was effectively employed to measure the anisotropic properties of the subsurface, revealing the dominant fault trend orientations that play a critical role in facilitating contaminant movement. The results showed that the coefficient of anisotropy in the area studied varied from 1.00 to 1.82, clearly indicating differing levels of subsurface anisotropy at the research sites. The spatial distribution of pH, electrical conductivity, and heavy metal concentrations provided unarguable insight into the potential pathways and extent of contamination.
The findings clearly highlighted the important role of the NW-SE and NE-SW fault trends in contaminant migration, decisively suggesting that these geological structures act as conduits for pollutants from the dumpsites into the aquifers. The movement of contaminants from the Earth’s surface to the aquifer was orchestrated by the dominant NW-SE and NE-SW fault trend orientations, as shown by the anisotropic polygons. The spatial maps of water quality parameters identified several locations where water resources remain uncompromised, emphasizing the urgent need for targeted monitoring and protection of these areas. Moreover, the study underscores the importance of understanding subsurface anisotropy in groundwater contamination studies, which can aid in developing more effective management and remediation strategies.
The integration of ARS and geospatial distribution of pH, electrical conductivity, and heavy metal concentrations in this research offers a comprehensive approach to assessing and mitigating groundwater contamination. This methodology can serve as a model for similar environmental studies in other regions. The results undoubtedly call for immediate attention from ecological and public health authorities to address the contamination issues identified and to implement measures to safeguard water resources and public health in the affected areas. One of the measures includes constructing models considering the identified dorminant fault trends; NW-SE and NE-SW to serve as barriers to the flow of contaminants into aquifers.
Author Statements
Funding Declaration
There was No fund received by the author for the research.
Competing Interest Declaration
There was no competing interest amongst the authors.
References
- Abam TKS, Nwankwoala HO. Hydrogeology of Eastern NigerDelta: A Review. Journal of Water Resourses and Protection. 2020; 12: 9.
- Abdullahi H, Hussaini SA, Sule AI. An overview of electrical anisotropy in shaly sanstones. Journal of Engineering. 2012; 92: 1-11.
- Adepelumi AA, Ako BD, Ajayi TR. Groundwater contamination in the basement complex of IleIfe, Southwestern Nigeria: A case study using electrical resistivity geophysical method. Hydrology Journal. 2001; 9: 611-622.
- Adiat KAN, Adegoroye AA, Adebiyi AD, Akeredolu BE, Akinlalu AA. Comparative assessement of aquifer susceptibility to contaminants from dumpsites in different geological locations. Heliyon. 2019; 5: E01499.
- Banks D, Karnachuk OV, Parnachev VP, Holden W, Frengstad B. Groundwater contamination from rural pit latrines; examples from Siberia and Kosova. Journal of Chattered Institute of water environmental management. 2002; 16: 147-152.
- Bernado B, Rocha F. Integration of electrical resistivity and modified DRASTIC model to assess groundwater vulnerability in surrounding areas of Hulene-Bwaste dump, Maputo, Mozambique. Water. 2022: 14: 1746.
- Bucher K, Stober I. Fluids in the upper continental crust. Geofluids. 2010; 10: 241-253.
- Chen X, Zeng XC, Kawa YK, Wu W, Zhu X, Ullah Z, et al. Microbial reactions and environmental factors affecting the dissolution and release of arsenic in the severally contaminated soil under anaerobic or aerobic conditions. Ecotoxicological environment Safety. 2020; 189: 109946.
- Cook PG. A guide to regional groundwater flow in fractured rock aquifers. CSIRO, Land and Water, Glen. 2003: 108.
- Ejiogu BC, Opara AI, Nwofor OK, Nwosu EI. Geochemical and Bacteriological Analyses of Water Resources Prone to Contamination from Solid Waste Dumpsites in Imo State, Southeastern Nigeria Journal of Environmental Science and Technology. 2017; 10: 325-343.
- Ghosh MM, Rangaran R, Kamala CT. Assessement of Groundwater Quality in multilayered aquifer system of the Southern Indian region. Environmental mornitoring Assessement. 2012; 184: 6873-6893.
- Gil HW, Kim SY, Park JH. Acute pesticide poisoning in Korea: Findings from National Data. Journal of Korean Medical Science. 2014; 29: 1540-1547.
- Ghosh AK, Bhatt MA, Agrawal HP. Effect of long-term application of treated sewage water on heavy metal accumulation in vegetables grown in Northern India. Environmental monitoring assessment. 2012; 184: 1025–1036.
- Gil AI, Lanata CF, Hartinger SM, Mäusezahl D, Padilla B, Ochoa TJ, et al. Fecal contamination of food, water, hands, and kitchen utensils at the household level in rural areas of Peru. Journal of Environmental Health. 2014; 76: 102-106.
- Keegan-Treloar R, Irvine DJ, Solórzano-Rivas SC, Werner AD, Banks EW, Currell MJ. Fault-controlled springs: A review. Earth-Science Reviews. 2022; 230: 104058.
- Markland SM, Ingram D, Kniel KE, Sharma M. Water for Agriculture: The convergence of sustainability and safety. Microbiological spectrum. 2017: 5.
- Mundy E. Just in case you weren’t sure…groundwater flow around a fault zone is complex. Blogs of the European Geosciences Union. 2016.
- Nawab J, Din Z, Ahmad R, Khan S, Zafar MI, Faisal, et al. Occurrence, distribution and pollution indices of potential toxic elements within the bed sediments of riverine system in Pakistan. Environmental pollution research. 2021; 28: 54986-55002.
- Samgu S, Abdulahi M. Assessement of leachate pollution potential of groundwater in Suleja landfill, Niger State, Nigeria. Nigerian Journal of Basic and Applied Science. 2016; 3: 67-76.
- Samgyu P, Myeong-Jong V, Jung-HO K, Seung WS. Electrical geophysical imaging (ERI) monitoring for groundwater contamination in an uncontrolled landfill South Korea. Journal of Applied Geophysics. 2016; 135: 1-7.
- Sanna A, Meloni B, Ruggeri A, Succa S, Sanna C, Carraro V, et al Microbiological quality of water used in agriculture in Sardinia. Ann Ig. 2016; 28: 58-170.
- Singal BBS, Gupta RP. Applied Hyrogeology of Fractured Rocks (2nd ed.) Springer. 2020.
- Skyernaa L, Jorgensen NO. Detection of local fracture systems by azimuthal resistivity surveys: example from south Norway: Memoirs of the 24th congress of International Association of Hydrogeologists. 1993: 662-671.
- Steelwe M, Odumeru J. Irrigation water as a source of food borne pathogens on fruit and vegetables. Journal of Food Protection. 2004; 67: 2839-2849.
- Talabi AO, Kayode TJ. Groundwater pollution and remediation. Journal of Water Resource and Protection. 2019; 11: 1.
- Panagiotakis I, Dermatas D. Soil and Groundwater Contamination and Remediation. Bulletine of Environmental Contamination and Toxicology. 2017; 98: 297–298.
- Ullah H, Kham I. Impact of sewage contaminated water on soil, vegetables, and underground water of peri-urban Peshawar, Pakistan. 2011; 184: 6411-6421.
- Uma KO. Geology of Southeastern Nigeria. Wiley. 1986.
- Weather and Climate. (n.d.). Imo climate zone, monthly weather averages and historical data. 2024.
