
Research Article
Austin J Environ Toxicol. 2016; 2(2): 1015.
Principal Component Analysis of the Chemical Radicals in the Water from Hand-Dug Wells in Akure Metropolis, South West Nigeria
Idowu AA¹*, Nnamdi ASO², Godknows IM³ and Akinyomi OK²
¹Department of Chemistry, Federal University of Agriculture, Nigeria
²Department of Statistic, Federal University of Agriculture, Nigeria
3Department of Statistic, University of Ibadan, Nigeria
*Corresponding author: Adeogun Abideen Idowu, Department of Chemistry, Federal University of Agriculture, Abeokuta, Nigeria
Received: August 27, 2016; Accepted: November 08, 2016; Published: November 10, 2016
Abstract
This study assessed the chemical radicals water in hand dug wells in Akure metropolis, Ondo State Southwest Nigeria. Forty hand dug wells were sampled within the metropolis, using standard laboratory techniques, the water samples were analyzed for chemical radical parameters such as; calcium, magnesium, sodium potassium, iron, lead, silicate, phosphate, sulphate, bicarbonate, chloride, nitrite and nitrates. The resulting data were subjected to Principal Component Analysis (PCA) and Cluster Analysis. The first principal components only accounts for about 34% of the variation in the data and four components were needed to account for 67% of the variation. Also worthy of note is the fact that these first four components have eigenvalues substantially larger than the last nine components. A biplot of the first few principal components revealed the data structure as falling into three groups. To visualize this cluster group, the hierarchical cluster approach was adopted using the average linkage. The results of the analysis have helped in the optimization of the parameters that led to the levels of the radicals in the samples.
Keywords: Chemical radicals; Hand dug wells; Correlation; Principal components analysis; Eigenvalues
Introduction
Accessibility and quality of water supply, as well as quality of sanitation facilities available to households or communities is an important factor in determining the quality of life of the people and the potential for poverty alleviation [1-3]. Large areas of urban environment in Nigeria do not have network connections; the public water supply system itself is riddled with so many leakages that affect water quality. Consequently, urban water supplies in Nigeria are supplemented with alternative sources and this in most cases is by way of commercialization. Alternative source of water supply commonly found in Nigeria includes the hand dug wells. It is common beliefs that water from hand dug wells are not safe for human consumption due to their poor water quality.
Water quality refers to the chemical, physical and biological characteristics of water and is a measure of the condition of water relative to the requirements of one or more biotic species and or to any human need or purpose [4,5]. Water quality is most frequently used by reference to a set of standards against which compliance can be assessed and it determines the goodness of water for particular purposes [6]. The most common standards used to assess water quality relates to health of ecosystems, safety of human contact and drinking water [6]. The measurement of chemical variables in the water promotes a better understanding of the aquatic environment. Although, these variables produce large set of data which are often difficult to interpret [7-9].
Data interpretation of multidimensional measurements can be approached by the application of chemometric methods such as Principal Component Analysis (PCA) [7,10-16]. PCA is a powerful statistical tool for compressing data and extraction of information. It can reduce the dimensionality of a data set consisting of a large number of interrelated variables, while retaining the variability present in a data set as much as possible. This reduction is achieved by transforming the data set into a new set of variables, the Principal Components (PCs), which are orthogonal (non-correlated) and arranged in decreasing order of importance. However, it is well known that PCA, like any other multivariate statistical method, is sensitive to outliers, missing data and poor linear correlation between variables due to their poor distribution. As a result, data transformations have a large impact on PCA. In this regard one of the most powerful approaches to improve PCA appears to be Robust Principal Component Analysis (RPCA), which diminishes the influence of outliers [7,17-18].
In this study robust principal component analysis and cluster analysis approach were applied to the chemical radicals parameters of water from hand dug well in Akure. The results are discussed based on the role of water quality as a pollution indicator and to identify the contribution of natural and anthropogenic factors to water quality variations in temporal and spatial patterns.
Materials and Methods
Study area
This study dwells on the statistical analysis of the chemical components of the water in the hand-dug wells in Akure Township. This town lies between the longitude 5.01° E and 5.63° E and latitude 7-01° N and 7.63° N. it is the Capital of Ondo State in Southwestern Nigeria (Figure 1). The local geology of Akure Township has earlier been described [19-24].
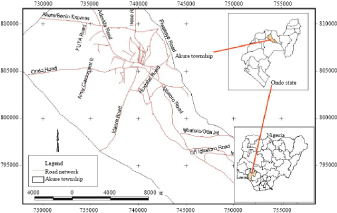
Figure 1: Study area (Source: Ayeni 2011 [24]).
Sample collection and chemical analysis
Water samples were collected from forty different hand dug wells in various locations in Akure metropolis. Samples were collected in 2 L treated polythene containers, previously rinsed thrice with the water sample to be collected at the sampling sites. Water from various sampling points were analysed for the presence of cations and anions, using standard laboratory procedures [25]. The cations include Calcium (Ca2+), Magnesium (Mg+), Sodium (Na+), Potassium (K+) and Iron (Fe), Lead (Pb). The anions are Silicates (SiO22-),Phosphates (PO43-), Sulfates (SO42-), Bicarbonates (HCO3-), Chlorides (Cl-), Nitrites (NO2-) and Nitrates (NO3-). The reagents used in the process of chemical analysis are analar grade and they include; Nitric acid (Riedel-deHaen, Germany), Hydrochloric acid (Sigma- Aldrich, Germany), Hydrogen peroxide (British Drug House (BDH) Chemicals Ltd, Poole, England), Sodium hydroxide pellets (Merck, Darmstadt, Germany). Reagents were prepared using doubly distilled water, all glass wares used (Erlenmeyer flask, conical flask, beakers, measuring cylinder, volumetric flask and watch glass) were washed with liquid detergent and rinsed thrice with distilled water followed by oven drying. Polyethylene sample bottles and Teflon beakers were washed with liquid detergent and rinsed with distilled water prior to sample collection.
Statistical analysis
The use any of the multivariate statistical techniques depends on the data and expected output based on the objectives of the study. Since the majority of residents use well water in Akure metropolis, investigation of the variables that control their quality variation is important. The descriptive statistics of the chemical radicals were examined first to verify the quality of the data. Orthogonal principal components (eigenvectors) which explain most of the data variation in a new coordinate system is searched, each of which is a linear combination of the original variables and describes a different source of variation.
PCi=w1x1+w2x2+w3x3+…+wnxn
Where xi and wi are the original variable and the component weight, respectively. The principal component weights are used as measures of the correlation between the variables and the principal components. Factor Analysis (FA) can be expressed as a linear combination of latent common factors and a single specific factor:
Where Fj and ei are the common and specific (error) factors, respectively, aij and βi are their factor loadings. FA separates a correlation matrix into two matrices: a common factor matrix and a specific factor matrix. The cluster analysis was carried out to simplify the similitude of the relationships between any of the samples and the entire data set using hierarchical agglomerative clustering and illustrated by a dendrogram. Multivariate computation was by processing the original data matrix in the MS Excel 2000. Its rows were constructed from the parameters analysed in the water. The principal component analysis, factor analysis, cluster analysis and other statistical calculations were performed by the R software package for Statistic (version 10) for Windows was used for statistical analysis.
Results and Discussion
Chemistry of the well water from Akure metropolis
Concentrations of the chemical radicals from the hand-dug well in Akure metropolis and some statistical evaluations (means and variance) are presented in (Tables 1 and 2) below. From (Table 2) below, the water in Akure metropolis may be classified as ranging from soft or moderately hard water, given the concentration range (2 to 76 mg/L) of the Ca2+ and (0.49 to 84 mg/L) Mg+ in the water sample. Calcium, Sodium, Potassium and Magnesium ions are below the desirable level recommended by WHO. The bicarbonate content ranges from 9.8 to 488 mg/L with average values 101.1 mg/L. The concentrations of sulphate are below detection level in some locations and are as high as 1.06 mg/L in others. Chloride content widely varied with mean value of 86.35 mg/L, it is worth noting that chloride level in most samples are below the recommended level of 200 mg/L. Locations where chloride is above desirable really demonstrated an altered water quality. Although nitrate and nitrite are not listed as major ions in water, their concentrations range between 0.01 and 0.45 mg/L, less than 10 mg/L recommended. When nitrate is present in high concentration in underground water, it is an indication of contamination by leachate from wastewater. Sulphate, phosphate and silicate are present at concentration below the recommendation level. These results are in agreement with previous studies [26-28]. The low level of mineral elements in the hand-dug well water in Akure is of high health implication. The low mineral level in the water makes them to become poorly organoleptic and less thirst-quenching [29]. Low-mineral water consumption increased diuresis and alters the sodium and potassium concentrations in the serum and also increased the elimination of sodium, potassium, chloride, calcium and magnesium ions from the body (Tables 1 and 2).
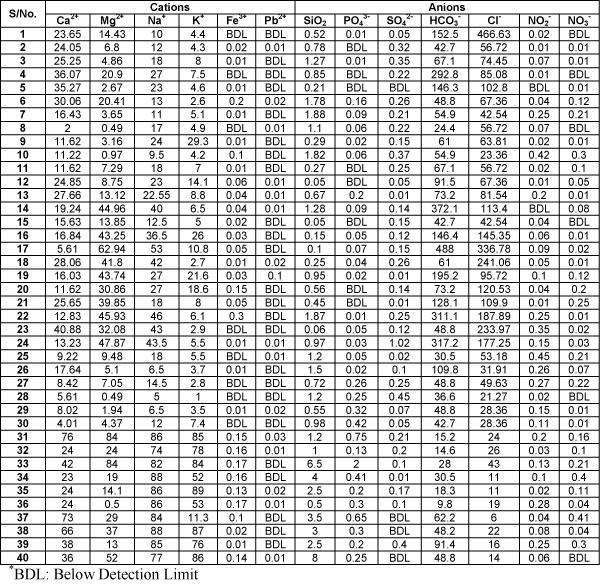
table 1: Water quality parameters of hand-dug wells in Akure, Ondo State.
    Chemical    Parameters
    Mean
    Variance
    SD
    Min
    Max


    Ca2+
    24.11
    2.97
    17.45
    2
    76


    Mg2+
    23.49
    5.022
    22.43
    0.49
    84


    Na+

    37.88
    8.519
    29.42
    5
    88


    K+
    23.59
    9.141
    30.13
    1
    89


    Fe3+
    0.06
    0.591
    0.07
    0.01
    0.3


    Pb2+
    0.01
    0.005
    0.02
    0.01
    0.1


    SiO2-
    1.43
    2.743
    1.65
    0.05
    8


    PO43-
    0.19
    0.012
    0.34
    0.01
    2


    SO42-
    0.17
    0.036
    0.18
    0.01
    1.02


    HCO3-
    101.13
    118.52
    108.65
    9.8
    488


    Cl-
    86.35
    9.031
    94.8
    6
    466.63


    NO2-
    0.12
    0.145
    0.12
    0.01
    0.45


    NO3-
    0.1
    0.013
    0.12
    0
    0.41
Table 2: Descriptive statistics of the radical species in the hand-dug water.
Correlations
The nature of the interdependence of the chemical radicals was also investigated using the correlation matrix. Based on Pearson’s product moment correlation coefficient (Table 3) was constructions from the analytical data. According to the Schwarz inequality, the sample correlation (r) always assumes values between -1 and +1. From the Table, it can be inferred that there is significant correlations between the cations and NO3-, SiO2, and PO43-, except Pb2+ which showed a positive correlation with NO2-. All positive correlated samples are directly related. (Figure 2) is the multivariate scatter plots showing that the points of these chemical radicals are scattered close to straight lines. However no clear relationship is evident between cations and anions. Negative correlations usually indicate that the points are scattered around a straight line having a negative slope (Table 3) (Figure 2).
    Chemical Parameters
    Ca2+
    Mg2+
    Na+
    K+
    Fe3+
    Pb2+
    SiO2-
    PO43-
    SO42-
    HCO3-
    Cl-
    NO2-
    NO3-


    Ca2+
    1


    Mg2+
    0.443
    1


    Na+
    0.622
    0.522
    1


    K+
    0.51
    0.41
    0.839
    1


    Fe3+
    0.354
    0.413
    0.595
    0.545
    1


    Pb2+
    0.037
    0.119
    -0.03
    0.026
    -0.018
    1


    SiO2-
    0.371
    0.36
    0.549
    0.6
    0.471
    -0.085
    1


    PO43-
    0.423
    0.476
    0.484
    0.502
    0.35
    -0.023
    0.608
    1


    SO42-
    -0.222
    -0.001
    -0.104
    -0.158
    -0.151
    -0.16
    -0.143
    -0.147
    1


    HCO3-
    -0.191
    0.373
    -0.06
    -0.297
    -0.071
    -0.001
    -0.203
    -0.268
    0.215
    1


    Cl-
    -0.15
    0.267
    -0.185
    -0.359
    -0.181
    -0.04
    -0.354
    -0.277
    0.063
    0.561
    1


    NO2-

    -0.074
    -0.083
    0.003
    -0.044
    0.029
    0.043
    0.028
    0.067
    0.091
    -0.14
    -0.099
    1


    NO3-
    0.257
    0.075
    0.322
    0.203
    0.231
    -0.106
    0.345
    0.331
    -0.092
    -0.228
    -0.344
    0.286
    1
Table 3: The correlation matrix of water quality parameters of the hand dug well in Akure.
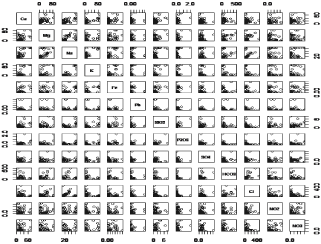
    Figure 2: Pair-wise matrix scatter plots of chemical radicals hand-dug wells
in Akure.
Principal components analysis
Principal component analysis is aimed at removing data noise by dimensionality reduction of the data [30]. Using the correlation data, the initial factor solution were extracted by the multivariate principal component. Principal components were selected from the initial values according to their eigenvalues and scree diagram. Orthogonal rotation of the selected initial components to terminal factor using Kaiser’s Varimax schemes [31] and eigenvalue one criterion was used to determine the numbers of PCs based on the assumption that only eigenvalues greater than one were considered important and the higher eigenvalues are more significant. Varimax normalization was then applied as the rotation method in the analysis on the PCs for better interpretation of results. Varimax factor loadings of 75% were considered strong, although the terms ‘strong’, ‘moderate’ and ‘weak’ as applied to loadings, refer to absolute loading values of >0.75, 0.5- 0.75 and 0.30-0.50, respectively. A scree plot shows the eigenvalues sorted from large to small as a function of the principal components number (Figure 3).
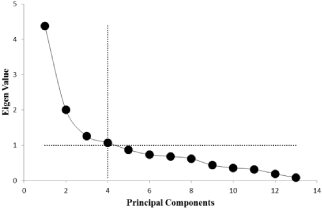
Figure 3: Screeplot of principal components.
Scree plot (Figure 3) and Eigenvalues accounts (Table 4) showed that the first four PC is the most significant components which represent 673% of the variance in chemical radicals in hand dug well in Akure metropolis. PC1 33.64%, PC2, 15.41%, PC3 9.68% and PC4 8.26% constituted (Table 4).
    Components
    Eigenvalue
    Total Variance (%)
    Total Cumulative


    PC1
    4.374
    33.64
    33.64


    PC2
    2.0032
    15.41
    49.05


    PC3
    1.2588
    9.68
    58.74


    PC4
    1.074
    8.26
    67


    PC5
    0.8709
    6.7
    73.7


    PC6
    0.7337
    5.64
    79.34


    PC7
    0.6843
    5.26
    84.6


    PC8
    0.62
    4.77
    89.37


    PC9
    0.4354
    3.35
    92.72


    PC10
    0.3586
    2.76
    95.48


    PC11
    0.3159
    2.43
    97.91


    PC12
    0.1927
    1.48
    99.39


    PC13
    0.0789
    0.61
    100
Table 4: Eigen values of the correlation matrix of the chemical radicals.
The PC loadings represent the correlation of the variable with an axis and loadings of the retained PCs were presented in (Table 5). The first PC accounting for 33.64% of the total variance can be called the salt component because it is mainly saturated with cations specifically representing the aquifer effect of the ground water. The second PC which is just 15.41% is associated with magnesium, chloride and bicarbonate with negative loading of nitrite and nitrate. This signifies different sources of the underground water within the city. PC3 which represents 9.68% reflects high loading of sulphate with negative loading of potassium indicating a reciprocal relationship. PC4 represents Pb+ and nitrite loading. The nitrite concentrations are very low, often around their detection limits. This principal component characterizes the traces of inorganic nitrogen. High loading of lead indicates washing of the runoff surface water into the well water (Table 5).
    Chemical Parameters
    PC1
    PC2
    PC3
    PC4


    Ca2+
    0.331
    0.1019
    -0.1651
    0.0017


    Mg2+
    0.2581
    0.5052
    0.0727
    0.1863


    Na+
    0.4088
    0.1593
    0.0489
    -0.0481


    K+
    0.4064
    0.0202
    -0.9958
    -0.1318


    Fe3+
    0.3267
    0.1132
    0.0421
    -0.0042


    Pb2+
    -0.3463
    0.0425
    -0.4817
    0.6702


    SiO2-
    0.3693
    -0.041
    0.1017
    -0.1023


    PO43-
    0.3527
    -0.018
    0.0697
    0.0494


    SO42-
    -0.1175
    0.0937
    0.5777
    -0.1414


    HCO3-
    -0.1463
    0.5525
    0.2048
    0.095


    Cl-
    -0.1952
    0.506
    0.0504
    0.103


    NO2-
    0.2184
    -0.2383
    0.454
    0.6279


    NO3-
    0.2241
    -0.2552
    0.3491
    0.2229
Table 5:  Principle component loading of the chemical radicals in the hand dug
well in Akure.
Cluster analysis of the chemical radicals
A Bi-plot plot of the principal components in (Figure 4) demonstrates three clusters I, II and III. Cluster I gathers the samples which are typical by the high concentrations of nitrate and the high content of inorganic salts. The clusters II and III differ mainly in the concentrations of inorganic salts. These clusters can be allocated to the three parts in which the ground water in Akure can be classified. Water in the part I is coming from two ground water sources. The part II is supplied with the surface and ground water and while the part III is likely from shallow water of a surface reservoir. The overlapping of the three groups prevented their 2 dimensional presentations. For effective sorting (Figure 4), Ward’s clustering methods dendrogram was used to satisfactorily organized clusters I to III (Figure 5). It is obvious from these results, that the samples belonging to the cluster I and II are typical by their higher concentrations of bicarbonate. On the other hand, the samples from cluster III possess the higher amount of inorganic salts as earlier presented (Figure 5).
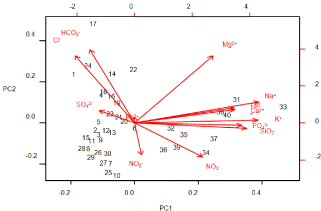
Figure 4: Bi-plot of first two principal components.
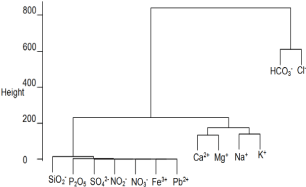
    Figure 5: Dendrogram (Average linkage) of chemical radicals in hand dug
wells in Akure.
Conclusion
PCA findings from 13 parameters used for the water quality characterization of hand dug wells in Akure show that the characterization can be replaced by the 4 principal components explaining about 67% of the data variance: cations, chlorine, bicarbonates, sulphate, lead and nitrite. The physicochemical properties and hygienic importance of water quality of hand dug wells in Akure metropolis rely solely on these parameters. Factor analysis confirmed the PCA results with the first two principal components explaining about 50% of data contain the key variables of the drinking water supply system: inorganic salts and nitrate. The PCA scatter plots and dendrograms were used for the samples clustering. Also the combination of scatter plots and cluster analysis was found to be advantages. The revealed clusters gather the drinking water samples according to their origin (surface and ground water). The results of Multivariate methods are suitable for reducing the water quality parameters as well as the relationships among them. If properly harnessed, this method can be handy in global perspective.
References
- UNICEF Australia. Promotion of Water, Sanitation and Hygiene Education (WASHE) in Choma, Namwala, Gwembe and Siavonga Districts. Final Draft Evaluation Report Zambia. 2005.
- Cosgrove WJ, Rijsberman FR. World Water Vision: Making water everybody’s business. Earthscan Publication Ltd. 2000: 108.
- Gomez JD, Nakat AC. Community participation in water and sanitation. Water International. 2002; 27: 343-353.
- Goel PK. Water Pollution- Causes, effects and Control, New Age Int (P) Ltd, New Delhi. 2000.
- Ram Reddy V, Farzana Jabeen, Sudarshan MR, Seshagiri Rao A. Assessment of ground water quality in mukkam, chepalakancheru and dallipeta: coastal villages of Vizianagaram district of Andhra Pradesh. International Journal of Applied Biology and Pharmaceutical Technology. 2012; 3: 31-38.
- Divya KS, Mahadeva Murthy S. Study the water quality assessment using water quality index (WQI) in few waersample of Karnataka and Kerala State. International Journal of Recent Scientific Research. 2013; 4: 267-270.
- Simeonov V, Stanimirova I, Walczak B, Massart DL. A comparison between two robust PCA algorithms, Chemometric Intelligent Laboratory. 2004; 71: 83-95.
- Singh KP, Malik A, Mohan D, Sinha S, Multivariate statistical techniques for the evaluation of spatial and temporal variations in water quality of Gomti River (India)-a case study, Water Research. 2004; 38: 3980-3992.
- Shrestha S, Kazama F. Assessment of surface water quality using multivariate statistical techniques: A case study of the Fuji river basin, Japan. Environmental Modelling Software. 2007; 22: 464-475.
- Stanimirova I, Walczak B, Massart DL, Simeonov V. A comparison between two robust PCA algorithms. Chemometric Intelligent Laboratory. 2004; 71: 83-95.
- Wang YS, Lou ZP, Sun CC, Wu ML, Han SH. Multivariate statistical analysis of water quality and phytoplankton characteristics in Daya Bay, China, from 1999 to 2002. Oceanologia. 2006; 48: 193-211.
- ChauK W, Muttil N. Data mining and multivariate statistical analysis for ecological system in coastal waters. Journal of Hydroinformatics. 2007; 9: 305-317.
- Suikkanen S, Laamanen M, Huttunen M. Long-term changes in summer phytoplankton communities of the open northern Baltic Sea. Estuarasian, Coastal Shelf Science. 2007; 71: 580-592.
- Wu ML, Wang YS. Using chemometrics to evaluate anthropogenic effects in Daya Bay, China. Estuarasian, Coastal and Shelf Science. 2007; 72: 732-742.
- Zhou F, Guo HC, Hao ZJ. Spatial distribution of heavy metals in Hong Kong’s marine sediments and their human impacts: A GIS-based chemometric approach. Marine Pollution Bulletin. 2007; 54: 1372-1384.
- Wu ML, Wang YS, Sun CC, Wang H, Lou ZP, Dong JD. Using chemometrics to identify water quality in Daya Bay, China. Oceanologia. 2009; 51: 217-232.
- Croux C, Ruiz-Gazen A. High breakdown estimators for principal components: the projection-pursuit approach revisited. Journal of Multivariate Analysis. 2005; 95: 206-226.
- Gong F, Wang BT, Fung YS, Chau FT. Chemometric characterization of the quality of the atmospheric environment in Hong Kong. Atmosphere Environment. 2005; 39: 6388-6397.
- Coorav PG. Notes on charnokites of Ado-Ekiti-Akure area western Nigeria. African Geology, Ibadan. 1972; 45-53.
- Coorav PG. Some aspects of the Precambrian of Nigeria: Revered journal of Mining and Geology B (1,2). 1974; 17-43.
- Rahaman MA. Recent advances in the study of the basement complex of Nigeria, in Precambrian geology of Nigeria. Geological Surveying of Nigeria. 1978; 11-43.
- Olarewaju VO. Charnokitic-Granite association in SW Nigeria: Rapakivi granite type and charnokitic plutonism in Nigeria? Journal of African Earth Science. 1987; 6: 67-77.
- Adelusi AO, Balogun O. A geoeletric investigation for groundwater development of Orita-Obele area, near Akure SW Nigeria. Global Journal of Pure Applied Sciences. 2001; 7: 707-717.
- Ayeni AO. Malaria Morbidity in Akure, Southwest, Nigeria: A Temporal Observation in a Climate Change Scenario. Trends in Applied Sciences Research. 2011; 6: 488-494.
- APHA. Standard methods, 21st Edition. 19th Edition/Ed. American Public Health Association. Washington DC. 2005.
- Adelekan BA, Ogunde OA. Quality of water from dug wells and the lagoon in Lagos Nigeria and associated health risks. Scientific Research and Essays. 2012; 7: 1195-1211.
- Nwankwoala HO, Nwagbogwu CN. Characteristics and quality assessment of groundwater in parts of Akure, South-Western Nigeria. Journal of Environmental Science and Water Resources. 2012; 1: 67-73.
- Atarhe DO, Egbuna CK. Physicochemical Assessment of Groundwater Quality in Akure, South-Western Nigeria. Journal of Civil Engineering and Urbanism. 2013; 3: 25-28.
- Guidelines on health aspects of water desalination. Geneva: World Health Organization. 1980.
- Jolliffe IT. Principal component analysis. Springer. 2002.
- Kleinbaum G, Kupper LL, Muller KE. Applied Regression Analysis and Other Multivariable Methods, PWS-KENT Publishing Comp. 1988; 718.