
Research Article
Austin J Environ Toxicol. 2019; 5(1): 1026.
Carbon Storage in Sediments of Freshwater Fishponds of Odisha, Andhra Pradesh, and West Bengal, India
Adhikari S1*, Mahanty D1, Ikmail S2, Sarkar S2, Rathod R3 and Pillai BR2
¹Regional Research Centre (RRC) of ICAR-Central Institute of Freshwater Aquaculture, West Bengal, India
²ICAR-Central Institute of Freshwater Aquaculture, India
³Regional Research Centre (RRC) of ICAR-CIFA, Penamaluru Fish Seed Farm, India
*Corresponding author: Subhendu Adhikari, Regional Research Centre (RRC) of ICAR-Central Institute of Freshwater Aquaculture, Rahara, Kolkata, West Bengal, India
Received: September 27, 2019; Accepted: October 29, 2019; Published: November 05, 2019
Abstract
Considering the impact of climate change on aquaculture practices, carbon storage by fish pond sediment could mitigate some emission of greenhouse gases form the fish ponds. The potentials of carbon storage by the sediments of fish ponds of Ganjam, Keonjhargarh, and Puri districts of Odisha, Krishna district of Andhra Pradesh, Moyna and Tamluk of East Medinipur, Purulia, Bankura, Murshidabad, South and North 24 Parganas districts of West Bengal, India were estimated. It is evident from the results that with an increase in fish production, the C storage decreased. The production per crop in the present study increased from 1815±376 kg/ha to 8351±1882 kg/ha and accordingly, the C storage/kg fish decreased from 1.44±0.73 to 0.62±0.21. The three types of combined humus carbon (loosely, stably and tightly combined humus carbon) were also analyzed for some sediment in the present study. The loosely combined humus varied from 36 to 43 per cent, stably combined humus varied from 4 to 6 per cent, and tightly combined humus varied from 53 to 58 per cent, respectively. Among the three combined humus, loosely combined form constitute about 40 percent of the total soil organic carbon, and thus, carbon sequestration could be 60 percent of the total soil carbon storage.
Keywords: Carbon storage; Sequestration; Sediments; Aquaculture ponds
Introduction
Increase in greenhouse gases (GHGs) concentration in the atmosphere is the main reason for climate change as accumulated GHGs in the atmosphere intercepts outgoing infra-red radiation which traps heat and raises the temperature in the atmosphere. The carbon dioxide (CO2) level has increased by 31 per cent, from 280 ppmv in 1850 to 380 ppmv in 2005, and is now increasing at 1.7 ppmv/ yr [1]. With this increase, there is a growing public and scientific concern about the carbon sequestration potential of various terrestrial ecosystems especially wetlands [2]. It has been suggested that the sequestration of atmospheric CO2 into soil organic carbon (SOC) could contribute significantly to adhere with the Kyoto Protocol to reduce emissions of greenhouse gases [3,4]. In stabilizing the atmospheric abundance of CO2 and other greenhouse gases to mitigate the risks of global warming [5]. [6] suggested that there are three strategies of lowering CO2 emissions: (i) reducing the global energy use, (ii) developing low or no-carbon fuel, and (iii) sequestering CO2 from point sources or atmosphere through natural and engineering techniques. Fifteen options of stabilizing the atmospheric concentration of CO2 by 2050 at approximately 550 ppm have been outlined by [7]. Three of these 15 options were based on carbon sequestration in terrestrial ecosystems [8]. In this respect, aquaculture ponds can play potential role in carbon sequestration.
During the last three decades world food fish production of aquaculture has expanded by almost 12 times, with an average annual rate of 8.8 per cent. Presently 600 aquatic species are raised in captivity in about 190 countries for production in farming systems of varying input intensities and technological sophistication (FAO, 2016). Thus, there is immense scope to store and capture carbon by the fishponds to reduce and offset the chance of emitting different GHGs from the different aquaculture systems. Thus the objectives of the present study are: (i) to assess the potentials of carbon storage in different aquaculture ponds of three different states in India; (ii) to determine the extent of carbon sequestration of pond sediments.
Materials and Methods
Aquaculture ponds were chosen for the carbon storage study from the Ganjam (19.5860° N, 84.6897° E), Keonjhargarh (21.6289° N, 85.5817° E) and Puri (19.8134° N, 85.8315° E) districts of Odisha, Kaikaluru Mandal (16.5527° N, 81.2129° E) of Krishna district of Andhra Pradesh, and Moyna (22.2738° N, 87.7697° E), Tamluk block (22.2788° N, 87.9188° E) of East Medinipur, Purulia (23.3321° N, 86.3652° E), Bankura (23.1645° N, 87.0624° E), Murshidabad (24.2290° N, 88.2461° E), south 24 Parganas (22.1352° N, 88.4016° E) and North 24 Parganas (22.6168° N, 88.4029° E) districts of West Bengal, India. Overall, the culture period in these areas varied from 180 to 300 days. The culture practices in these ponds are shown in Table 1.
    Area/Location
    Culture of Species with
      Stocking size (g)
    Stocking    density (103/ha)
    Harvesting size (g)
    Management    practices


    Ganjam, Puri, Keonjhargarh, Puri, Odisha
    Rohu (5.0-8.0)
      Catla (5.0-8.0)
      Mrigal (5.08.0)
    5.0


    Rohu 700
      Catla 900
      Mrigal 500
    Organic manure (cow dung), Inorganic fertilizers    (Urea,Single Super Phosphate), lime. Supplementary feeding with ground nut    oil cake and rice bran in a ratio of 1:1.


    Kaikaloru, Krishna, Andhra Pradesh
    Rohu- 50
      Catla 150
      Mrigal 100
    5.0
    Rohu 1100
      Catla 2200
      Mrigal 1300
    Mainly pelleted feed along with organic manure    (cow dung), inorganic fertilizers, lime.


    Moyna ,
      West Bengal
    Rohu- 90
      Catla 110
      Mrigal 70
    5.0-14.0
      (av. 10.0)

    Rohu 800
      Catla 1200
      Mrigal 600
    Mainly pelleted feed along with inorganic    fertilizers, lime.


    Tamluk, West Bengal
    Rohu- 50-100 (av.70)
      Catla 75-200 (av.120)
      Mrigal 25-150 (av.70)
    5.0-14.0 (av.9.0)

    Rohu 770
      Catla 1170
      Mrigal 600
    Mainly pelleted feed along with organic manure    (cow dung), inorganic fertilizers, lime.


    Bankura, West Bengal
    Rohu- 20
      Catla 25
      Mrigal 18
    5.0- 7.0 (av.6.0)

    Rohu 460
      Catla 1000
      Mrigal 425
    Mainly pelleted feed along with organic manure    (cow dung), inorganic fertilizers, lime.


    Murshidabad, West Bengal
    Rohu- 80
      Catla 130
      Mrigal 60
    2.5-7.5 (av.5.8)

    Rohu 775
      Catla 1600
      Mrigal 650
    Mainly pelleted feed along with organic manure    (cow dung), inorganic fertilizers, lime.


    North and South 24 Parganas,
      West Bengal
    Rohu- 100
      Catla 500
      Mrigal 50
    6.6-11.2
      (av.9.0)
    Rohu 900
      Catla 2800
      Mrigal 600
    Mainly pelleted feed along with organic manure    (cow dung), inorganic fertilizers, lime.
Table 1: Culture practices in the ponds under different places under study.
Calculation of carbon storage
Soil carbon storage was measured by CORE Method. In this method, sediment samples from the pond was collected by a soil sampler (Corer) in such a way that only the sediment core was collected, no bottom soil below the sediment was collected. The sediment dry bulk density was measured and the sediment organic carbon was determined by CHN Analyzer. The carbon storage (Mg C/ha, mega gram C/ha) was calculated as per [9] as follows = [C (%)*dry bulk density (Mg/m3)*depth (m)*104 m2]/100.
Analysis of combined humus forms
The combined humus forms are classified into three types by using three different extractants and were extracted as: (i) the loosely combined humus was extracted using 0.1 M NaOH; (ii) the stably combined humus was extracted using 0.1 M Na4P2O7 + 0.1 M NaOH mixed liquid (pH 13); and (iii) the residue was considered as the tightly combined humus. Both of the loosely and stably combined humus solution was measured at 465 and 665 nm using the ultraviolet spectrophotometer, respectively [10]. The E465/E665 ratio was calculated by dividing the absorbance of the sample at 465nm by that at 665nm. The loosely and stably combined humus C contents were measured by a liquid C/N analyzer, whereas the tightly combined humus C content was calculated by subtracting the sum of the loosely and stably combined humus C contents from the total humus C content [10].
All the data were presented as average with standard deviation (SD).
Results and Discussion
The sediment carbon storage in fish ponds of Ganjam district of Odisha is presented in Table 2. The organic carbon and carbon storage in the sediments of the fish ponds were 0.65±0.38 per cent and 2590±1310 kg C/ha/crop, respectively. The fish production was 1815±376 kg/ha/crop. The C storage was 1.44±0.73 kg/kg fish.
    Sample no.
    Sediment depth (cm)
    Dry bulk    density
      (Mg/m3)
    Organic carbon
      (%)
    Carbon    storage/
      crop(kg C/ha)
    Production/ crop
      (kg/ha)
    C storage/
      kg fish(kg)


    1
    3.0
    1.33
    0.240
    960
    1850
    0.51


    2
    2.6
    1.27
    0.456
    1550
    1500
    1.03


    3
    3.0
    1.19
    2.016
    7220
    2000
    3.61


    4
    2.6
    1.27
    0.600
    2020
    1800
    1.12


    5
    3.2
    1.24
    0.366
    1480
    1250
    1.18


    6
    3.0
    1.41
    0.192
    810
    1700
    0.47


    7
    3.3
    1.20
    0.264
    1060
    1680
    0.63


    8
    3.0
    1.13
    0.600
    2040
    1800
    1.13


    9
    3.0
    1.11
    1.056
    3520
    1680
    2.09


    10
    3.3
    1.10
    0.600
    2200
    1950
    1.12


    11
    3.4
    1.21
    0.648
    2720
    3000
    0.90


    12
    2.0
    1.04
    0.696
    1450
    1200
    1.20


    13
    3.0
    0.78
    1.440
    3390
    1780
    1.90


    14
    3.4
    1.27
    0.864
    3800
    2150
    1.76


    15
    3.5
    1.78
    0.552
    3450
    2000
    1.72


    16
    2.9
    1.25
    0.432
    1560
    1600
    0.97


    17
    3.3
    1.49
    0.480
    2380
    1780
    1.33


    18
    3.2
    1.43
    0.840
    3930
    1200
    3.27


    19
    3.3
    1.15
    0.672
    2590
    1600
    1.61


    20
    3.3
    1.57
    0.600
    3170
    1800
    1.76


    21
    3.2
    1.19
    0.648
    2480
    1760
    1.40


    22
    5.2
    1.18
    0.648
    2650
    1810
    1.46


    23
    3.4
    1.41
    0.600
    3100
    1920
    1.61


    24
    3.4
    1.31
    0.600
    2670
    2230
    1.19


    25
    3.0
    1.40
    0.600
    2520
    2350
    1.07


    Mean±SD
    3.18±0.53
    1.22±0.19
    0.65±0.38
    2590±1310
    1815±376
    1.44±0.73
Table 2: Sediment carbon storage in fish ponds of Ganjam district of Odisha.
The sediment carbon storage in fish ponds of Keionjhargarh district of Odisha is presented in Table 3. The organic carbon and carbon storage in the sediments of the fish ponds were 1.12±0.56 per cent and 2120±890 kg C/ha/crop, respectively. The fish production was 1915±789 kg/ha/crop. The C storage was 1.21±0.56 kg/kg fish.
    Sample no.
    Sediment dept (cm)
    Dry bulk density (Mg/m3)
    Organic
      carbon(%)
    Carbon storage/
      crop(kg C/ha)
    Production/
      crop(kg/ha)
    C    storage/kg fish
      (kg)


    1
    3.05
    0.79
    0.721
    1730
    1800
    0.961


    2
    3.00
    0.92
    0.837
    2310
    1120
    2.06


    3
    2.75
    0.49
    2.023
    2740
    3000
    0.913


    4
    3.36
    1.07
    0.534
    1920
    1800
    1.066


    5
    3.00
    0.74
    0.976
    2160
    1975
    1.093


    6
    3.20
    0.52
    1.418
    2390
    2114
    1.130


    7
    2.80
    0.45
    2.209
    2850
    1750
    1.628


    8
    3.10
    0.48
    1.232
    1840
    1410
    1.304


    9
    4.20
    0.63
    0.624
    1690
    2250
    0.751


    10
    3.40
    0.56
    0.888
    1690
    1037
    1.629


    11
    2.93
    0.99
    1.128
    3290
    1650
    1.993


    12
    3.80
    0.76
    1.584
    4570
    2000
    2.285


    13
    3.20
    0.49
    1.584
    2560
    4500
    0.568


    14
    3.84
    0.81
    0.168
    0520
    2750
    0.189


    15
    3.37
    0.94
    0.720
    2290
    1300
    1.761


    16
    3.00
    0.56
    1.224
    2080
    1310
    1.587


    17
    3.00
    0.44
    0.912
    1200
    1687
    0.711


    18
    3.00
    0.29
    2.184
    1940
    1900
    1.021


    19
    3.30
    0.48
    0.960
    1520
    1200
    1.266


    20
    3.10
    0.55
    0.480
    0840
    1750
    0.48


    Mean    S.D.
    3.22±0.36
    0.648±0.21
    1.12±0.56
    2120±890
    1915±789
    1.21±0.56
Table 3: Sediment carbon storage in fish ponds of Keonjhargarh district of Odisha.
The sediment carbon storage in fish ponds of Puri district of Odisha is presented in Table 4. The organic carbon and carbon storage in the sediments of the fish ponds were 0.66±0.37 per cent and 2340±1470 kg C/ha/crop, respectively. The fish production was 2044±1118 kg/ha/crop. The C storage was 1.64±1.24 kg/kg fish.
    Sample no.
    Sediment level (cm)
    Dry bulk    density
      (Mg/m3)
    Organic carbon
      (%)
    Carbon    storage
      /crop
      (kg/ha)
    Production/ crop
      (kg/ha)
    C storage/ kg fish
      (kg)


    1
    2.3
    2.84
    0.227
    1480
    1250
    1.184


    2
    3.7
    0.84
    0.954
    3030
    2500
    1.212


    3
    2.45
    1.25
    0.500
    1530
    1500
    1.02


    4
    1.95
    2.67
    0.410
    2130
    1000
    2.13


    5
    2.33
    1.10
    0.250
    0640
    1000
    0.64


    6
    3.3
    1.02
    0.886
    3000
    880
    3.40


    7
    2.0
    2.07
    1.364
    5670
    3800
    1.49


    8
    3.2
    1.60
    0.250
    1280
    1154
    1.109


    9
    2.75
    0.55
    0.636
    0960
    2130
    0.450


    10
    3.5
    1.12
    1.023
    4040
    875
    4.617


    11
    3.64
    1.53
    0.727
    4040
    3000
    1.346


    12
    3.5
    1.18
    0.515
    2130
    3500
    0.608


    13
    5.2
    0.47
    0.425
    1040
    3750
    0.277


    14
    3.24
    0.80
    0.672
    1760
    1375
    1.28


    15
    2.99
    2.23
    1.454
    9730
    3800
    2.56


    16
    3.33
    1.3
    1.068
    4730
    1250
    3.78


    17
    3.25
    1.10
    0.492
    1770
    2000
    0.885


    Mean±SD
    3.07±0.83
    1.523±0.80
    0.660±0.37
    2340±1470
    2044±1118
    1.64±1.24
Table 4: Sediment carbon storage in fish ponds of Puri district of Odisha.
The sediment carbon storage in fish ponds of Kaikaluru, Krishna district of Andhra Pradesh is shown in Table 5. The organic carbon content in the sediments was 1.5±0.68 per cent, and the carbon storage was 5486±2980 kg C/ha/crop. The fish production was 8351±1882 kg/ ha/crop. The C storage was 0.62±0.21 kg/kg fish.
    Sample no.
    Sediment dept (cm)
    Dry bulk density (Mg/m3)
    Organic
      carbon
      (%)
    Carbon storage/
      crop
      (kg/ha)
    Production/
      Crop
      (kg/ha)
    C    storage/ kg fish
      (kg)


    1
    6.85
    0.88
    0.92
    5550
    8500
    0.65


    2
    6.92
    0.60
    2.53
    10500
    10,666
    0.98


    3
    6.92
    0.30
    2.07
    4290
    8000
    0.53


    4
    6.66
    0.39
    1.01
    2680
    5500
    0.48


    5
    6.15
    0.74
    0.97
    4410
    9090
    0.48


    Mean±S.D
    6.7±0.32
    0.582±0.24
    1.5±0.68
    5486±2980
    8351±1882
    0.62±0.21
Table 5: Sediment carbon storage in fish ponds of Kaikaluru, Krishna district of Andhra Pradesh.
The sediment carbon storage in fish ponds of Moyna, East Medinipur district of West Bengal is shown in Table 6. The organic carbon content in the sediments was 1.35±0.65 per cent, and the carbon storage was 5682±1591 kg C/ha/crop. The fish production was 7475±1156 kg/ha/crop. The C storage was 0.76±0.19 kg/kg fish.
    Sample no.
    Sediment level (cm)
    Dry bulk    density
      (Mg/m3)
    Organic carbon (%)
    Carbon storage/
      Crop
      (kg/ha)
    Production/
      crop
      (kg/ha)
    C storage/ kg fish
      (kg)


    1
    5.0
    0.59
    1.38
    4071
    8000
    0.50


    2
    7.9
    1.01
    0.66
    5266
    6500
    0.81


    3
    6.3
    0.56
    1.41
    4974
    5800
    0.85


    4
    4.8
    1.07
    1.51
    7755
    9000
    0.86


    5
    5.2
    0.59
    2.47
    7577
    7500
    1.01


    6
    6.4
    0.98
    0.71
    4453
    8050
    0.55


    Mean±S.D
    5.93±1.17
    0.80±0.24
    1.35±0.65
    5682±1591
    7475±1156
    0.76±0.19
Table 6: Sediment carbon storage in fish ponds of Moyna, East Medinipur district of West Bengal.
The sediment carbon storage in fish ponds of Tamluk, East Medinipur district of West Bengal is presented in Table 7. The organic carbon and carbon storage in the sediments of the fish ponds were 1.42±0.63 per cent and 5490±2336 kg C/ha/crop, respectively. The fish production was 7169±3065 kg/ha/crop. The C storage was 1.80±0.30 kg/kg fish.
    Sample no.
    Sediment level
      (cm)
    Dry bulk    density
      (Mg/m3)
    Organic carbon (%)
    Carbon storage/
      crop(kg/ha)
    Production/
      crop (kg/ha)
    C storage/ kg fish
      (kg)


    1
    5
    0.78
    0.66
    2574
    6633
    0.38


    2
    5
    0.73
    1.02
    3723
    4300
    0.86


    3
    5
    0.55
    1.38
    3795
    6600
    0.57


    4
    6
    1.01
    1.65
    9999
    6795
    1.47


    5
    5
    0.61
    2.35
    7167
    10,000
    0.71


    6
    5
    0.58
    2.47
    7163
    14,400
    0.49


    7
    6
    0.76
    0.91
    4149
    4100
    1.01


    8
    6
    0.88
    0.83
    4382
    5750
    0.76


    9
    6
    0.65
    1.12
    4368
    5313
    0.82


    10
    5
    0.82
    1.85
    7585
    7800
    0.97


    Mean±S.D
    5.4±0.51
    0.73±0.14
    1.42±0.63
    5490±2336
    7169±3065
    0.80±0.30
Table 7: Sediment carbon storage in fish ponds of Tamluk, East Medinipur district of West Bengal.
The sediment carbon storage in fish ponds of Purulia district of West Bengal is presented in Table 8. The organic carbon and carbon storage in the sediments of the fish ponds were 1.08±0.33 per cent and 3217±818 kg C/ha/crop, respectively. The fish production was 2363±813 kg/ha/crop. The C storage was 1.43±0.39 kg/kg fish.
    Sample no.
    Sediment level (cm)
    Dry bulk    density
      (Mg/m3)
    Organic carbon (%)
    Carbon storage/
      crop
      (kg/ha)
    Production/
      crop
      (kg/ha)
    C storage/ kg fish
      (kg)


    1
    4.2
    0.99
    0.68
    2827
    1687
    1.67


    2
    2.7
    1.17
    1.39
    4391
    3376
    1.30


    3
    3.0
    1.23
    0.97
    3579
    1700
    2.10


    4
    2.7
    0.77
    1.47
    3056
    1880
    1.62


    5
    5.0
    0.62
    0.71
    2201
    1716
    1.28


    6
    5.5
    0.45
    0.98
    2425
    2683
    0.90


    7
    3.7
    0.78
    1.4
    4040
    3500
    1.15


    Mean±S.D
    3.82±1.12
    0.85±0.28
    1.08±0.33
    3217±818
    2363±813
    1.43±0.39
Table 8: Sediment carbon storage in fish ponds of Purulia district of West Bengal.
The sediment carbon storage in fish ponds of Bankura district of West Bengal is shown in Table 9. The organic carbon content in the sediments was 1.52±0.81 per cent, and the carbon storage was 4708±3248 kg C/ha/crop. The fish production was 4326±1441 kg/ha/ crop. The C storage was 1.15±0.67 kg/kg fish.
    Sample no.
    Sediment level (cm)
    Dry bulk density
      (Mg/m3)
    Organic carbon (%)
    Carbon storage/
      crop
      (kg/ha)
    Production/
      crop
      (kg/ha)
    C storage/ kg fish
      (kg)


    1
    3.0
    0.93
    2.4
    6696
    3800
    1.76


    2
    5.0
    0.78
    1.4
    5460
    3500
    1.56


    3
    2.0
    1.46
    0.7
    2044
    3247
    0.62


    4
    2.6
    1.04
    1.3
    3515
    2536
    1.38


    5
    6.0
    0.18
    1.7
    1836
    6600
    0.28


    6
    3.2
    0.31
    2.6
    2579
    5100
    0.50


    7
    10
    0.57
    1.9
    10830
    5500
    1.96


    Mean±S.D
    4.54±2.78
    0.86±0.51
    1.52±0.81
    4708±3248
    4326±1441
    1.15±0.67
Table 9: Sediment carbon storage in fish ponds of Bankura district of West Bengal.
The sediment carbon storage in fish ponds of Murshidabad districts of West Bengal is shown in Table 10. The organic carbon content in the sediments of fish ponds was 1.18±0.40 per cent, and the carbon storage was 5210±910 kg C/ha/crop. The fish production was 6375±1932 kg/ha/crop, and the C storage was 0.87±0.30 kg/kg fish in the fish ponds of Murshidabad district.
    Districts
    Sample no.
    Sediment level (cm)
    Dry bulk density(Mg/m3)
    Organic carbon (%)
    Carbonstorage/crop
      (kg/ha)
    Production/
      Crop(kg/ha)
    C storage/ kg fish (kg)


    Murshidabad
    1
    6.0
    0.74
    1.32
    5860
    4320
    1.35


    2
    7.5
    0.64
    1.18
    5664
    7051
    0.80


    3
    7.5
    0.68
    0.84
    4284
    7500
    0.57


    4
    7.5
    0.45
    1.80
    6075
    8620
    0.70


    5
    8.0
    0.66
    0.79
    4171
    4388
    0.95


    Mean±SD
    7.3±0.75
    0.63±0.10
    1.18±0.40
    5210±910
    6375±1932
    0.87±0.30
Table 10: Sediment carbon storage in fish ponds of Murshidabad district of West Bengal.
    Sample no.
    Sediment level (cm)
    Dry bulk    density
      (Mg/m3)
    Organic carbon (%)
    Carbon storage/
      crop
      (kg/ha)
    Production/
      crop
      (kg/ha)
    C storage/ kg fish
      (kg)


    1
    3.7
    0.81
    1.49
    4465
    4200
    1.06


    2
    4.2
    0.95
    1.08
    4309
    4800
    0.89


    3
    4.5
    1.01
    0.59
    2681
    5000
    0.53


    4
    5
    1.01
    0.68
    3434
    5550
    0.61


    5
    5
    1.01
    1.55
    7827
    4800
    1.63


    6
    4.7
    0.64
    2.42
    7279
    4366
    1.66


    7
    4.2
    0.72
    1.92
    5806
    5625
    1.03


    8
    4.5
    0.51
    2.45
    5622
    4742
    1.18


    9
    2.7
    1.53
    1.87
    7724
    5050
    1.52


    10
    4
    1.56
    1.07
    6676
    3375
    1.97


    11
    4.7
    0.73
    1.37
    4700
    2656
    1.76


    12
    4.2
    0.8
    1.12
    3763
    2656
    1.41


    13
    4
    1.56
    0.87
    5428
    4000
    1.35


    14
    3.8
    1.59
    0.92
    5558
    2960
    1.87


    Mean±S.D
    4.22±0.60
    1.03±0.37
    1.38±0.59
    5376±1597
    4270±1008
    1.31±0.45
Table 11: Sediment carbon storage in fish ponds of South and North 24 Paraganas districts of West Bengal.
The sediment carbon storage in fish ponds of South and North 24 Parganas districts of West Bengal is shown in 11. The organic carbon content in the sediments of fish ponds was 1.38±0.59 per cent, and the carbon storage was 5376±1597 kg C/ha/crop. The fish production was 4270±1008 kg/ha/crop, and the C storage was 1.31±0.45 kg/kg fish in the fish ponds of these districts.
The carbon storage with the fish production has presented in Figure 1. From the figure, it is evident that with an increase in fish production, the C storage decreased. The production per crop in the present study increased from 1815±376 kg/ha to 8351±1882 kg/ ha and accordingly, the C storage/kg fish decreased from 1.44±0.73 to 0.62±0.21. This could be due to the fact that higher production utilized the C at a maximum level for their growth than that the same at lower production level.
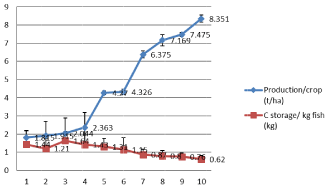
Figure 1: C storage in relation with total production.
In earlier study, [11] reported that the carbon sequestration capacity ranged from 442 to 1882 kg C/ha with an average value of 1018±447 kg C/ha for 9 aquaculture ponds of one place. The present study conducted for different places under different management systems for 116 numbers of ponds.
The three types of combined humus carbon (loosely, stably and tightly combined humus carbon) are shown in Figure 2A, 2B, 2C and Table 12. The carbon contents of the loosely, stably and tightly combined humus ranged from 2.40 to 7.87 g/kg (Figure 2A), 0.27 to 0.96 g/kg (Figure 2B), and 3.30 to 11.02g/kg (Figure 2C) respectively. The combined humus forms were arranged on the basis of C content in the following order: tightly> loosely> stably combined humus C. However, the proportion of the three combined humus C showed no significant differences among the different soils (Table 12). The loosely combined humus varied from 36 to 43 per cent, stably combined humus varied from 4 to 6 per cent, and tightly combined humus varied from 53 to 58 per cent, respectively. Among the three combined humus (loosely, stably and tightly combined humus C), loosely combined form constitute about 40 percent of the total soil organic carbon, and thus, carbon sequestration could be 60 percent of the total soil carbon storage.
    Location
    Loosely combined humus
    Stably combined Humus
    Tightly combined Humus


    Habra I, North 24 Parganas
    39
    4
    57


    Habra II, North 24 Parganas
    40
    4
    56


    Barasat, North 24 Parganas
    40
    5
    55


    Kharibari, North 24 Parganas
    36
    6
    58


    Canning, South 24 Parganas
    38
    6
    56


    Moyna I, East Medinipur
    41
    5
    54


    Moyna II, East Medinipur
    43
    4
    53
Table 12: Proportions of combined humus C at some selected locations (% soil
organic carbon).
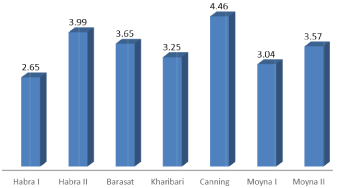
Figure 2A: E465/E665 of loosely combined humas.
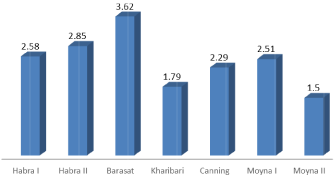
Figure 2B: Overall survival, autologous stem cell transplant (ASCT) versus no ASCT (p=0.12).
The E465/E665 values of the loosely combined humus (2.60 to 4.46) were higher than that of the stably combined humus (1.50 to 3.62) (Figures 3A and 3B). Thus, the E465/E665 of loosely combined humus can be considered a more suitable index rather than that of the stably combined humus for identifying the aromaticity and humification degree of soil organic carbon. The E465/E665 ratio is related to the aromaticity and to the degree of condensation of the chain of aromatic carbons of the humic acids, and could be used as a humification index [12,13]. Low E465/E665 ratio reflects a high degree of condensation of these structures while high ratio means presence of large quantities of aliphatic structures and low quantities of condensed aromatic structures [14]. This ratio also is inversely related to the degree of aromaticity, particle size, molecular weight, and acidity [15].
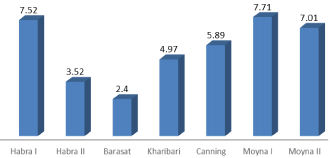
    Figure 3A: Comparison of the C contents of loosely combined humus C (g
kg¯1).
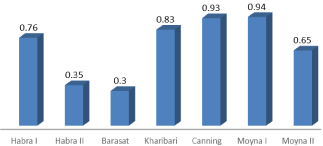
    Figure 3B: Comparison of the C contents of stably combined humus C (g
kg¯1).
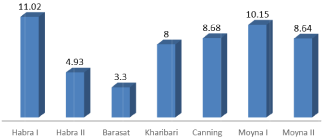
    Figure 3C: Comparison of the C contents of tightly combined humus C (g
kg¯1).
Conclusion
From the present study it is evident that aquaculture ponds could play a vital role to counteract the emission of green house gases from the aquaculture practices by sequestering carbon in the sediments. Even if sometimes, the bottom sediments could remove from the pond to enhance the productivity, at least 60 per cent carbon storage will act as carbon sequester and it will not be able to come out in the atmosphere. Thus, more study is needed in this respect to generate more data so that carbon neutral aquaculture practices can be achieved.
Acknowledgement
The funding of NICRA (National Innovation on Climate Resilient Agriculture) for conducting of the present investigation is gratefully acknowledged. We are also highly grateful to all the farmers for their immense help during our investigation.
References
- IPCC (Intergovernmental Panel on Climate Change). Climate Change: Climate Change Impacts, Adaptation and Vulnerability. Working Group II, Geneva. 2007.
- Xiaonan D, Xiaoke W, Lu F, Zhiyun O. Primary evaluation of carbon sequestration potential of wetlands in China. Acta Ecol Sin. 2008; 28: 463– 469.
- Schlesinger WH. Carbon sequestration in soils. Science. 1999; 284: 2095.
- Akselsson C, Berg B, Meentemeyer V, Westling O. Carbon sequestration rates in organic layers of boreal and temperate forest soils – Sweden as a case study. Global Ecol Biogeogr. 2015; 14: 77–84.
- Walsh B. Greenhouse airlines: traveling by jet is a dirty business. As passenger load increases, enviros look for ways to cut back the carbon. Time Magazine. 2007; 169.
- Schrag DP. Preparing to capture carbon. Science. 2007; 315: 812–813.
- Pacala S, Socolow R. Stabilization wedges: solving the climate problem for the next 50 years with current technologies. Science. 2004; 305: 968–972.
- Eid EM, Shaltout KH. Evaluation of carbon sequestration potentiality of Lake Burullus, Egypt to mitigate climate change. Egyptian Journal of Aquatic Research. 2013; 39: 31–38.
- Lal R, Kimble JM, Follet RF, Cole CV. The potential of US cropland to sequester carbon and mitigate the greenhouse effect. Chelsea: Ann Arbor Press. 1998; 1: 128.
- Ji H, Zhuang S, Zhu Z, Zhong Z. Soil Organic Carbon Pool and Its Chemical composition in Phyllostachy pubescens Forests at Two Altitudes in Jian-ou City, China. PLOS ONE. 2015; 10.
- Anikuttan KK, Adhikari S, Kavitha M, Jayasankar M. Carbon sequestration capacity of sediments, algae, and zooplankton from fresh water aquaculture ponds. Environ Monit Assess. 2016; 188: 422.
- Kononova MM. Soil organic matter: Its nature, its role in soil formation and in soil fertility. Oxford: Pergamon. 1966.
- Stevenson IL, Schnitzer M.Transmission. electron microscopy of extracted fulvic and humic acids. Soil Science. 1982; 133:179–185.
- Chin YP, Aiken GR, Danielsen KM. Binding of pyrene to aquatic and commercial humic substances: the role of molecular weight and aromaticity. Environmental Science & Technology. 1997; 31:1630–1635.
- Uyguner CS, Hellriegel C, Otto W, Larive CK. Characterization of humic substances: Implications for trihalomethane formation. Analytical and bioanalytical chemistry. 2004; 378:1579–1586.