
Research Article
J Fam Med. 2015;2(2): 1025.
Reducing Salt Intake by Enhanced Warning in Family Medicine
Nina Pinjuh Markota¹ and Mirjana Rumboldt²*
¹Department of Family Medicine, Mostar University School of Medicine, Bosnia & Herzegovina
²Department of Family Medicine, Split University School of Medicine, Croatia
*Corresponding author: Mirjana Rumboldt,Department of Family Medicine, Split University School of Medicine, Croatia
Received: March 26, 2015; Accepted: April 20, 2015; Published: April 22, 2015
Abstract
Background: Excessive salt intake is a major cardiovascular risk factor. At variance to the developed countries, the main source of sodium in transitional and developing countries is salt added while cooking and/or at the table. The objective of this trial was to examine the impact of enhanced warning on daily salt intake.
Subjects and Methods: A sample of treated hypertensive (N= 150) was randomized in two intervention subgroups, one receiving just a leaflet about the harmful effects of excessive salt intake (N= 74 - group 1), and the other one receiving in addition warning stickers for household salt containers (N= 76 – group 2). Arterial blood pressure (BP) and 24 h urinary sodium excretion (Na24) were measured in all the subjects at the start of the trial, and one month and two months later.
Results: The average starting 24Na was well above 205 mmol. In all the examinees a significant Na24 decrease was observed after 2 months, by some 27 mmol (P < 0.001). The decrease in Na24 was more pronounced in group 2 (to 183 ± 63 and 176 ± 55 mmol; P<0.001) than in group 1 (203 ± 60 and 200 ± 58 mmol; P= 0.147). Moreover, a significant drop in BP, by 5.3/2.9 mm Hg was observed in group 2 as opposed to group 1 (0.4/0.9 mm Hg). Male examinees (N= 73) had significantly higher Na24 during this trial than their female counterparts (N= 77). Decrease in Na24 positively correlated with BP lowering (r² = 0.5989; P< 0.0001).
Conclusions: A significant reduction in Na24 and BP is achieved with educational measures on harmful effects of excessive salt intake, in particular with the respective warning labels. Decreasing daily salt input by 35 mmol may result in an extra BP lowering by some 5-6/2-3 mm Hg.
Keywords: Arterial hypertension; Blood pressure; Family medicine; Risk warning; Salt intake
Introduction
Excessive salt intake is related to arterial hypertension, which is a major cardiovascular risk factor [1-3]. The worldwide prevalence of arterial hypertension in adult populations is about 30%, representing a major public health issue [4]. Despite numerous effective and affordable antihypertensive drugs, most of the treated hypertensive patients do not achieve satisfactory blood pressure (BP) control; only about a third of treated individuals achieve normal BP values. The causes of unsatisfactory BP regulation are numerous, including inadequate treatment, low compliance, and high salt intake [5].
It is well known that reducing salt intake decreases elevated BP with a number of additional health benefits [1-3, 6-10]. Despite the fact that most hypertensives know about the harmful effects of excessive salt, the salt consumption is still too high. All such patients in a family medicine office, along with the appropriate drugs receive information about the harmful effects of salt, and the ways of its reduction in the daily diet. Unfortunately, these educational efforts leave much to be desired [1-5].
Unlike developed countries, where the main source of salt in the daily diet derives from industrial, processed food (about 75% of the daily intake) [11], in less developed countries the main source of salt is its addition during home cooking procedures and at the table [12-14]. The available data for Croatia show that home cooking and additional seasoning are responsible for 56.4% of salt ingestion, followed by grocery bread (29.8%), and other bakery products (12.8%) [15], with an average daily intake of 10-13 g [16,17]. So far similar data for Bosnia and Herzegovina do not exist.
We have presumed that enhanced warning about the deleterious effects of high salt intake, even in treated hypertensive patients, previously exposed to such information, may cause a further, relevant reduction in daily salt intake and in BP too. We were focused on the main local source of salt, i.e. salt added during home cooking procedures and while eating.
Subjects and Methods
The participants in the present study were consecutive, adult, treated hypertensives of either sex, registered in a family medicine practice in Mostar, Bosnia and Herzegovina [18]. Of the 171 potential examinees, 150 volunteered to take part in the trial (21 did not accept to participate for various reasons) and signed the informed consent form, approved by the Split University School of Medicine Ethics Committee. In individual case report forms recorded were general demographic and anthropometric data, including blood pressure (standard mercury sphygmomanometry) and urinary sodium excretion in 24 hours (Na24). Measurement of Na24 was performed in the University Hospital Mostar Central Laboratory, accepting only samples containing more than 500 ml urine in the appropriately prepared bottles (an inadequate urine sampling had to be repeated in the next few days) [19].
The included 150 participants were further randomized in two groups (sealed envelops), exposed to interventions of varying intensity: group 1 received oral and printed advices on the health benefits of reduced salt intake (clearly stating that any intake over 6 g per day is excessive, while the average intake runs between 10 and 13 g of NaCl per day), and group 2 received moreover especially designed warning stickers to be mounted on all home salt containers (e.g. salt shakers) with an appropriate warning about the harmful effects of excessive salt intake (Figure 1). The participants were individually contacted during office visits (family physician and patronage nurse), when they received the informative leaflet about dangers of excessive salt intake and instructed (group 2) how to put the labels on any (every) salt container.
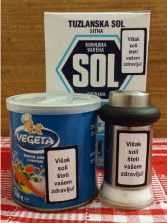
    Figure 1:  Our warning label on salt containers, stating (in Croatian language)
“Too much salt is a health hazard”.
One month and two months later (with a deviation of = 10 days) all the participants repeated the Na24 and BP measurements. The flow chart of this study is shown in Figure 2.
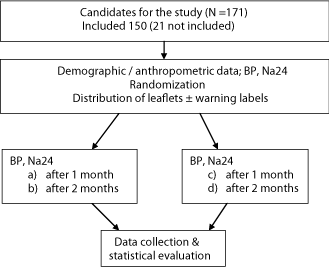
Figure 2: The study flow chart.
In statistical processing Graph Pad Prism, Version 4.3; 2005 and SPSS 17.0 (SPSS Inc., Chicago, IL, USA) programs were used. For continuous variables the symmetry of the distribution was analyzed by Kolmogorov-Smirnov test. The results were expressed as means and standard deviations (SD), or standard errors (SEM) in the figures. The significance of the observed differences was tested by ANOVA and Student’s t-test, as appropriate. P<0.05 was considered significant.
Results
All the included participants (N= 150) have completed the trial, with no remarkable side-effects or other complaints. Their baseline characteristics are presented in Table 1.
    Revision
    Result


    Age (years; mean ± SD)
    59.3 ± 12.0


    Sex female/male
    77/73


    Body weight (kg; mean ± SD )
    82.3 ± 12.4


    Body height (cm; mean ± SD)
    176.6 ±10.2


    BMI (body mass index; kg/m2; mean ± SD)
    26.2 ± 2.8


    Level of education (A/B)*
    121/29


    Number of antihypertensive drugs
    2.2 ± 0.9


    *A= elementary school,    VSS= higher education.
Table 1: Baseline characteristics of the study participants (N=150).
Sodium excretion and arterial pressure among the examinees
At the beginning of the trial average Na24 was 209.2 ±78.2 mmol. One month later Na24 dropped to 192.9 ± 61.9 mmol, and after two months it was 188.2 ±57.6 mmol. This reduction was statistically significant (ANOVA; F = 24.07; P <0.0001; R2 =0.139; Figure 3).
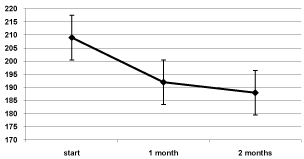
    Figure 3:  Urinary sodium excretion (Na24, in mmol) during the trial (N= 150);
error bars represent standard errors of the means (SEM).
The observed decrease in natriuria was reflected in a significant BP decrease (Table 2).
    Blood pressure (mean ± SD)
    Start
    1 month
    2 months
    Difference*
    ANOVA (P)


    Systolic
    143.0 ±19.8
    140.3 ± 17.9
    140.4 ±17.5
    - 2.6
    0.0095


    Diastolic
    84.4 ± 9.7
    82.8 ± 9.3
    82.5 ± 8.7
    - 1.9
    0.0005


    Mean
    104,0 ± 12.2
    102.0 ± 11.3
    101.8 ±10.9
    - 2.2
    0.0005


    *Mean    difference between the BP values at the start and 2 months later.
Table 2: Blood pressure levels (in mm Hg) during the trial (N= 150).
Gender differences
The observed level and reduction in Na24 differed by gender. At the inception of this trail men had significantly higher natriuria than women, and this discrepancy remained throughout the study (Table 3; Figure 4).
    Gender
    0 months
    1 month
    2 months
    Difference
    ANOVA*


    Men (N=73)
    222.5 ± 84.8
    204.3 ± 64.0
    199.9 ± 60.5
    22.6
    P<0.001


    Women (N= 77)
    196.1 ± 70.1
    180.7 ± 57.5
    175.8 ± 51.8
    20.3
    P<0.001


    t test*
    P<0.001
    P<0.001
    P<0.001


    *ANOVA refers to the rows, and the t- test to the columns.
Table 3: Value of natriuria by gender during study (mmol; mean ± SD)
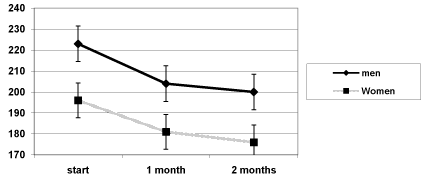
    Figure 4:  Sex differences in Na24 during study (in mmol; error bars are
SEMs).
Differences by intensity of intervention
When the participants were separately analyzed according to the intervention intensity (i.e. only persuasion + leaflet: intervention 1, or persuasion + leaflet + stickers: intervention 2), a similar but significantly greater decrease in Na24 was observed in group 2. Indeed, with the less intensive intervention (group 1) the starting Na24 averaged 207.1 ± 71.0 mmol, decreasing after 1 month to 203.4 ± 59.9 mmol, and 2 months later to 200.4 ± 58.5 mmol. The reduction of about 7 mmol turned out statistically insignificant (F= 1.946, P= 0.147). In the group with more intensive intervention, Na24 from 211.2 ± 85.2 mmol decreased to 182.6 ± 62.6 mmol after 1 month (P= 0.04), and to 176.4 ± 54.5 mmol after 2 months (F= 27, 22; P< 0.001), as shown in Figure 5.
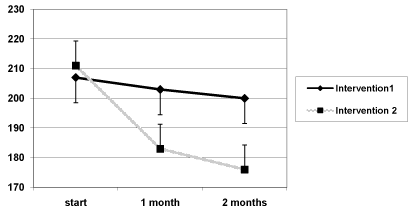
    Figure 5:  Natriuria (Na24 in mmol) depending on the intensity of the
intervention (error bars are SEMs).
Similar, although less pronounced alterations were observed in BP. At the beginning of the trial the average systolic BP in group 1 was 143.7 ± 18.1/84.1 ± 8.9 mm Hg. After two months it decreased to 143.3 ± 18.5/83.2 ± 8.9 mm Hg. This tiny reduction by 0.4/0.9 mm Hg was statistically insignificant (F= 0.546; P= 0.580). The starting systolic BP in group 2 was 142.9 ± 20.6/84.7 ± 10.3 mm Hg. After two months it dropped to 137.6 16.1/81.8 ± 8.5 mm Hg. This reduction, by some 5.3/2.9 mm Hg, was statistically significant (F= 17.14; P< 0.001). A similar trend was observed for the diastolic and for the mean BP.
The registered decrease in Na24 during the study positively correlated with BP lowering (r² = 0.599; P<0.001).
Discussion
The participants in this trial were hypertensive patients treated in family medicine. Although all hypertensives in southern Europe family practice are warned about the harmfulness of excessive salt intake, the consumption is still very high, around 12 g per day. The study was designed to evaluate the possible effects of intensified warning about the harmful effects of excessive salt intake, and comparing two levels of emphasized caveats in terms of urinary sodium excretion and blood pressure control. Less intensive warning consisted of information, persuasion and distribution of relevant leaflets, and more intensive warning added to those measures stickers about harmful effects of excessive salt The average daily sodium excretion (24Na) before the intervention was about 209 mmol (12,3 g of salt). The investigated interventions resulted in considerable reduction in daily salt intake to 188 mmol (11g NaCl) and a significant reduction in arterial pressure, by some 3/2 mm Hg after two months.
The male participants had significantly higher 24Na. This difference was expected because men have higher food and salt intake (heavier outdoor work, higher fast food intake, larger body mass). After the intervention both sexes reduced their daily intake, but the difference persisted throughout the study.
More intensely warned patients (labels) achieved a significantly greater reduction Na24: about 35 vs. 7 mmol Na, with a further BP decrease. Better antihypertensive effect was not expected since the trial participants were only hypertensive patients taking already 2-3 antihypertensive agents.
This study has several limitations. The relatively brief effect of salt intake warning may not be extrapolated to any longer period of time. Moreover, at least a part of the achieved results could be attributed to regression towards the mean phenomenon, to the placebo effect or to the Hawthorne effect [20]. Nevertheless, the obvious difference between more intensive and less intensive warning favors the conclusion that the described outcome is a real result of the intervention. Furthermore, although significant, achieved was only partial reduction in salt intake, being still markedly above the recommended values. Obviously, such an intervention can not completely correct the dietary habits of the target population, but with persistence, continuous support and other complementary measures it may noticeably contribute to the desired reduction in salt intake and improvement in hypertension control.
References
- He FJ, Li J, Macgregor GA. Effect of longer term modest salt reduction on blood pressure: Cochrane systematic review and meta-analysis of randomised trials. BMJ. 2013; 346: f1325.
- WHO. Global atlas on cardiovascular disease prevention and control. Geneva: WHO, 2011.
- Guilbert JJ. The world health report 2002 - reducing risks, promoting healthy life. Educ Health (Abingdon). 2003; 16: 230.
- Kearney PM, Whelton M, Reynolds K, Muntner P, Whelton PK, He J. Global burden of hypertension: analysis of worldwide data. Lancet. 2005; 365: 217-223.
- Calhoun DA, Jones D, Textor S, Goff DC, Murphy TP, Toto RD, et al. Resistant hypertension: diagnosis, evaluation, and treatment: a scientific statement from the American Heart Association Professional Education Committee of the Council for High Blood Pressure Research. Circulation. 2008; 117: 510-526.
- Verhave JC, Hillege HL, Burgerhof JG, Janssen WM, Gansevoort RT, Navis GJ, et al. Sodium intake affects urinary albumin excretion especially in overweight subjects. J Intern Med. 2004; 256: 324-330.
- Antonios TF, MacGregor GA. Salt intake: potential deleterious effects excluding blood pressure. J Hum Hypertens. 1995; 9: 511-515.
- Martini LA, Cuppari L, Colugnati FA, Sigulem DM, Szejnfeld VL, Schor N, et al. High sodium chloride intake is associated with low bone density in calcium stone-forming patients. Clin Nephrol. 2000; 54: 85-93.
- Tsugane S. Salt, salted food intake, and risk of gastric cancer: epidemiologic evidence. Cancer Sci. 2005; 96: 1-6.
- He FJ, Marrero NM, MacGregor GA. Salt intake is related to soft drink consumption in children and adolescents: a link to obesity? Hypertension. 2008; 51: 629-634.
- Mattes RD, Donnelly D. Relative contributions of dietary sodium sources. J Am Coll Nutr. 1991; 10: 383-393.
- Zhai FY, Yang XG. Report of National Nutrition and Health Survey of China Residents in 2002. Part 2: diet and nutrition intake. Beijing: People’s Health Press, 2006.
- Sarno F, Claro RM, Levy RB, Bandoni DH, Ferreira SR, Monteiro CA. [Estimated sodium intake by the Brazilian population, 2002-2003]. Rev Saude Publica. 2009; 43: 219-225.
- Lee HS, Duffey KJ, Popkin BM. Sodium and potassium intake patterns and trends in South Korea. J Hum Hypertens. 2013; 27: 298-303.
- Miškulin M, Dumancic G, Dumic A, et al. Salt intake in the Croatian adult population: implications for the public health. Second International Symposium on Hypertension. Osijek, 2010.
- Rumboldt Z. [Less salt--more health]. Lijec Vjesn. 2009; 131: 166-167.
- Premužic V, Erceg I, Jovanovic A, et al. Salt intake in adults. Second International Symposium on Hypertension. Osijek, 2010. Accessed on February 22, 2015.
- Rumboldt M, Petric D. Academic cooperation in family medicine: a viewpoint from Split. Acta Med Acad. 2014; 43: 69-75.
- Clark AJ, Mossholder S. Sodium and potassium intake measurements: dietary methodology problems. Am J Clin Nutr. 1986; 43: 470-476.
- Sedgwich P. The Hawthorne effect. BMJ 2012; 344: d8262.