Abstract
Daily Management System (DMS) is a quality improvement tool based on daily team meetings and visual management with input from physicians, nurses, clerical staff, and management to facilitate a data driven; action oriented, engaged, and empowered team of problem solvers. The team identifies performance metrics, sets goals, uses problem solving skills, implements small changes, and measures impact of those changes. We provide an introduction to DMS and describe our experience in a primary care practice located in the Behavioral Health building of a large urban public hospital. These efforts resulted in an increase in first appointment of the day starting on time from 3% in September 2014 to 58% in September 2015. Our efforts to decrease No Show Rate have resulted in modest success to date (50% to 40%). Our problem solving process has resulted in improved understanding of the issues involved and revealed new potential solutions. Our experience demonstrates the feasibility of implementing DMS in a primary care setting and supports the hypothesis that DMS is a cost effective tool that can be used to identify and improve key performance metrics. These tools and lessons learned can serve as a starting point for any practice looking to implement a similar quality improvement process.
Keywords: Continuous Quality Improvement; Daily Management System
Abbreviations
DMS: Daily Management System; PCB: Process Control Board
Introduction
All practices face common management challenges that contribute to low productivity while reducing the satisfaction of both providers and patients. Our Behavioral Health Primary Care Clinic was established in 2011 with the goal of improving access to primary medical care for patients receiving Behavioral Health Services in a large urban public hospital. Multiple studies have highlighted the health disparities for individuals with mental illness and substance use including reduced life expectancy compared to the general population [1-3]. Premature mortality is most often associated with comorbid medical conditions such as cardiovascular disease. While modifiable risk factors including smoking and obesity are more prevalent in the population seeking Behavioral Health Services, these individuals often fail to access appropriate prevention and treatment. A three-month analysis of referrals of our Behavioral Health patients to the main hospital’s Primary Care Clinic confirmed that 88% of individuals referred were not successfully linked to care.
With this in mind, our Behavioral Health Primary Care Clinic was designed to provide care in a convenient location with providers trained and dedicated to working with this complex population. The clinic now serves approximately 800 individuals ages 24-70 and majority African American and Caribbean. All are receiving Behavioral Health Services at our hospital for a range of psychiatric disorders including psychotic disorders, mood disorders, and substance use disorders. Collocation, however, did not fully solve these problems and further effort was needed to improve financial viability, and patient outcomes.
Our clinic continued to face common challenges. There was dissatisfaction among staff and patients regarding long wait times. A preliminary analysis revealed that the first appointments of the day were starting more than 15 minutes late 97% of the time. When the first appointment of the day starts late, a provider can spend the entire session trying to catch up. No show rates were averaging about 50%. Missed appointments contribute to medical vulnerability, reduced access, increased staff effort for rescheduling appointments, and reduced productivity and revenue [4,5]. Reminder calls can be easily implemented and have been associated with improved attendance in comparison with no reminder and postal-reminders [6,7]. The challenge was to easily monitor the implementation of such an intervention and insure that this intervention is effective in our specific patient population without investment of substantial resources.
Leadership was seeking a mechanism to prioritize improvement efforts and engage front line staff in the quality improvement process. An opportunity was identified to test Lean process improvement, specifically DMS, as a tool to address these challenges. We set out to demonstrate the feasibility of using DMS to clarify and improve key performance metrics.
Materials and Methods
DMS is a focused visual management structure that creates, accommodates, and sustains a culture of continuous improvement [8]. DMS facilitates a data driven; action oriented, engaged and empowered body of problem solvers focused on eliminating waste and improving process. True continuous improvement activity happens every day, at any time, by anyone and everyone. DMS makes performance management visible and transparent through daily monitoring of performance metrics tied to organizational goals. DMS, based in the principals of Lean process improvement, makes it possible to facilitate the elimination of waste and process variation [9,10]. Lean process has been successfully applied to medical settings, including Behavioral Health [11]. DMS hinges on staff empowerment and fosters teamwork among staff at all levels, continuously improving their delivery of patient care. It brings problem solving and process improvement as close as possible to the point of impact by engaging the whole team in identifying and solving barriers to providing the best patient care and by providing managers with tools to coach staff and align work to incremental progress towards organizational goals.
DMS Team Members are front line staff working in the clinical area including doctors, nurse practitioners, nurses, nursing assistants, administrative, and clerical staff. Five process improvement metrics were selected by the team, with input from leadership, to insure alignment with institutional goals. Each metric is “owned” by an assigned team member responsible for the collection and recording of data. Daily briefs are conducted in front of the DMS Board at the beginning of each workday, led by a designated team leader, and lasting no longer than 10 minutes (Figure 1). Metrics are selected that are relevant to improving patient care delivery activities in five main categories: Human Development, Quality and Safety, Timeliness and Delivery, Finances (Costs and Revenue), and Growth and Capacity. Improvements in any of these areas would yield the most gain and/ or eliminate the most waste in the process. Metrics, tailored to the processes of the unit within these categories, are updated daily, and trended over time against specific measurable goals. Each daily huddle focuses on one of the five selected metrics in a weekly rotation. Supervisors attend weekly to observe the process, ensure maintenance of the board, and assist with addressing any barriers. This requires a significant time investment up front, but once the board is running, staff is involved for 10-20 minutes per day. The financial cost for materials to build and install the board is less than five hundred dollars.
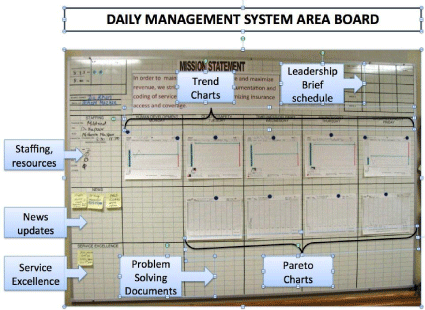
Figure 1: Sample Daily Management System Board.
Process Control Boards (PCB’s) are paper tools used for simple data gathering to support the metrics as the work is happening “in the moment”. Data, gathered during the day onto the PCB’s, is summarized at the end of the workday and plotted onto the metric trend chart (Figure 2). Fall-outs or instances when the goals were not reached are accounted for and explained on the corresponding metric Pareto chart. Trend charts, Pareto charts and metrics are all organized onto the DMS board, and utilized as visual tools to aid in the daily discussions of the unit’s progress.
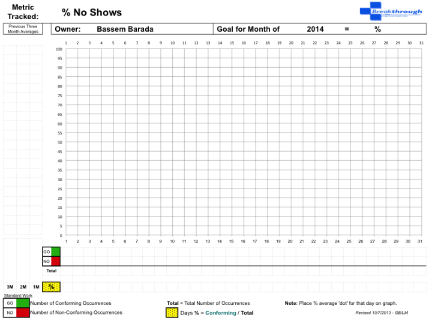
Figure 2: Metric Trend Chart Template.
With a disciplined Daily Management System, the staff is constantly looking for ways to make their process better. These are not a few big-ticket items, but rather many small local changes. DMS delivers a structured approach to solve problems as well, with the team identifying the root cause of the problem and coming up with solutions to improve their process. The problems tackled are small in scope so as to assist the team in coming up with simple solutions that are easy to implement and sustain. The team uses Pareto charts to analyze the frequency of problems in their process and the likely direct causes. Problem solving tools, such as the “5 Whys” (described in detail later), are used to drill down from the “Direct Cause” (or symptom) to unearth the “Root Cause”. Once the root cause is identified, solutions to the “Real Problem” can be explored, and tweaks to the process put in place that will severely reduce if not eliminate the problem. Thus daily problem solving enables continual improvement.
Leadership are connected to the process improvements weekly, as they come to the DMS board and are briefed on the unit’s progress on their metrics and problem solving efforts. This is management’s opportunity to coach and support the team’s efforts and to ensure alignment with the greater organizational goals. Sustainable improvement is not possible without the support and encouragement of leadership.
Here we discuss the use of DMS from April 2014 to October 2015 to understand and problem solve common practice management challenges, focusing on first appointment of the day starting late and high no show rates.
First appointment of the day
First Appointment Starting on Time, defined as both the patient and provider being in the room within 15 minutes of the scheduled appointment time, was chosen as a metric in alignment with the core DMS objective of Timeliness and Delivery. First Appointment Starting on Time leads to better patient flow and in turn to patient satisfaction, a focus in every healthcare setting. All patients are instructed to arrive 15 minutes earlier than their scheduled appointment time so that their pre-encounter activities can occur in advance of the scheduled visit time. In April 2014, before introduction of DMS, our baseline for First Appointment Starting on Time was only 3%. We created a PCB for each provider to collect data in real time, allowing us to react sooner to a developing trend (Figure 3). What was quickly learned from our trend chart (Figure 4) and Pareto analysis (Figure 5) was that the most common reason for a first appointment not starting on time was that the patient was late or that the patient was a no show. Less frequently, the cause was the provider not being available or that the patient was still involved in the registration process or having labs or diagnostic tests done.
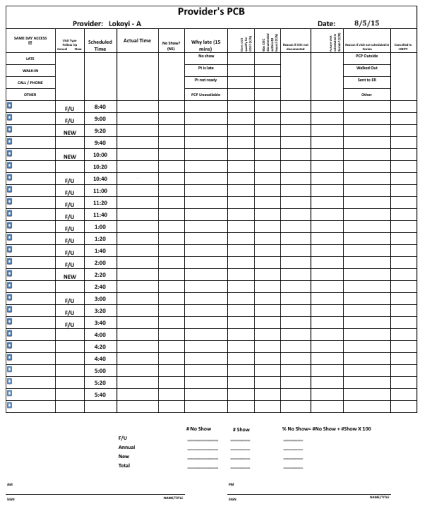
Figure 3: Provider Process Control Board Template.
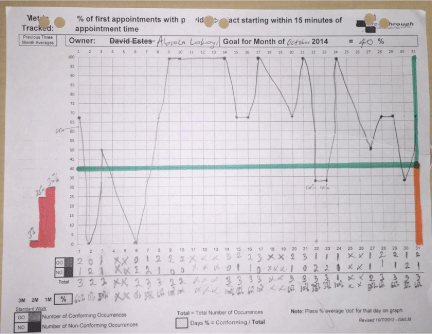
Figure 4: First Appointment Starting on Time Sample Trend Chart, October 2014.
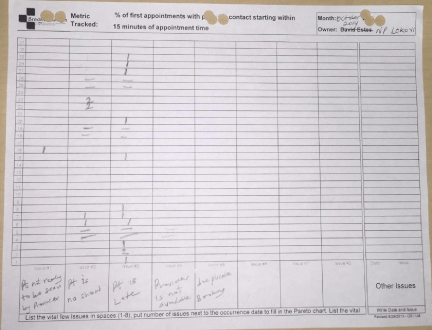
Figure 5: First Appointment Starting On Time Sample Pareto Chart, October 2014.
Various problem-solving interventions were designed and implemented by the team, all with some success. Key interventions in relation to the first appointment of the day starting on time are summarized in Figure 6. First, patients were given the choice to select the “First Appointment of the Day.” Providers and scheduling staff were instructed to engage patients in choosing this appointment with a conversation about the advantage that there would be no wait time, especially important if the patient had a job or school to attend. This had a positive impact on the patient experience as noted in verbal feedback and from August toSeptember 2014; we observed an increase from the baseline of 3% to 30% of first appointments starting on time.
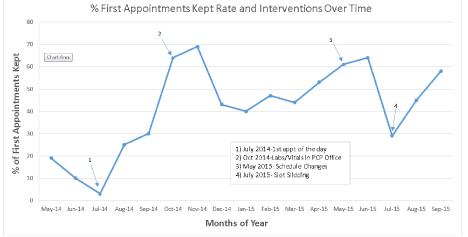
Figure 6: Percent of First Appointments Starting On Time and Key Interventions Over Time.
The next intervention was designed to minimize delays between check-in and starting a visit with the provider. The completion of labs and vital signs was moved from the lab suite to the provider’s office, allowing for the provider to start the visit simultaneously with nursing tasks. This further improved our on time rate to 64% by October 2014. From November 2014 through June 2015, with maintenance and refining of these interventions, First Appointment on Time rates remained between 40% and 60%. During daily huddles, the team observed a correlation between low First Appointment Starting on Time and high No Show Rate and began to shift their problem solving focus towards this second metric, discussed further below.
In May 2015, we added evening hours to the practice and staggered provider schedules towards improving patient access and satisfaction, however, this lead to a drop in the First Appointment Starting on Time to 29%. This was due in part to the fact that we were unable to reach some patients to inform them of the change and reschedule. This was evident on our Pareto analysis showing an increase in “provider not available” as the cause of late appointment starts. This provides an illustrative example of the how the team quickly recognized the unintended consequences of a scheduling change. Through use of DMS, the team was able to quickly understandand solve this problem.
Problem solving by the team led to another successful solution that was named “slot sliding”. If the scheduled first patient of the day was not ready to be seen by the provider at the visit time, the next appointment for that provider was seen early. Then, as the first patient shows late, they fill the second slot that is now vacated. This allowed us to maintain a continuous, steady patient flow. Since starting this effort, we have once again seen a climb in our first appointments starting on time from 29% in July to 58% in September 2015.
No show rates
Prior to DMS implementationour baseline No Show Rate was greater than 50%. Further, analysis by the DMS team of fall-outs of First Appointment Starting on Time continued to indicate patient noshows as a leading cause (27% - 89% monthly). Therefore, the team has shifted its problem solving efforts towards the Growth and Capacity metric, No Show Rate. Using DMS, we created a system to track the no show rate on a daily basis and to identify which reasons to prioritize in our problem solving activities. Our clinic’s administrative manager serves as the metric owner. The process for tracking No Show Rate begins with a staff member tallying the total number of scheduled appointments and total number of no shows from the previous day that is recorded on the providers PCB’s. A No Show Rate is calculated by dividing no shows by total scheduled appointments. This metric is transcribed on the trend sheet every morning prior to the daily brief (Figure 7). A staff member subsequently calls each of the no shows to reschedule their appointment, also enquiring about why the patient was unable to attend his/her appointment and in each case places a tick in the appropriate reason box of our Pareto chart (Figure 8).
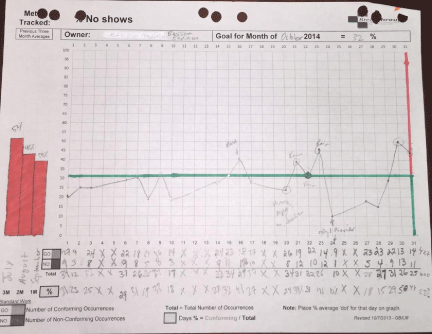
Figure 7: No Show Sample Trend Chart, October 2014.
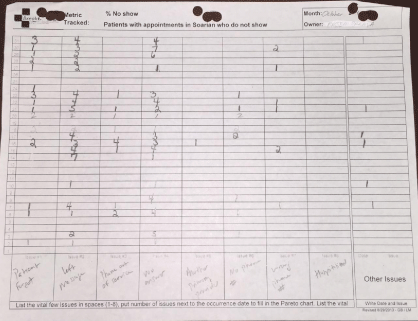
Figure 8: No Show Sample Pareto Chart, October 2014.
Key interventions and No Show rates over time are summarized in Figure 9. Our initial solution, in July 2014, was to introduce daily reminder calls the morning prior to a scheduled appointment to confirm or reschedule. We observed a reduction in the No Show Rate to 43% in August 2014. Although we were aware of several factors contributing to no shows, we were uncertain which of these should be the focus of corrective actions. The results of our Pareto analysis demonstrated that in the majority of cases (75%) we were unable to identify the reason for absence because the patient could not be reached; hence, the title of our first problem solving activity—‘For a majority of patients we don’t know why they don’t show up’. The metric owner and a team of clerical and clinical staff were assigned to the problem solving team. Our goal for the problem solving activity was to be able to reach patients to provide reminders and accurately assess for why they are missing appointments. We determined that a root cause for the problem was that our clerical staff did not have adequate direction with regard to the process of obtaining and updating demographic information including phone numbers. As a corrective action, we created a standardized script with which front desk staff would enquire about demographic information at the time of check in such that changes in contact information would be updated consistently in a timely manner.
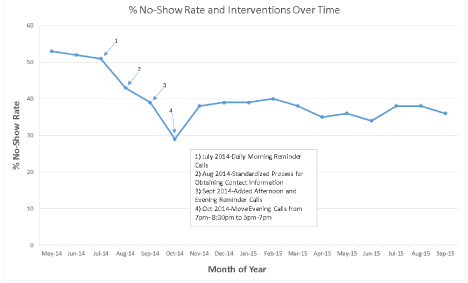
Figure 9: No Show Percent and Key Interventions Over Time.
By the end of August, we confirmed that our clerical staff were following the new process using front desk PCB’s; however, the No Show rate showed little change at 39%. We recognized that being unable to reach patients remained the primary barrier to success. The No Show Pareto indicated that in a significant proportion of cases we did now have accurate contact information, but patients were not answering their phones in the morning when reminder and no show calls were being made. We chose this barrier as the focus of our second problem solving activity which we called ‘Not able to reach patients due to calling at wrong time of day’. The root cause analysis using the “5 Why’s Method”, was as follows: ‘Not able to reach patient at 9am’ (proximate cause)—why?--> ‘Patient not available at time we call’—why?-->’The patients have other priorities and commitments ‘—why?-->’We do not know what is the best time to call them’—why?-->’We don’t ask patients what is the best time to call them.’ Our proposed solution was to begin calling patients whose appointments were not confirmed with the morning calls (9 to 11:00am) in the afternoons (3 to 5:00pm) and then to call again in the evening (7 to 8:30pm) if the appointment could not be confirmed with the afternoon call. Staff was also instructed to ask patients who are reached when they preferred to receive reminder calls. This information was recorded on a shared file so staff making reminder calls for the next appointment could access it. We implemented this more robust reminder system consistently throughout the month of October 2014 with the result of increasing the rate at which patients were reached by 50% and reducing our no show rate from 43% in September to 29% in October 2014. In addition, many patients voiced appreciation for staff’s efforts to reach them and enquire about their preferences.
Having determined we can reach more of our patients and reduce the no show rate by making evening calls, we were faced with the dilemma of how to sustain the evening calls as the latest that staff normally work in our clinic is 6pm. To address this barrier, we were granted permission to assign the task of evening calling to clerical staff on a partner service, which remains open until 7pm. We were hopeful that making early evening calls between 5 and 7pm would be as successful as making calls after 7pm but this has not been the case; our no show rate has remained between 35 and 40% since November 2014.
We have since come to terms with the fact that we found a solution that could not be sustained with our current staffing structure. In October 2015, we began a new problem solving exercise titled ‘We are unable to reach patients to confirm next day appointments’. A nursing assistant serves as process owner and staff assigned to make reminder calls are on the team. The root cause analysis led to a new conclusion. Based on feedback received from the patients we have learned that many patients rely on text messaging for their communication and tend not to check voicemail. A recent systematic review concluded that text messaging reminders are at least as effective and may be more cost-effective than phone call reminders [12]. The team is currently developing a text messaging reminder system.
Discussion
Our experience demonstrates the feasibility of implementing DMS in a primary care clinic and further documents the utility of DMS as a cost effective tool that can be used to identify and improve key performance metrics. Our efforts resulted in an increase in a substantial increase in first appointment of the day starting on time (3% to 58%). Progress towards reducing the no show rate has been less dramatic (50% to 40%), however the team remains engaged in identifying gaps and potential solutions through their daily problem solving.
The DMS reporting format’s use of percentages rather than absolute numbers supports continuous progress towards a goal, but is one limitation in the interpretation of these findings. The unique nature of our practice, in an urban underserved community and serving individuals with significant behavioral health disorders, may limit the generalizability of these findings. We believe, however, that lessons learned from this challenging population with above-average barriers to accessing care can inform practices serving the general population where they might in fact be more successful.
Conclusion
DMS is an inexpensive, low-tech performance improvement tool based in the principals of Lean process improvement. Our experience demonstrates the feasibility of implementing DMS in a large public hospital primary care practice serving individuals with complex behavioral health and psychosocial needs. This experience can be easily translated into other practice settings and our lessons learned can serve as a guide for other practices looking to implement a similar approach.
References
- Piatt EE, Munetz MR, Ritter C. An examination of premature mortality among decedents with serious mental illness and those in the general population. Psychiatr Serv. 2010; 61: 663-668.
- Roshanaei-Moghaddam B, Katon W. Premature mortality from general medical illnesses among persons with bipolar disorder: a review. Psychiatr Serv. 2009; 60: 147-156.
- Walker ER, McGee RE, Druss BG. Mortality in mental disorders and global disease burden implications: a systematic review and meta-analysis. JAMA Psychiatry. 2015; 72: 334-341.
- George A, Rubin G. Non-attendance in general practice: a systematic review and its implications for access to primary health care. Fam Pract. 2003; 20: 178-184.
- Nuti LA, Lawley M, Turkcan A, Tian Z, Zhang L, Chang K, et al. No-shows to primary care appointments: subsequent acute care utilization among diabetic patients. BMC Health Serv Res. 2012; 12: 304.
- Perron NJ, Dao MD, Kossovsky MP, Miserez V, Chuard C, Calmy A, et al. Reduction of missed appointments at an urban primary care clinic: a randomised controlled study. BMC Fam Pract. 2010; 11: 79.
- Hasvold PE, Wootton R. Use of telephone and SMS reminders to improve attendance at hospital appointments: a systematic review. J Telemed Telecare. 2011; 17: 358-364.
- Mann, D. Creating a Lean Culture. Productivity Press; 3 edition. 2014.
- Cooper C. The Little Book of Lean. Create Space Independent Publishing Platform. 2012.
- Liker JK, Meir D. The Toyota Way Field book. McGraw-Hill Education. 2005.
- Merlino JP, Omi J, Bowen J. Lean Behavioral Health: The Kings County Hospital Story. Oxford University Press. 2014.
- Gurol-Urganci I, de Jongh T, Vodopivec-Jamsek V, Atun R, Car J. Mobile phone messaging reminders for attendance at healthcare appointments. Cochrane Database Syst Rev. 2013; 12: CD007458.
