Abstract
This study was aimed to determine the Role of CD4 receptor in diagnosis of AIDS.
Twenty apparently normal human subjects and 100 cases of different kinds of HIV /AIDS were included in this study. Their age ranged between below 29 to above 59 years. All these subjects were selected from Sanjay Gandhi Post Graduate Institute of Medical Sciences, Lucknow, India. Blood samples were collected from these volunteers in the sterilized vials and processed for CD4 Count using flow cytometry. Data were analyzed with statistical package (SPSS 16.0) software. Results were presented in simple tables with frequencies.
Mean age in both case and control groups are having slightly difference. Most of the CD4 +ve patients in the age less than 29 years while CD4-ve in age between 29-39 years. Females are more common among case group while males among control group. Most of the positive cases have CD4 cell count between 200-500. CD4 cell count ranged from 467.23 ± 291.34 (Group I(cases)), 716.15 ± 288.22 (Group II(control)). Statistically, this difference among groups was significant (p<0.05). The Age group distribution mean comparison of two groups was significant (p<0.05) in age group (Less than 29). There is a strong relationship between CD4 cell count values and Viral load (R=0.837). The Gender wise mean comparison of viral load in CD4 positive patients was found significant (p<0.05).
The study helps in early detection and monitoring of HIV. A viral load test measures how much human immunodeficiency virus is in the blood. Measuring the CD4 count by flow cytometry method to disease progression for HIV
Keywords: HIV; Diagnosis; CD4; Flow Cytometry; North India
Introduction
CD4 is a co-receptor that assists the T cell receptor (TCR) in communicating with an antigen-presenting cell. CD4 also interacts directly with MHC class II molecules on the surface of the antigenpresenting cell using its extracellular domain [1].
HIV-1 uses CD4 to gain entry into host T-cells and achieves this through its viral envelope protein known as gp120 [2]. The binding to CD4 creates a shift in the conformation of gp120 allowing HIV-1 to bind to a co-receptor expressed on the host cell. These co-receptors are chemokine receptors CCR5 or CXCR4. Following a structural change in another viral protein (gp41), HIV inserts a fusion peptide into the host cell that allows the outer membrane of the virus to fuse with the cell membrane.
HIV infection leads to a progressive reduction in the number of T cells expressing CD4 [3]. Medical professionals refer to the CD4 count to decide when to begin treatment during HIV infection. Normal blood values are usually expressed as the number of cells per microliter (or cubic millimeter, mm³) of blood, with normal values for CD4 cells being 500-1200 cells/mm³. A CD4 count measures the number of T cells expressing CD4. While CD4 counts are not a direct HIV test—e.g. they do not check the presence of viral DNA, or specific antibodies against HIV—they are used to assess the immune system of a patient. Patients often undergo treatments when the CD4 counts reach a level of 350 cells per microliter in Europe but usually around 500cpm in the US; people with less than 200 cells per microliter are at high risk of contracting AIDS defined illnesses. The newest National Institute of Health guidelines recommend treatment of any HIVpositive individuals, regardless of CD4 count. Medical professionals also refer to CD4 tests to determine efficacy of treatment [4].
This study was aimed to determine the Role of CD4 receptor in diagnosis of AIDS.
Materials and Methods
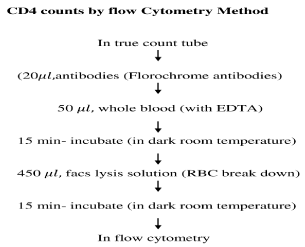
Twenty apparently normal human subjects and 100 cases of different kinds of HIV /AIDS were included in this study. Their age ranged between below 29 to above 59 years. All these subjects were selected from Sanjay Gandhi Post Graduate Institute of Medical Sciences, Lucknow, India. Blood samples were collected from these volunteers in the sterilized vials and processed for CD4 Count using flow cytometry as given in Figure 1. Data were analyzed with statistical package (SPSS16.0) software. Results were presented in simple tables with frequencies and percentages while statistical significance was taken to be p value =0.05.

Figure 1: CD4 count by flow cytometry method.
Results
In the present study all the parameter was investigated in the subjects of normal control and HIV patients. Mean age in both groups are having slightly difference in both groups and the median value is same in both groups (Table 1).
    Cases (N=100)
    Control (N=20)


    Mean
    SD
    Min
    Max
    Range
    Median
    Mean
    SD
    Min
    Max
    Range
    Median


    33.45
    13.052
    18
    60
    42
    29.5
    34.34
    13.31
    18
    65
    47
    29.5
Table 1: Descriptive table of Age in both groups.
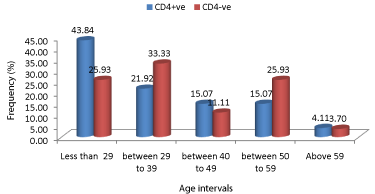
Frequency distribution of Age intervals according to CD4 positivity in case groups are summarized in Figure 2. Statistically, this percentage difference among groups was not significant (p>0.05).

    Figure 2: Distribution of age at different intervals with CD4 positivity in case
group.
Frequency distribution of Age intervals according to CD4 positive patients in different CD4 cell count categories in cases groups are summarized in Table 2.
    Age
    Cases (N=100)


    CD4 +ve (n=73)


    Less than 200
    between 200 to 500
    Greater than 500


    N
    %
    N
    %
    N
    %


    Less than 29
    8
    40
    18
    51.43
    6
    33.33


    between 29 to 39
    5
    25
    6
    17.14
    5
    27.78


    between 40 to 49
    3
    15
    5
    14.29
    3
    16.67


    between 50 to 59
    3
    15
    5
    14.29
    3
    16.67


    Above 59
    1
    5
    1
    2.86
    1
    5.56


    Applied c2 test for significance, P-value =    0.979.
Table 2: Distribution of age at different intervals with CD4 cell count groups of
CD4 positive patients in Case group.
Frequency distributions of Gender in both groups are summarized in Table 3. Statistically, this percentage difference among groups was significant (p<0.05).
    Gender
    Cases (N=100)
    Control (N=20)


    N
    %
    N
    %


    Male
    37
    37
    15
    75


    Female
    63
    63
    5
    25
Table 3: Gender Distribution in both groups.
Frequency distribution of Gender according to CD4 positivity in cases group is summarized in Table 4. Statistically, this percentage difference among groups was significant (p<0.05).
    Gender
    Cases (N=100)


    CD4 +ve (n=73)
    CD4 -ve (27)


    N
    %
    N
    %


    Male
    30
    41.10
    12
    44.44


    Female
    43
    58.90
    15
    55.56


    Applied c2 test for significance, P-value =    0.042*, *Significant.
Table 4: Gender distribution in CD4 positivity in Case group.
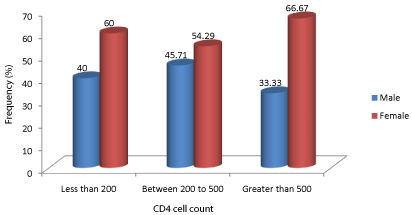
Frequency distribution of Gender according to CD4 positive patients according to CD4 cell count categories in cases group are summarized in Figure 3.

    Figure 3: Gender distribution with CD4 cell count groups of CD4 positive
patients in case group.
Frequency distribution of Gender with age category according to CD4 positive patients in cases group are summarized in Table 5. Statistically, this percentage difference among groups was not significant (p>0.05).
    Gender
    Age Category
    CD4 +ve (n=73)
    CD4 -ve
      (n=27)
    P_value


    N
    %
    N
    %


    Male
    Less than 29
    14
    19.18
    5
    18.52
    0.071


    between 29 to 39
    12
    16.44
    3
    11.11


    between 40 to 49
    4
    5.48
    2
    7.41


    between 50 to 59
    0
    0.00
    2
    7.41


    Above 59
    0
    0.00
    0
    0.00


    Female
    Less than 29
    18
    24.66
    3
    11.11
    0.380


    between 29 to 39
    4
    5.48
    5
    18.52


    between 40 to 49
    7
    9.59
    1
    3.70


    between 50 to 59
    11
    15.07
    5
    18.52


    Above 59
    3
    4.11
    1
    3.70


    Applied c2 test for significance.
Table 5: Frequency distribution of gender and age intervals according to CD4
positive patients.
The CD4 cell count mean comparison of two groups is summarized in Table 6. CD4 cell count ranged from 467.23 ± 291.34 (Group I(cases)), 716.15 ± 288.22 (Group II(control)). Statistically, this difference among groups was significant (p<0.05).
    Cases
    Control
    p_value


    Mean
    SD
    Mean
    SD


    CD4 count
    467.23
    291.34
    716.15
    288.22
    0.001*


    Applied unpaired t test for significance,    *Significant.
Table 6: Mean comparison of CD4 cell count in both groups.
The Gender wise mean comparison of two groups is summarized in Table 7. Statistically, this difference among groups was significant (p<0.05) in male and female.
    Gender
    Cases
    Control
    p_value


    Mean
    SD
    Mean
    SD


    Male
    436.43
    283.50
    658.54
    273.34
    0.012*


    Female
    485.32
    296.59
    889.00
    288.57
    0.004*


    Applied unpaired t test for    significance, *Significant.
Table 7: Mean comparison of Gender in both groups.
The Age group distribution mean comparison of two groups is summarized in Table 8. Statistically, this difference among groups was significant (p<0.05) in age group (Less than 29).
    Age Groups
    Cases
    Control
    p_value


    Mean
    SD
    Mean
    SD


    Less than 29
    456.80
    271.25
    674.60
    294.45
    0.0326*


    between 29 to 39
    431.37
    290.21
    618.80
    191.81
    0.236


    between 40 to 49
    486.25
    346.22
    725.00
    438.40
    0.401


    between 50 to 59
    476.80
    341.71
    888.5
    207.18
    0.144


    Above 59
    564.88
    314.47
    1256
    NA
    NA


    Applied unpaired t test for    significance, *Significant.
Table 8: Mean comparison of Age interval in both groups.
The Table 9 reports the strength of the relationship between the CD4 cell count and the dependent variable viral load. R, the multiple correlation coefficients, is the linear correlation between the observed and predicted values of the dependent variable viral load. Its large value indicates a strong relationship between CD4 cell count values and Viral load (R=0.837). If R value is small then it takes large errors. For R square 0.701, nearly one third the variation in viral load is explained by the independent variable cd4 cell count.
    R
    R Square
    Adjusted R Square
    Std. Error of the Estimate


    0.837
    0.701
    0.697
    16495.586
Table 9:  Linear Correlation of viral load and CD4 cell count values in CD4
positive patients of treatment group (n=73).
The ANOVA table reports a significant F statistic (F value=166.71; P value = <0.001) consider extremely significant.
The Gender wise mean comparison of viral load in CD4 positive patients of treatment group are summarized in Table 10. Statistically, this difference between males and females was found significant (p<0.05).
    Male
    Female
    p_value


    Mean
    SD
    Mean
    SD


    Viral load
    50103.10
    30111.83
    63297.47
    36133.31
    0.032*


    Applied unpaired t test for    significance, *Significant.
Table 10:  Mean comparison of viral load distribution according to Gender in CD4
positive patients in treatment group (n=73).
Discussion
Most of the CD4 +ve patients in the age less than 29 years while CD4-ve in age between 29-39 years. Most of the positive cases have CD4 cell count between 200-500. These findings are consistent with other study carried out by Balogun et al. [5].
Females are more common among case group while males among control group. CD4 cell count ranged from 467.23 ± 291.34 (Group I(cases)), 716.15 ± 288.22 (Group II(control)) similar to the study carried by Bussmann et al. [6].
There is a strong link between increases in viral load and CD4 cell count loss in HIV-infected patients similar to other study carried out by Carter et al. [7].
The Gender wise mean comparison of viral load in CD4 positive patients was found significant.
Conclusion
The study helps in early detection and monitoring of HIV. A viral load test measures how much human immunodeficiency virus is in the blood. Measuring the CD4 count by flow cytometry method to disease progression for HIV.
References
- Barnett D, Walker B, Landay A, Denny TN. CD4 immunophenotyping in HIV infection. Nature Reviews Microbiology. 2008; 6: S7-15.
- Wilen CB, Tilton JC, Doms RW. HIV: cell binding and entry. Cold Spring Harbor perspectives in medicine. 2012; 2: a006866.
- Okoye AA, Picker LJ. CD4+ T-cell depletion in HIV infection: mechanisms of immunological failure. Immunological reviews. 2013; 254: 54-64.
- Zeitlmann L, Sirim P, Kremmer E, Kolanus W. Cloning of ACP33 as a novel intracellular ligand of CD4. J Biol. 2001; 276: 9123- 9132.
- Balogun TM, Okokon M, Dasola F, Oyetubosun EJ, Abimbola A, Bonaventure B. Cryptococcal Antigenaemia among Treatment-Naïve Adult HIV-Infected Nigerian Patients. World Journal of AIDS. 2016; 6: 1.
- Bussmann H, Wester CW, Masupu KV, Peter T, Gaolekwe SM, Kim S, et al. Low CD4+ T-lymphocyte values in human immunodeficiency virus-negative adults in Botswana. Clinical and diagnostic laboratory immunology. 2004; 11: 930-935.
- CD4, viral load & other tests.
