
Research Article
Austin Food Sci. 2016; 1(1): 1002.
Effects of a Ceramic Oven Coating on Baking Results
Zettel V*, Hecker F and Hitzmann B
Department of Process Analytics and Cereal Science, University of Hohenheim, Germany
*Corresponding author: Zettel Viktoria, Department of Process Analytics and Cereal Science, Institute of Food Science and Biotechnology, University of Hohenheim, Germany
Received: January 22, 2016; Accepted: February 11, 2016; Published: February 15, 2016
Abstract
With the performed baking experiments it was investigated, if by coating internal surfaces of the oven chamber with an efficient ceramic will provide savings in energy costs or an improved product quality. The experiments were performed with bread rolls and rye-wheat-bread. All products were baked at same baking temperatures (conditions) in ovens with and without ceramic coating of internal surfaces of the oven chamber. The end of the baking process was determined based on the surface color by visual inspection. A significant reduction of baking time and a reduction of baking losses in the ceramiccoated oven chamber were determined. The volume yield was not significantly increased; presumably this is due to other parameters for the preparation of dough pieces, the final proof and baking. Since our own recipes and baking programs were used, the comparison with the data from the existing literature is not always given. The energy consumption could be reduced mostly through the baking time up to 36 %. The development of surface color of bread rolls differ from the 5th minute on. The color curve of baked bread rolls in the ceramiccoated oven chamber increased faster and, therefore, the final color was reached significantly earlier.
Keywords: Baking; Infrared radiation; Texture analysis; Retrogradation; Differential scanning calorimetry; Color
Introduction
During baking processes heat energy is transferred into baking products. This happens by conduction from the bottom of the oven, by convection through the air, condensation of steam and thermal radiation. Depending on the temperature of the emitter, principally heat radiation contains high amounts of infrared, visible and ultraviolet light [1-3]. At typical baking temperatures, the thermal radiation consists mainly of infrared radiation. It is in the wavelength range between 780 nm up to 1 mm. Since 2006 different baking ovens with a special ceramic coating of internal surfaces of the oven chamber are available on the market. It is a special ceramic coating that is said to increase the percentage of infrared heat during the baking process from 30 % to 90%. The special ceramic coating operates in the wavelength range between 3 μm and 6 μm. The coating is placed at the overhead wall of the oven. The inventing company wanted to create an infrared radiation, which is, depending on the application, adjusted to the absorption of water molecules and groups like -CH and -OH in baking goods. The maximum emission intensity of the ceramics is obtained between the temperatures of 100 °C to 750 °C. The radiation intensity depends on the wavelength and temperature. The connection could be described by Wien’s displacement rule. This law states, that for black bodies the wavelength for the maximum radiation is proportional to the bodies’ temperature. A piece of dough is consequently absorbing, emitting and reflecting electromagnetic radiation [2,4]. The penetration depth of near infrared radiation with a wavelength of 1 μm is about 4 mm - 6 mm [5]. Wade [6] determined that near infrared radiation with an emission maximum of λ = 1.2 μm is suitable to decrease baking times of cookies. Skjoldebrand and Andersson [7] compared infrared baking with baking of breads in conventional ovens and concluded that 6 min in an infrared oven are equal to 16 min in a conventional oven at 230 °C. Further work was carried out by Purlis [8] to optimize infrared heating in combination with natural thermal radiation and convection. The baking time could be reduced by the higher amount of applied infrared radiation. The big advantage of infrared radiation here is the low penetration depth, so the traditional baking process remains the same. Only a time reduction takes place without extensive baking losses and different characteristics in the resulting end product. The effects of baking time reduction on bread crumb properties were also investigated by Bosmans et al. [9].
Ploteau et al. [10] investigated the baking of French baguette with lower temperatures, but higher infrared radiation within the same baking times compared to a conventional oven. The goal was to expose the dough to the same amount of energy. The validation of the hypothesis that the same amount of energy directed to the surface of the dough will lead to the same transformation within the dough roll remains to be done. But the energy consumption of the baking oven was reduced by 20 %. Beside temperature and wavelength the state of the material of the oven plays an important role in heat transfer with radiation. The infrared radiation is said to penetrate the dough piece in a better way and heat it from the inside faster than in conventional radiation ovens. The pasting and therefore the formation of a fine elastic crumb needed less time and more water is preserved in the baked good. This is obvious regarding the moisture content and therefore the freshness of the baked good. The second part of the baking process (browning, stabilization of the crust) is the same as in a conventional oven. The baking process is completed in less time, because of the faster heating and crumb formation and the raw material and valuable substances of the dough are gently treated. To achieve good baking results the manufacturer proposes a 30 °C higher baking temperature, depending on the baking good. This entails a completely different baking process compared to conventional ovens. Patel et al. [11] evaluated the effects of different baking processes on the bread firmness and starch properties in bread crumb. For this purpose they recorded the temperature profile inside the dough during baking. Higher heating rates, due to different oven systems, during the baking processes lead to higher crumb firmness after 15 days of storage. According to the manufacturer reductions in baking time between 20 % and 50 % can be achieved. However, Purlis [12] found out, that there is an internal resistance to heat transfer during the transformation from dough to bread. The end of the baking process, which is given by the complete transformation from dough to bread for instance, can be determined by the surface color development. This development has been studied by various authors [12,13]. Paquet-Durand et al. [14] worked on an on-line monitoring system which supplementary evaluated the volume development of bread rolls during the baking process. Higher baking yields can also be achieved using ceramic-coated oven chambers. Higher baking yields are due to higher masses of baked goods, which accompanies with higher moisture content. Higher moisture contents of baked goods are responsible for extended freshness. For the evaluation of the freshness of breads after storage or the amount of retrogradation differential scanning calorimetry and texture profile analysis are the most common methods [15-18].
With the performed baking experiments it was investigated, if a ceramic coating of internal surfaces of oven chambers will provide savings in energy costs or an improved product quality. The experiments were performed with bread rolls and rye-wheat-bread. To our knowledge no studies on this ceramic coating have been performed with the proposed products. All experiments discussed here were performed in a multiple deck oven with two conventional and two ovens with ceramic coating of internal surfaces. To evaluate the reduction of baking time comparing baking experiments, with wheat bread rolls and rye-wheat bread were performed at same temperatures. For a better comparison, the evolution of color formation was fitted to a function.
Materials and Methods
Materials
The experiments were carried out with commercial wheat flour (type 550: 0.51 % - 0.63 % mineral content in dry matter, Rettenmeier GmbH und Co. KG, Horba.N., Germany), commercial rye-flour (type 1150: 1.11 % - 1.3 % mineral content in dry matter, SchapfenMuhle GmbH & Co. KG, Ulm-Jungingen, Germany), water, commercial yeast (Omas Ur Hefe, Fala GmbH, Buhl, Germany), baking improver (MeisterMarken Ulmer Spatz, Bingen am Rhein, Germany), hydrogenated peanut fat (BAKO, Ladenburg, Germany), starter (rye StartGut®, IsernHager GmbH & Co. KG, Isernhagen, Germany) and salt (Sudsalz GmbH, Heilbronn, Germany).
Bread rolls
The dough was prepared with 61.5 g water, 4 g fresh yeast, 1 g peanut fat, 3.5 g baking improver and 2 g salt per 100 g wheat flour (type 550, corrected to 14 % moisture content). All ingredients were mixed and kneaded in a spiral mixer (Diosna laboratory kneaders). The dough was processed in the common way for bread rolls (Figure 1). Proofing took place in a proofing chamber (WachtelStamm Petit Computer Proofing Chamber, Wachtel GmbH & Co., Hilden, Germany) at 32 °C and relative moisture of 80 % for 60 min. The bread rolls were baked at 235 °C upper temperature and 225 °C lower temperature with 12 s of steam injection (the initial upper heat: 235 °C, the lower heat: 240 °C) in a multiple deck oven (Piccolo I, Wachtel GmbH & Co., Hilden, Germany). The flue of the oven chamber was opened after 90 % of baking time to drag out the moisture. The baking time was 20 min for the conventional oven (conv oven) and 15 min for the internal surface ceramic-coated oven chamber (cc oven).
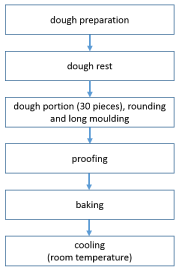
Figure 1: Scheme of the processing of wheat bread rolls.
The experiments for the bread rolls were carried out 7-fold per oven. During the baking process every 30 s pictures of the bread rolls were taken to track the color development (saturation) over the baking time [14]. After graphical evaluation and scaling (between 0 and 1) of the measurement data, they were fitted to the function presented in (Eq 1) using the least squares method. The aim was to have an easy function to display possible variations quick.
Here parameter a is the amount of the increase (saturation time constant) and parameter b is the time of the half slope of the scaled color saturation. The fitting was performed with two experimental data sets. The quality of the fitting was evaluated with the coefficient of determination for nonlinear functions.
Rye-wheat bread
The dough was prepared out of 70 g water, 1.8 g fresh yeast and 2 g salt per 100 g flour (rye flour type 1150, wheat flour type 550, ratio 70:30). All ingredients were mixed using a spiral mixer (Diosna laboratory kneaders). The dough was processed in the common way for rye-wheat breads. About 21.4 % of the rye flour was acidified. The sourdough was prepared with a dough yield of 220 and contains 10 % starter regarding the used amount of flour. Proofing took place in baking baskets in a proofing chamber at 32 °C and relative moisture of 80 % for 60 min. The breads were baked at 220 °C upper heat and 200 °C lower heat with 20 s of steam injection (the initial upper heat: 255 °C, the lower heat: 210 °C). The flue of the oven was opened after 90 % of baking time to drag out the moisture. The baking time was 70 min for the conv oven and 45 min for the cc oven. During baking the inner temperature of bread was determined exemplary.
Evaluation of the baking experiments
After cooling the bread rolls for 1 h and the rye-wheat breads for 4 h at room temperature, the mass and the volume, according to AACC Method 10-05 [19] were determined in order to be able to compare the effects of the different baking times and ovens. Baking loss and volume yield were evaluated. Other evaluations were partly performed after 24 h, 48 h, 72 h and 96 h as well.
Differential Scanning Calorimetry (DSC) was performed using a Perkin Elmer DSC 6 calorimeter. 0.25 g - 0.5 g bread crumb was weighted into 40 μL sample pans (wall thickness 15 μm) and hermetically sealed with a cover. The reference pan was empty. The measurement was performed with a heating rate of 10 °C/min from 25 °C to 90 °C; each sample was measured 3-6 times. The raw data was analyzed with the provided software (Perkin Elmer DSC 6 Version 1.01, 1994, Perkin Elmer, Massachusetts, USA) to obtain the energy difference between the sample and reference pan, which is the estimated gelatinization enthalpy ΔQ (J/g) in Joule per dry weight. The crystallization kinetics of starch are analysed by fitting the Avrami equation (Eq 2) to the experimental obtained data for the gelatinization enthalpy ΔQ at time zero (t = 0), t and infinity (∞) [17,18,20-22].
The fitting parameters are the rate constant k and the Avrami exponent n.
A texture analyser (TA-XT2, Stable Micro Systems, Surrey, England) was used with a modified AACC method (74-09) for texture profile analysis (TPA). Three slices (25 mm thickness) were taken from the centre of the sweet pan bread loafs. A standard 25 mm diameter probe and 5 kg load cell were used as measurement geometry. The three bread slices were two times compressed up to 40 % deformation with 15 s rest; the test speed was 1.7 mm/s. The bread crumb firmness and the elasticity were evaluated. The bread crumb firmness was the force measured at 40 % deformation.
Results and Discussion
Bread rolls
As presented in (Table 1) for mass, volume yields and baking losses of the bread rolls similar values in both ovens were obtained.
    conv oven
    cc oven


    volume yield [mL/g flour]
    8 ± 1
    8 ± 1


    baking loss [%]
    20 ± 1
    19 ± 1


    fitting parameters of the    colour saturation


    a [min]
    1.86 ± 0.07
    1.24 ± 0.08


    b [min]
    11.35 ± 0.14
    9.14 ± 0.24


    SQF[1]
    0.02
    0.02


    R² [1]
    > 0.99
    > 0.99
Table 1:  Results of the baking experiments for the bread rolls (Mean values and
standard deviations of 7 experiments); results of the fitting of the color saturation
of the bread rolls (Mean values and standard deviations, of 2 experiments); SQF:
sum of least squares, R²: coefficient of determination for nonlinear functions.
The end of the baking time in the cc oven (at 15 min) was determined visually. The conditions of illumination complicated the intentions to determine the exact same browning of the crusts. The crumb was fluffy and well formed in both cases, the crust color showed no differences. Consequently the energy intake in the cc oven was higher than in the conventional oven. The baking times in the cc oven were reduced up to 25 % at same baking temperatures compared to the conventional oven. The ceramic coating therefore lead to a higher energy intake, which is reduced to the higher amount of infrared radiation. This is in accordance with Skjoldebrand & Andersson [7] who evaluated the transmission, reflection and absorption of bread dough and breads during the baking process.
In (Figure 2) the development progression of the color saturation over the baking time in both ovens and the fitted functions are presented exemplarily. Variations of the color values, that could not be fitted, are obvious. The results of the fitting can be seen in (Table 1). The important parameter to compare both ovens is b, the value for the shift of the function along the half slope of the scaled color saturation. For the conventional oven b is t = 11.35 min, in the cc oven b is reached at t = 9.14 min. The cc oven is consequently 2 min faster regarding the color evolution compared to the conventional oven.
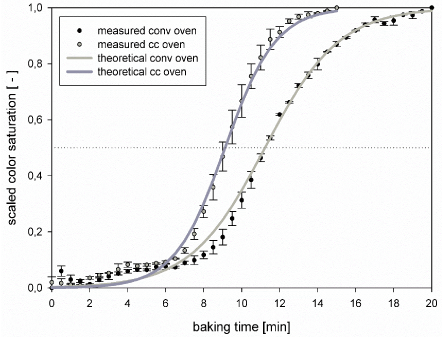
    Figure 2:  Development of the scaled color saturation for bread rolls and the
fitted function over time in the conventional and cc oven. Mean values and
standard deviations of two experimental data sets for each oven.
Parameter a, the amount of the increase (small values, steep rise), can be compared as well. The color saturation time constant averages 1.86 min in the conv oven, 1.24 min in the cc oven. This matches with the expectation that the cc oven should have a steeper gradient. With on-line image analysis and comparable conditions between the experiments, concerning camera settings and illumination, the same order of browning was obtained in both ovens. It is also obvious that the color saturation curves begin to show differences at the 5th minute of baking time.
Rye-wheat bread
The results of the rye-wheat bread evaluations are presented in (Table 2). With both ovens good baking results were obtained regarding the crumb structure and the crust formation.
    conv oven
    cc oven


    volume yield [mL/g flour]
    3 ± 1
    3 ± 1


    baking loss [%]
    17 ± 1
    13 ± 1


    moisture content [%]
    41 ± 2
    43 ± 2


    avrami exponent n [-]
    1.63
    1.38


    starch re-crystallization rate    k [1/minn]
    0.002
    0.005


    SQF[1]
    0.013
    0.011


    R² [1]
    0.98
    0.98
Table 2:  Results of the baking experiments for the rye-wheat breads; mean
values and standard deviations of 5 experiments, SQF: sum of least squares, R²:
coefficient of determination for nonlinear functions.
Regarding the crumb firmness presented in (Figure 3), after 2 h no differences are obvious, after 48 h the crumb firmness of breads baked in the cc oven were softer. The moisture content of the crumb (gravimetrical determined 2 h after baking) indicates no difference, these matches with the results of the texture analysis. During the baking process the core temperatures of the breads were recorded to get information about the inner heating process.
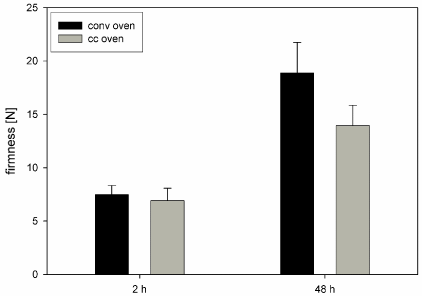
    Figure 3:  Results of the texture profile analysis of rye-wheat bread 2 hand
48 h after baking. Mean values and standard deviations of 5 breads for each
oven type.
In (Figure 4) the course of the core temperature during the baking process is presented. According to Purlis [12] the core temperature is a reliable variable to determine the end of the baking process. The food is completely baked when a lower temperature limit of 95 °C - 96 °C is achieved in the core of the product and the determination is not only based on the surface color development. The time to reach the maximum core temperature of 99 °C is 32 min in the cc oven, in the conventional oven 43 min are needed. This is a difference of 11 min, which leads to an acceleration up to 30 % of the baking process up to 30 %. The baking time is reduced from 70 min to 45 min which causes a reduction of the baking time of 36 %. There seems no difference in the heating rates. Compared with the results of the texture profile analysis, which revealed a softer bread crumb after storage the findings of this study are in accordance with Patel et al. [11]. A softer bread crumb after storage indicates less retrogradation of starch. Bosmans et al. [9] concluded that breads baked shorter resulted in less retrogradation, a less extended starch network and smaller changes in crumb firmness and elasticity as well as a lower migration of moisture from crumb to crust.
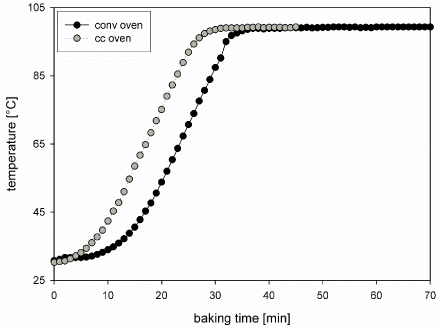
    Figure 4:  Exemplary temperature course of the inner rye-wheat breads
during baking.
The results of the DSC measurements are presented in (Figure 5), where the amount of energy to re-crystallize starch is higher for breads baked in the cc oven. The retrogradation of starch proceeds with storage time. There are slightly differences visible between the breads. Thus the results disagree, but there is also a negative correlation between these two measurements [18]. With additional water the firming rate of wheat bread decreases [23]. The difference in baking loss may lead to higher moisture content inside the rye-wheat breads baked in the cc oven.
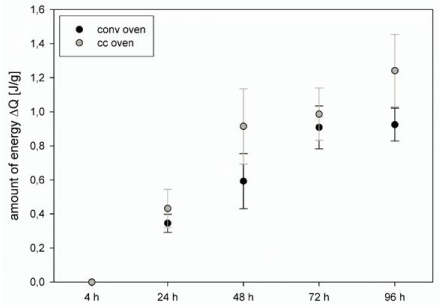
    Figure 5:  DSC measurements of one rye-wheat bread sample over 5
days. Mean values and standard deviations for the estimated gelatinization
enthalpy ΔQ (J/g) of at least 3 measurements for each time.
Conclusion
The ceramic coating of the internal surfaces of the oven chamber has a positive effect on the baking process regarding the time reduction. The increase of the infrared radiation transfers the heat energy faster into the bread crumb. Here especially the absorption of the water molecules is important. After excitation, the water molecules will transfer their energy also to its surroundings. However, one has to keep in mind that the penetration depth of the infrared radiation is just in the range of millimeter, so most parts of the crumb will not be reached directly.
The results show that there are no differences in the specific volume or volume yields. For rye-wheat breads the baking loss was reduced, but here the largest reduction of the baking time was obtained. The crumb firmness of the bread after 48 h was reduced significantly. The results clearly lead to the assumption that inside the ceramic-coated internal surfaces of oven chamber a higher amount of energy is transferred in shorter time. The investigation of the effects of the different heating rates on the dough/bread transformation will be the topic of future research.
References
- Lerner RG. Encyclopedia of physics. VCH, New York.1991.
- Lienhard JH. A heat transfer textbook. 4thedition. New York: Dover Publications. 2011.
- Smith PG. Introduction to food process engineering. 2ndedition. New York: Springer. 2011.
- Krishnamurthy K, Khurana HK, Soojin J, Irudayaraj J, Demirci A. Infrared Heating in Food Processing: An Overview. Comprehensive Reviews in Food Science and Food Safety. 2008; 7: 2-13.
- Pan Z and Atungulu GG. Infrared heating for food and agricultural processing. CRC Press. 2011.
- Wade P. Biscuit baking by near-infrared radiation. Journal of Food Engineering. 1987; 6: 165-175.
- Skjoldebrand C, Ellbjar C, Andersson CG, Eriksson TS. Optical properties of bread in the near-infrared range. Journal of Food Engineering. 1988; 8: 129-139.
- Purlis E. Optimal design of bread baking: Numerical investigation on combined convective and infrared heating.
- Bosmans GM, Lagrain B, Fierens E, Delcour JA. The impact of baking time and bread storage temperature on bread crumb properties. Food Chem. 2013; 141: 3301-3308.
- Ploteau JP, Glouannec P, Nicolas V, Magueresse A. Experimental investigation of French bread baking under conventional conditions or short infrared emitters. Applied Thermal Engineering. 2015; 75: 461-467.
- Patel BK, Waniska RD, Seetharaman K. Impact of different baking processes on bread firmness and starch properties in breadcrumb. Journal of Cereal Science. 2005; 42: 173-184.
- Purlis E. Bread baking: Technological considerations based on process modeling and simulation. Journal of Food Engineering. 2011; 103: 92-102.
- Zanoni B, Peri C, Bruno D. Modelling of browning kinetics of bread crust during baking. LWT - Food Science and Technology. 1995; 28: 604-609.
- Paquet-Durand O, Solle D, Schirmer M, Becker T, Hitzmann B. Monitoring baking processes of bread rolls by digital image analysis. Journal of Food Engineering. 2012; 111: 425-431.
- Gray JA and Bemiller JN. Bread Staling: Molecular Basis and Control. Food Science and Food Safety. 2003; 2: 1-21.
- Seetharaman K, Chinnapha N, Waniska D, White P. Changes in Textural, Pasting and Thermal Properties of Wheat Buns and Tortillas During Storage. Journal of Cereal Science. 2002; 35: 215-223.
- Russell PL. A kinetic study of bread staling by differential scanning calorimetry and compressibility measurements. The effect of added monoglyceride. Journal of Cereal Science. 1983; 1: 297-303.
- Beck M, Jekle M, Becker T. Impact of sodium chloride on wheat flour dough for yeast-leavened products. II. Baking quality parameters and their relationship. Journal of the Science of Food and Agriculture. 2012; 92: 299-306.
- DeVries JW. On defining dietary fibre. Proc Nutr Soc. 2003; 62: 37-43.
- Chen L, Ren F, Zhang Z, Tong Q, Rashed MM. Effect of pullulan on the short-term and long-term retrogradation of rice starch. Carbohydr Polym. 2015; 115: 415-421.
- Mua JP and Jackson DS. Retrogradation and Gel Textural Attributes of Corn Starch Amylose and Amylopectin Fractions. Journal of Cereal Science. 1998; 27: 157-166.
- Russell PL. The ageing of gels from starches of different amylose/amylopectin content studied by differential scanning calorimetry. Journal of Cereal Science. 1987; 6: 147-158.
- Jekle M and Becker T. Effects of Acidification, Sodium Chloride, and Moisture Levels on Wheat Dough: I. Modeling of Rheological and Microstructural Properties. Food Biophysics. 2012; 7: 190-199.