
Research Article
Austin Food Sci. 2022; 7(1): 1049.
Optimization of Superchilling Liquid Formula and Solutions for Storage of Duck Meat
Lou P-X¹* and Li T-T²
¹Anhui Institute of Product Quality Supervision and Inspection, Hefei, P.R. China
²Anhui Institute of Quality and Standardization, Hefei, P.R. China
*Corresponding author: Pengxiang Lou, Anhui Institute of Product Quality Supervision and Inspection, Hefei 230051, P.R. China
Received: February 17, 2022; Accepted: March 04, 2022; Published: March 11, 2022
Abstract
In order to optimize the proportion of materials in the superchiling solution, a freezing temperature superchiling solution was designed to meet the requirements of storage of duck meat. Response surface analysis (RSM) method was used to investigate the effect of salt and alcohol on the change of freezing point. The CCD response surface model was used to determine the optimum conditions and the optimal ratio was obtained. The results showed that the optimum design conditions were 6 % Cacl2 and 3% 1,2-Propanediol The freezing point temperature is -5.21°C. And optimizing the sorbitol solution, the ascorbic acid solution, and the chitosan solution with different mass ratios based on obtaining the optimal proportion of the micro-freezing liquid. The results showed that 2% sorbitol, 0.3% ascorbic acid and 0.6% chitosan were good in duck meat quality.
Keywords: Immersion chilling and freezing; Response Surface Methodology; Central composite design; Water holding capacity and drip loss; Drip Loss
Introduction
Partial freezing (also called super chilling) is often used to describe a process whereby a food product is stored between its freezing point and 1-2°C below this. Partial freezing can inhibit autolytic and microbial reactions, and thereby increases the shelflife [1-5]. Super chilling consists of soaking foodstuffs in a solution cooled to a low temperature (the freezant). The solutions used in ICF are water-based, and solutes (salts, sugars) or water-soluble solvents (e.g., ethanol), which are added either individually or as a mixture [6,7].
Super chilled cod showed increased shelf-life with respect to reduced growth of sulfide-producing bacteria compared with icechilled cod [8]. Super chilling (-2°C) of Arctic charr fillets packed in dry ice resulted in six days extension of shelf life compared with chilling (3°C) [9]. Currently used in the field of ultra-cold applications, it was firstly used in the aquatic industry and has significant effects [10-12]. For example, it is reported that the ultra-low temperature method is compared with the shrimp selected in the low temperature state, and the meat quality is improved a lot. Under the super chilling storage condition, the K value is suppressed [13]. According to the study, the microstructural changes of salmon ice crystals were treated by different heat transfer methods. The results showed that the larger the heat transfer coefficient, the better the protection of the meat of the salmon at the same storage time was reported [14]. The form of ice crystals formed by using the ultra-cold method is large, and the supercooling process easily destroys the integrity of the fish muscle fibers. The formation of ice crystals inside and outside the cell is affected by the external environment, causing changes in its morphology and cell structure, and corresponding physical and chemical indicators [15,16]. This phenomenon may be affected by freezing rate, storage temperature, and storage time, etc. In particular, the freezing rate plays a crucial role in the size and distribution of ice crystals, which has a great influence on the quality of frozen products. When air cooling is used, the ubiquitous heat transfer efficiency of meat is low, resulting in the loss of nutrients in the meat.
In present research, we aimed to design a solution to meet the cooling requirements of some poultry meat which is convenient to carry out the cooling materials for long-term storage under an ultralow temperature environment.
Materials and Methods
Materials
The duck meat was procured from the Hejiafu supermarket, Hefei, China. Sodium chloride (analytical grade), CaCl2 (analytical grade), 1,2-propanediol (Ethanol analytical grade), Glycerol (analytical grade), D-sorbitol (analytical grade), Ascorbic acid (analytical grade), and Chitosan (Food grade) were purchased from Sangon Biotech (Shanghai, China).
Freezing point determination
The configured super-chilled liquid was placed in a glassware followed by immersing the thermometer probe into the solution, and measuring the other end to the meter port. The vessel was placed in a refrigerator at -40°C before the measurement. Further, the superchilled liquid was placed in a temperature detector and monitored for every five seconds in the temperature and time mode. As shown in Figure 1, the composition in the micro-freezing solution (the cooling line of the salt and alcohol composite solution) and the connection to point B and point C is confirmed. The extension line of the freezing curve was drawn on the cooling curve, and the A of the extension line and the freezing point of multi-component solution were taken as the connecting line between frozen point E and point F.
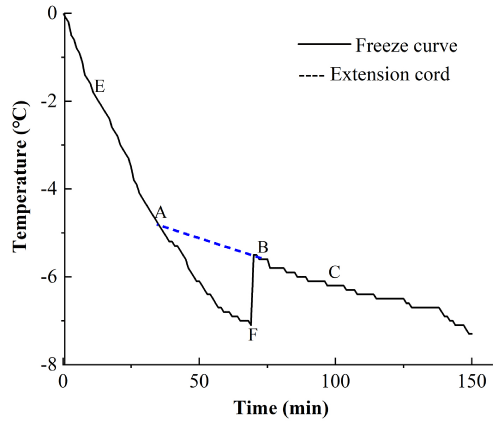
    Figure 1: The multicomponent compounding freezing curveerials. The

solution was prepared as 5% calcium chloride and 5% 1-2 propylene glycol

solution.
Response surface design evaluation
RSM is a statistical modeling approach based on multiple regression of quadratic model with empirical results for solving multivariate equations. Especially modeling of nonlinear relationship with parameters and responses, RSM is an effective method for optimizing complex processes that are difficult to define by exact physical models. The most important profit of RSM is reduction in the number of experimental trials. In this study, central composite design (CCD) was used to optimize and study the change of CaCl2 (A) and propylene glycol (B) independent variables on freezing point of solution and the independent variables such as extraction [17,18]. Table 1 shows the two factors encoding -1, 0 and +1 center detection for four times, respectively, which is used for high-precision pure error and model estimation. The second-degree polynomial equations were calculated with STATISTICA, data program version 7.0, and expressed as surface plots using RSM to visualize the relationship between the response and experimental levels of each factor and to deduce the optimum conditions. A statistical analysis system from STATISTICA was used to predict models through regression analysis (R²) and analysis of variance (ANOVA).
    Factor

    Level


    -1

    0

    1


    CaCl2 mass fraction    (%) A

    4

    5

    6


    Propylene glycol mass fraction    (%) B

    4

    5

    6
Table 1: Micro-freezing fluid response surface test factor level.
Duck sample processing
Under aseptic conditions, the duck breast was divided into meat samples of similar size. An equal number of different proportions of the solution were placed in a beaker, and meat was soaked for 10s. Then after, device was removed, drained, and separated in 0-4°C refrigeration conditions. Duck meat was tested at regular intervals.
Assay of drip loss
The duck meat was treated with different water-retaining agents and drained, and the quality of meat in each group was accurately determined by a precise analytical balance and counted as W1. When the meat was thawed, the quality of the meat was determined by the above methods and counted as W2 [19]. Calculations were done using the formula drip loss = (W2/W1) × 100%.
Assay of water holding capacity (WHC)
The stored packaged duck meat was taken out, and the water droplets outside the package were wiped out with a napkin, and then weighed to W1 (meat, infiltrated juice, and package). The package was opened and the surface of the exuded duck juice was wiped, and the juice inside the bag was weighed as W2 (duck and bag), and the bag weight was considered as W3.
Assay of TBA
Briefly, 5.0g of minced meat was homogenized in 15ml of 7.5% trichloroacetic acid mixed with 0.10% propyl gallate and 0.10% EDTA using an Ultra Turrax and then filtered. Then, 5.0ml of the filtrate was mixed with 5.0ml of 0.020M thiobarbituric acid (TBA) and incubated at 100°C in a water bath for 40min. Absorbance values were measured at 532nm and 600nm at room temperature. The results were expressed as 2-thiobarbituric reactive substances (TBARS) in mg malon-dialdehyde/kg raw meat using a standard curve prepared from, 1,3,3-tetraethoxy-propane [20-22].
Assay of color
Changes in the color of the ray duck muscle were determined with a tri-stimulus colorimeter and measurements were taken on the surface of the muscle [23].
Assay of TVB-N
The approximation of the main spoilage chemical indicators (for the treated fish minces) was conducted. The values of total volatile nitrogenous base (TVB-N), expressed as nitrogen (mg)/100g of minced duck muscle, were determined by micro-diffusion method [24].
Microbiological analysis
For determining total viable count, minced duck meat samples were homogenized with sterile phosphate-buffered saline solution to prepare sample suspensions. Pour-plate method using plate count agar was used to determine the total plate counts in samples. The inoculated agar plates were incubated at 37°C ± 1°C after 24h for the colony count [25,26].
Statistical analysis
The obtained data were processed using SPSS 22.0 statistical software (SPSS, Inc., Chicago, IL, USA) to compare the means at significant differences of P<0.05.
Results
CCD optimization
For CCD, a total number of 13 designed runs of experimental conditions including four selected center points and all the experiments were carried out in triplicates (mean values are used for analysis) for different combinations. Selected combinations of experimental conditions and their respective experimental responses and model predictions were given in Table 2. Regression fitness and quality of the models are given in Table 3. Models were evaluated for super chilling point yield. The output of the adequacy tests of models showed that the quadratic models were statistically highly significant having P-value lower than 0.001 for super chilling point.
    Run

    Independent variable

    Chill point (0)


    A

    B


    1

    -1

    -1

    -4.28


    2

    1

    -1

    -5.53


    3

    -1

    1

    -4.3


    4

    1

    1

    -6.3


    5

    -1.41

    0

    -3.97


    6

    1.41

    0

    -5.61


    7

    0

    -1.41

    -4.74


    8

    0

    1.41

    -6.04


    9

    0

    0

    -5.26


    10

    0

    0

    -5.16


    11

    0

    0

    -5.03


    12

    0

    0

    -5.23


    13

    0

    0

    -4.95
Table 2: Response surface analysis experiment results.
    Source

    Sum of Squares

    F Value

    P-value


    Mean

    339.15


    Linear

    4.74

    28.93

    <0.0001


    2FI

    0.14

    1.86

    0.2053


    Quadratic

    0.36

    4.02

    0.0689


    Cubic

    0.25

    8.72

    0.0234


    Residual

    0.07


    Total

    344.71
Table 3: The statistic result of freezing point change on CCD.
As a result of model statistics for both the selected responses, quadratic models were found significant (P<0.05) and Fisher’s variance ratio at these levels was large enough to validate a fitness success of quadratic models (Table 4). The lack of fit F-values of freezing point was 4.68, associating P-values of 0.0851. “Adequate Precision” test is an important tool due to the fact that “Lack of fit” was not significant for freezing point but it was still significant for CPS (Table 5). Another important control step applied was diagnostic plot to select the correct models (Figure 2).
    Source

    Std. Dev.

    R-Squared

    Adjusted R-Squared

    Predicted R-Squared

    Press


    Linear

    0.29

    0.8526

    0.8231

    0.688

    1.73


    2FI

    0.27

    0.8779

    0.8372

    0.6691

    1.84


    Quadratic

    0.21

    0.9431

    0.9025

    0.6657

    1.86


    Cubic

    0.12

    0.9873

    0.9696

    0.9767

    0.13
Table 4: Model Summary Statistics.
    Source

    Sum of squares

    DF

    Square

    Value

    Prob. > F


    Model

    5.24

    5

    1.05

    23.22

    0.0003


    A

    3.88

    1

    3.88

    85.85

    <0.0001


    B

    0.86

    1

    0.86

    19.12

    0.0033


    AB

    0.14

    1

    0.14

    3.11

    0.121


    A2

    0.19

    1

    0.19

    4.19

    0.08


    B2

    0.13

    1

    0.13

    2.81

    0.1374


    Residual

    0.32

    7

    0.045


    Lost Simulation

    0.25

    3

    0.082

    4.68

    0.0851


    Pure Error

    0.07

    4

    0.018


    Total

    5.56

    12

    0.9431
Table 5: ANOVA analysis of quadratic model for the yield of the Freezing point

determination.
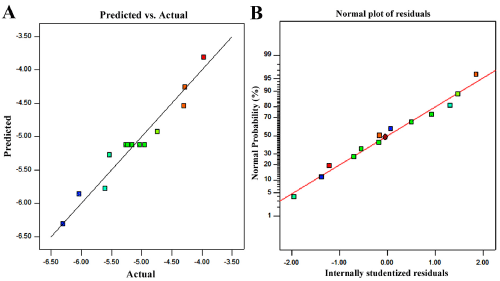
Figure 2: The diagnosis chart of freezing point (A, B) drawn using CCD.
The predicted values were close enough to the experiments and the points of all predicted and experimental response values were correlating (Figure 2A), so the developed model was significant and reliable. The normal % probability plots of residuals for response were normally distributed and their close position on a line means deviations of the variances was acceptable. The comparison of research residuals with experimental operation shows that all data points remain within the limits. Final quadratic models with coded factors were given in Eq. (1) with their coefficients in order to be used for further calculations.
The effects of variables and their interactions on the freezing point yield were described by the 3D response surface plots and 2D contour plots. Figure 3 showed the mass fraction of CaCl2 and the fraction of propylene glycol. The results showed that when the mass fraction of CaCl2 and propylene glycol increased, the freezing point decreased rapidly. When the mass fraction of CaCl2 and propylene glycol were 5% and 6.41%, the freezing point was -6.04°C.
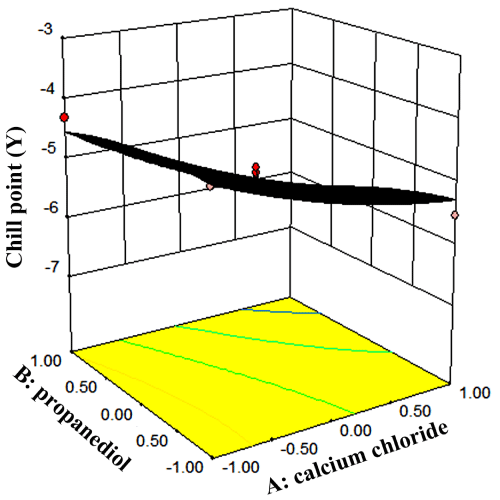
Figure 3: RSM plots of freezing point and CCD designs.
Water-retaining property
Figure 4 showed the water holding capacity of duck meat. As it can be seen from the Figure 4, there was a significant difference between the blank group and the treatment group (P<0.05). For 2 %, 4 %, and 6 % of sorbitol group, the water holding capacity of duck meat increased with the concentration and there was a slow increase in the rate of drip loss (Figure 5). The duck drip loss rate of different sorbitol fractions was compared. The duck juice loss rate was better in 2% solution. At the eighth day, the loss rate was 8.06%, which made the loss rate minimum under all gradients.
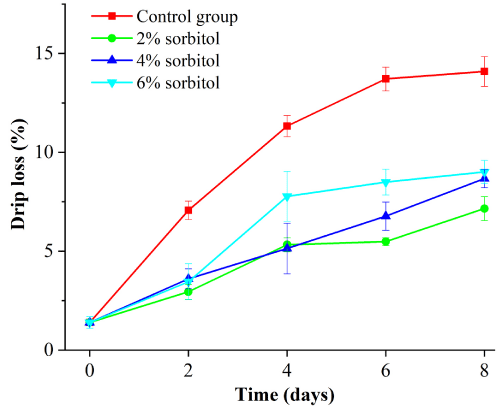
Figure 4: Drip loss rate of sorbitol with different mass fraction.
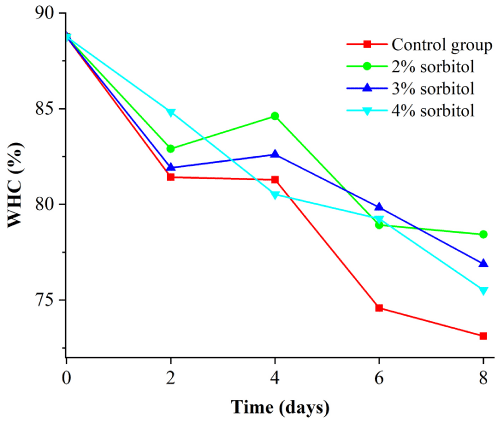
Figure 5: Effect of sorbitol with different mass fraction on water holdup of duck meat.
According to Figure 6A, the changes of L* value of duck meat treated with ascorbic acid at 8th d under different ratios were observed. Generally, L* value showed a gradual increasing trend. At 8th d, the brightness value L* of 0.3 % ascorbic acid group was 70.61 which was lower than that of the other three groups. The difference between the blank group and the experimental group was significant (P<0.05). In the experimental group, with the increase of ascorbic acid content, the L* value of 0.2% and 0.4% changed rapidly, and the difference between the two groups was not significant (P<0.05). On the contrary, the L* value of 0.3% increased slowly compared with other groups (P<0.05).

Figure 6: Effect of ascorbic acid with different mass fraction on L*, a*, b* of duck meat.
According to Figure 6B, the freshness of duck meat showed a declining trend with the extension of storage time. The difference between the blank group and the treatment group was significant (P<0.05) except that the difference between the blank group at 0 d and the treatment group (0.2%) was not significant (P>0.05). When comparing the different treatment groups, the two groups of 0.2% and 0.3% at 0 d were not significant (P>0.05), while the other groups were significantly different (P<0.05).
Figure 6C demonstrated the changes of b* value of duck meat after ascorbic acid treatment with different mass fractions within 8 d. Overall, with the increase of time, the liquid b* value gradually increased. There were significant differences between the treatment group and the blank group within 8 d (P<0.05). At 8th d, b* value of 0.3% solution increased and was 59.3 higher than the other three groups. There were significant differences between the blank and the experimental groups (P<0.05). The change of ascorbic acid showed that 0.3% solution had a rapid increase in b* value in the later period of storage. The concentration of 0.2% and 0.4% had no significant effect on b* of duck meat (P<0.05).
As shown in Figure 7, the TBA value of duck meat treated with ascorbic acid at different mass fractions showed a general trend from 0 to 8 d (P<0.05). Among all the gradients, group treated with 0.3% ascorbic acid was lower than the other two groups.
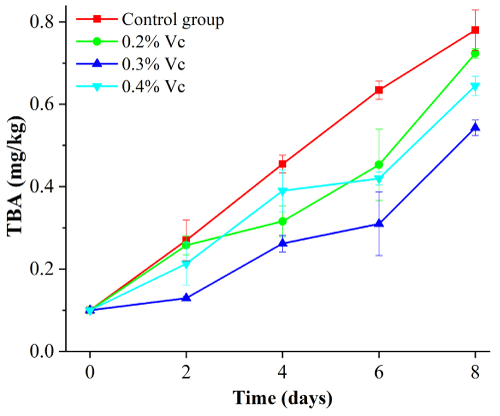
    Figure 7: Effect of ascorbic acid with different mass fraction on TBA of duck

meat.
Preservation
As shown in Figure 8, with the extension of storage time and the increase of chitosan solution mass fraction, the protein decomposition degree in duck meat was slowed down. Treatment group and blank group showed significant differences within 8 d (P<0.05).
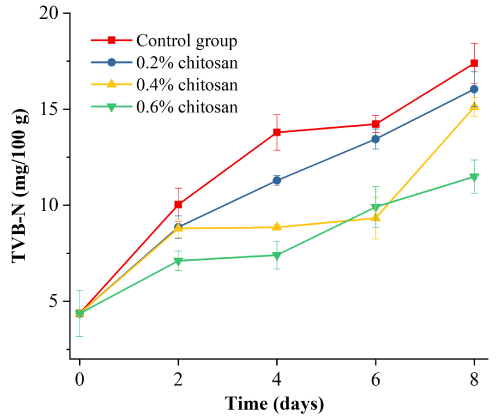
    Figure 8: Effect of chitosan with different mass fraction on TVb-N in duck

meat.
It can be seen from Figure 9 that with the increase of concentration, the inhibition effect of microbial growth was improved. During the storage period from 0 to 8 d, the number of microorganisms in the samples soaked in a certain concentration of water-soluble chitosan was lower than that in the blank group.
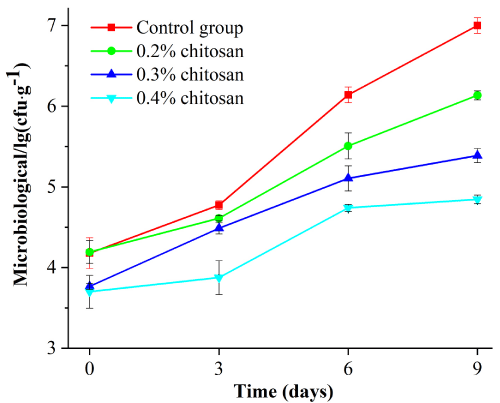
    Figure 9: Effect of chitosan with different mass fraction on microbiological

quality in duck meat.
Multicomponent compounding
The freezing point of multi-component composite solution was lower than that of single component. However, through the single factor experiment of sorbitol, increasing the content of sorbitol, ascorbic acid and chitosan did not show significant reduction of the freezing point of the solution. Based on response surface optimization, 2% sorbitol, 0.3% ascorbic acid and 0.6% chitosan were added to obtain the freezing point curve. As shown in Figure 10, point A is the freezing point of multi-component. The freezing point of the new formula is -4.89°C, which is -0.32°C lower than that of the original micro-freezing liquid.
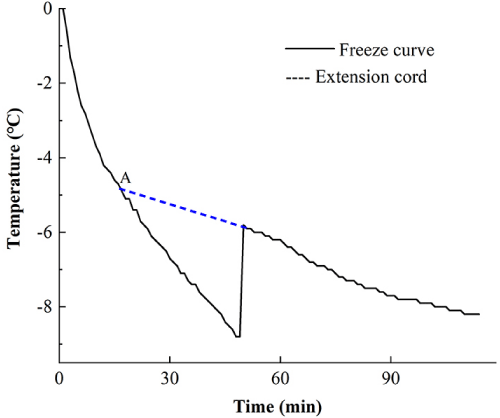
    Figure 10: The optimized multicomponent compounding freezing curveerials.

The solution was prepared as 6% calcium chloride, 3% 1-2 propylene glycol

solution, 2% sorbitol, 0.3% ascorbic acid and 0.6% chitosan.
Discussion
Although NaCl solution has a lower freezing point than CaCl2, CaCl2 can better protect the integrity of muscle fibers. Since CaCl2 molecules are larger than NaCl; therefore, their entry is difficult into muscle fibers and has less impact on the cell structure [7]. Therefore, CaCl2 was selected as the appropriate salt for the current study.
There are different freezing points at different mass fractions under the use of different kinds of alcohols. The ability of the solute to bind water may be quantitatively related to the hydroxyl groups in the solute molecules. For example, in a solution of the same molarity, the ability to bind water molecules is also the same [27]. It is also considered that ethanol is volatile, therefore, propylene glycol was selected in our study. Main ingredients were selected for super chilling solution. In addition, sorbitol, ascorbic acid, and chitosan were added to the micro jelly for additional functions of water retention, color retention, and freshness preservation.
In terms of water retention, free water can be reduced by sorbitol. With a certain volume mass fraction, sorbitol 6 hydroxy can interact with water molecules by hydrogen bonding connection, reducing water mobility and activity [28]. The water holding capacity of duck meat represents the ability of animal meat to retain water after various physical processing methods, or the ability of external water to enter the meat and combine with water moleculescan replace with recent references [29].
In the color effect, the addition of appropriate ascorbic acid could effectively extend the storage period of duck meat in a certain range, prevent fat oxidation, and improve the quality of duck meat, because there are two adjacent enol hydroxyl groups in ascorbic acid molecules, whose structure is unstable and easy to be oxidized [29]. Because of this characteristic, it is fused with trace oxygen in oil to produce redox reaction, which reduces the oxygen concentration in oil, and thus delays the automatic oxidation of polyunsaturated fatty acids [30]. On the other hand, frozen storage affects lipid oxidation, which is accelerated by thawing: peroxidation occurs during frozen storage, leading to rapid and severe secondary lipid oxygen [31]
To retain freshness, chitosan has a certain antibacterial effect, which is derived from the protonated ammonium in the chitosan molecule, and the protonated ammonium is easy to interact with the negatively charged cell membrane; or the hydroxyl group in the chitosan molecule is combined with the amino cell membrane. While water-soluble chitosan may enter through the damaged cell wall and further interact with the bacterial cell material. The infiltrated chitosan molecules can be combined with the primary tissue of the pathogenic cell wall.
Conclusion
Through the response surface analysis, the design of the application and micro-freezing solution formulation was successfully designed from the CCD response surface of CaCl2 and propylene glycol. The selected parameters and their selection showed a significant impact. It can be speculated that calculation model had good reliability. The CCD quadratic model is better to “adjust r-square” with the smallest “press” value. The mass fraction of CaCl2 calculated by the CCD model was 6%, the mass fraction of propylene glycol was 3%, and the freezing point was s -6.04°C. At 2% chitosan solution, the water retention in the duck meat was significantly inhibited and there was decline in the cooking loss rate during the test period; however, the tenderness of the duck meat was maintained. When using 0.3% ascorbic acid solution, the oxidative capacity of duck meat can be better inhibited during the test period to prevent the fat oxidation of duck meat. At 0.6% chitosan solution, the growth of microorganisms in duck meat was better inhibited throughout the study.
Funding
This work was supported by the Major Projects of Science and Technology in Anhui Province (15CZZ03114).
References
- Bel O, Lallemand A. Study of a two phase secondary refrigerant - Intrinsic thermophysical properties of ice slurry. 1999; 22: 164-174.
- Yang L, Shang Y, Ying S, Quan D. Changes in the quality of super chilled rabbit meat stored at different temperatures. 2016: 173-181.
- Chalco-Sandoval W, Fabra MJ, López-Rubio A, Lagaron JM. Optimization of solvents for the encapsulation of a phase change material in polymeric matrices by electro-hydrodynamic processing of interest in temperature buffering food applications. 2015: 23-33.
- Song Y, Luo Y, You J. Shen H, Hul S. Biochemical, sensory and microbiological attributes of bream (Megalobrama amblycephala) during partial freezing and chilled storage. 2011: 197-202.
- Ren WY, Yuan GQ, Lin X, Guo XH, Wang ZL. Comparison of the immersion chilling and freezing and traditional air freezing on the quality of beef during storage. 2021: 6653-6661.
- Peralta JM, Rubiolo AC, Zorrilla ES. Prediction of heat capacity, density and freezing point of liquid refrigerant solutions using an excess Gibbs energy mode. 2007; 82: 548-558.
- Xie J, Xu H, Wang J, Huang W, Wu X. Method for immersion chilling and freezing tuna by CaCl2 with low penetration amount. 2016.
- Duun AS, Rustad T. Quality changes during super chilled storage of cod (Gadus morhua) fillets. 2007: 1067-1075.
- Bao HND. Effects of Dry Ice and Superchilling on Arctic Charr Fillets. 2011.
- Kameník J, Alena Saláková A, Pavlík Z, Bořilová G, Hulanková R, Steinhauserová I. Vacuum skin packaging and its effect on selected properties of beef and pork meat. 2014; 239: 395-402.
- Belk AD, Duarte T, Quinn C, Coil DA, Belk KE, Eisen JA, et al. Air versus water chilling of chicken: a pilot study of quality, Shelf-life, Microbial ecology, and economics. 2021: 6.
- Xu CC, Liu DK, Guo CX, Wu YQ. Effect of cooling rate and super-chilling temperature on ice crystal characteristic, cell structure, and physicochemical quality of super-chilled fresh-cut celery. 2020: 249-255.
- Ando M, Nakamura H, Harada R, Yamaney A. Effect of super chilling Storage on Maintenance of Freshness of Kuruma Prawn. 2004; 10: 25-31.
- Kaale LD, Eikevik TM, Bardal T, Kjorsvik E, Nordtvedt TS. The effect of cooling rates on the ice crystal growth in air-packed salmon fillets during superchilling and superchilled storage. 2013; 36: 110-119.
- Bahuaud D, Langsrud TM, Sinnes K, Veiseth E, Ofstad R, Thomassen MS. Effects of -1.5°C super-chilling on quality of atlantic salmon (Salmo salar) prerigor fillets: cathepsin activity, muscle histology, texture and liquid leakage. 2008; 111: 329-339.
- Guo JH, Weng CF. Current status and prospects of cryopreservation in aquatic crustaceans and other invertebrates. 2020; 4.
- Liu JC, Sun YX, Liu L, Yu CL. The extraction process optimization and physicochemical properties of polysaccharides from the roots of Euphorbia fischeriana. 2011; 49: 416-421.
- Yu P, Chao XY. Statistics-based optimization of the extraction process of kelp polysaccharide and its activities. 2013; 91: 356-362.
- Lukman D, Pisestyani H, Latif H, Sudarnika E, Bachrum M. Postmortem changes in pH, color, drip loss, and non-protein Nitrogen in beef liver and lungs during storage in refrigerator. 2020; 8: 56-63.
- Sørensen G, Jørgensen SS. A critical examination of some experimental variables in the 2-thiobarbituric acid (TBA) test for lipid oxidation in meat products.1996; 202: 205-210.
- Vyncke W. Direct Determination of the thiobarbituric acid value in trichloracetic acid extracts of fish as a measure of oxidative rancidity. 1970.
- Yassen NA, Gaafar KM, Shawish RR, Elgendy AG. Journal of current veterinary research chemical and bacteriological evaluation of broiler’s meat after adding garlic powder to poultry ration. 2021; 119-125.
- Tao YM, Ma L, Li DD, Tian YT, Liu J, Liu DH. Proteomics analysis to investigate the effect of oxidized protein on meat color and water holding capacity in Tan mutton under low temperature storage. 2021; 146: 111429.
- Lin WL, Yang XQ, Song Y, Hu X, Huang H. The effects of immersion chilling and freezing on prepared grass carp (Ctenopharyngodon idellus) fillet quality during the freezing process. 2014; 30:80-87.
- Kilinc B, Cakli S. Chemical, Microbiological and sensory changes in thawed frozen fillets of sardine (sardina pilchardus) during marination. 2004; 88: 275- 280.
- Nauman K, Ali S, Mustafa AJ, Mehmood S. Comparison of the effects of air and water immersion chilling on processing and sensory attributes of broiler carcass. Journal of Food Safty and Food Quality. 2020; 71: 129-133.
- Hey JM, MacFarlane DR. Crystallization of ice in aqueous solutions of glycerol and dimethyl sulfoxide. 1. a comparison of mechanisms. Cryobiology. 1996; 33: 205-216.
- Cheng QF, Sun DW. Factors affecting the water holding capacity of red meat products: a review of recent research advances. Crit Rev Food Sci Nutr. 2008; 48: 137-159.
- Tugiyanti E, Yuwanta T, Zuprizal Z, Rusman R. Supplementation of vitamin e and c in feed on meat quality, thiobarbituric acid reactive substance (TBARS) and myoglobin level of muscovy duck meat. Journal of the Indonesian Tropical Animal Agriculture. 2014; 39: 37-44.
- Ponnampalam EN, Burnett FV, Norng S, Hopkins DL, Plozza T, Jacobs JL. Muscle antioxidant (vitamin E) and major fatty acid groups, lipid oxidation and retail colour of meat from lambs fed a roughage based diet with flaxseed or algae. Meat Sci. 2016; 111: 154-160.
- Bellés M, Alonso V, Roncalés P, Beltrán JA. Display stability of fresh and thawed lamb supplemented with vitamin E or sprayed with an antioxidant borage seed extract. J Sci Food Agric. 2017; 98: 2871-2879.