
Research Article
Austin Food Sci. 2024; 8(1): 1054.
Elemental Comparison between Local and Imported Rice in Zanzibar
Jamila Mohamed Machano¹; Abdul AJ Mohamed²*; Said S Bakari²
¹Student Department of Natural Sciences-SUZA
²Senior Lecturer, Department of Natural Sciences-SUZA
*Corresponding author: Abdul AJ Mohamed, Senior Lecturer, Department of Natural Sciences-SUZA, Tanzania. Email: jumabdull@yahoo.com
Received: November 06, 2024; Accepted: November 27, 2024; Published: December 04, 2024
Abstract
Rice is the famous food worldwide; it contributes much in nutrients availability in human body. Elements obtained in rice are the facilitators and catalyst for sustainable human growth and development. The intention of this study was to compare the elemental composition in local and imported rice brands, and finally to compare those concentrations with WHO/FAO standards. The brands of rice include: Basmati from India, Jasmine for Vietnam, Mapembe from Pakistan, Mbeya rice from (Mbeya, Shinyanga and Morogoro, Tanzania mainland) and Cheju rice from Cheju, Zanzibar. Samples analysis was done at SEAMIC, Kunduchi, Dar-es-salaam using Energy Dispersive X-Ray Fluorescence (EDXRF); Rigaku NEX CG EDXRF spectrometer. Nine elements were analyzed (Phosphorus P; Sulfur S; Chloride Cl; Silicon Si; Rubidium Rb; Selenium Se; Aluminium Al; Tellurium Te; and Bromide Br. Importantly, the present study reveals that Cheju rice was the most highly contaminated with the detected metals as compared with other brands of rice. The contamination proportion in each rice brand was; 100% for Cheju rice, 77.77% for Basmati, Shinyanga, Mbeya and Morogoro rice, 66.66% for Mapembe rice, and 55.55% for Jasmine rice. The percentages occurrence of elements in rice brands were 100% for (S, P, Si, Cl and Rb), 85.71% for Al, 28.57% for Br and 14.28% for Se and Te. One-way Anova showed that P, Al, and Te were not significantly different (p–value > 0.05), while the levels of S, Si, Cl, Rb, Br, and Se in rice samples were found to be significant different (p–value < 0.05). In each rice brand, the trends of occurrences were; Cheju: P > S > Si > Cl > Al > Rb > Br > Te > Se; Basmati: P > S > Si > (Cl and Al) > Br > Rb; Shinyanga: P > S > Si > Cl > Al > Rb > Br; Mbeya: P > S > (Si and Cl) > Al > Rb > Br; Morogoro: P > S > Si > Cl > Al > Rb > Br; Mapembe: S > P > Cl > Si > Al > Rb; Jasmine: S > P > Si > Cl > Rb. While the contamination trends is: Cheju > (Basmati, Shinyanga, Mbeya and Morogoro) > Mapembe > Jasmine. It is very apparent that Cheju rice had the highest concentration of analyzed elements that could be the results of contaminated soil and an inappropriate application of fertilizers during cultivation processes. Therefore, more studies are needed for the chemical analysis not only for rice cereal but for other crops as well.
Keywords: Cheju rice; Jasmine rice; Basmati rice; Mapembe rice; Rubidium; Tellurium; SEAMIC-Kunduchi
Introduction
Minerals are inorganic nutrients required by living organism in small quantity from less than 1 to 2500 mg per day. For instance, Phosphorus is an important constituent of Adenosine Triphosphate (ATP) and nucleic acid and is also essential for acid-base balance, bone and tooth formation. Magnesium, copper, selenium, zinc, iron, manganese and molybdenum are important co-factors found in the structure of certain enzymes and are indispensable in numerous biochemical pathways. Sodium, potassium and chloride are important in the maintenance of osmotic balance between cells and the interstitial fluid [10].
Aluminium (Al)
Aluminium is third-most occurring element after the oxygen and silicon, it constitutes almost 7% of the total inorganic solid mass of earth crust [2]. In soil it is originated from igneous rocks in form of aluminosilicates and precipitate or attached with the ligands [12]. It is also present in water and various foods. Normally, aluminium enters into the environment through both natural and anthropogenic sources. Weathering of rocks is the principal way in which aluminium enters in the environment. Some of anthropogenic activities that contribute addition of aluminium in the environment include wastewater effluent, solid waste of aluminium-based industries, and air emissions [2].
Iron deficiency is induced in sorghum, wheat, and rice when an excessive amount of aluminium is deposited [12].
Silicon (Si)
Silicon is an essential component in the development of bone in two species of experimental animals, but no data are available to estimate a human requirement [7].
Selenium (Se)
Selenium is a chemical element with symbol Se and atomic number 34 and has an atomic weight of 78.97. It was discovered by Swedish chemist Jöns Jacob Berzelius in 1817. There are various sources of food that contain selenium. Some of those foods which are the best sources for selenium are seafood, meats, whole grains, and some vegetables. It has also been found that the raw foods contained considerably more selenium than cooked and processed foods [8]. Selenium is a vital micronutrient for good health of animals and plants. The selenium content in the human body is about 13-20 mg. It is mainly found at the active site of a wide range of selenoproteins as selenocysteine. It is an important component of the antioxidant enzymes such as glutathione peroxides and thioredoxin reductase [4].
It has been established that dietary selenium is important for a healthy immune system, where it improves T-lymphocyte immune responses. Interestingly, there is strong evidence that selenium has a protective effect against some forms of cancer such as colon, prostate, and breast. Although selenium deficiency is rare in healthy human, lack of selenium is reported to be the main reason of Keshan disease, on the other hand, excessive consumption of it can lead toxicity in human [1,8].
Phosphorus (P)
Phosphorus is located in every cell of the body and is vitally concerned with many metabolic processes, including those involving the buffers in body fluids [3]. It functions as a constituent of bones, teeth, Adenosine Triphosphate (ATP), phosphorylated metabolic intermediates and nucleic acids [10]. It is also essential macronutrient for plants and one of the three nutrients generally added to soils in fertilizers because of its vital role of energy transfer in living organisms and in plants. Adequate phosphorus availability stimulates early growth and hastens maturity in plants [9].
Sources of phosphorus include phosphate food additives, green leafy vegetables and fruits, especially banana [10].
Deficiency of phosphorus in children causes rickets and in adults, it causes osteomalacia [5,6].
Chloride (Cl)
Chloride is the principal anion involved in the regulation of extracellular osmotic pressure and makes up over 60% of the anions in this fluid compartment and is thus important in acid base balance. It is the chief anion of the gastric juice and is accompanied by the hydrogen ions in nearly equal amounts. It is the major negative ion of the extracellular fluid and participates in acid production in the stomach.
Sulfur (S)
Sulfur is found in high concentration in some parts of human body such as connective tissue, skin, hair and nails. It is also present in thiamine and biotin (member of vitamin B complex) and coenzyme A [5].
The other sulfur compounds of biological Significance are Cyanate (SCN) in saliva and other fluids, ergothioneine of the red blood cells, glutathione, present in all cells, and chondroitin sulfate, which serves a structural function in cartilage, bone, tendons, blood vessel walls, etc [10].
Bromide (Br)
A study done by Vobecky et al., (1996) found that more than one third of the iodine content in the thyroid is replaced by bromine, even though bromine does not prevent the occurrence of goiter.
Rubidium (Rb)
Rubidium is found in animal tissue and it resembles potassium in its distribution and excretory pattern. Relatively high levels can be found in the soft tissue, while the skeletal tissue contains low level [10].
Research Methodology
Sources of Samples
25 rice samples were obtained from seven different brands of rice were used in this study: Jasmine, Basmati, Mapembe, Mbeya, and Cheju rice. Three brands (Basmati, Jasmine, and Mapembe) are imported primarily from India, Vietnam, and Pakistan, respectively. Rice from Mbeya, Morogoro, and Shinyanga, formally known as the MBEYA brand (in Zanzibar), is imported from Tanzania's mainland, while CHEJU rice is grown locally in Zanzibar (Unguja from the Cheju area).
Samples Collection
Cheju rice was obtained from local producers in Cheju, and samples of all four brands (Jasmine, Basmati, Mapembe, and Mbeya including Shinyanga and Morogoro rice) were randomly taken from local markets, primarily at Darajani and Mwanakwerekwe in Zanzibar. Each sample weighed one kilogram, and it was stored in distinct polyethylene bags before being sent to a laboratory.
Samples Preparation
One goal of laboratory sample preparation is to provide representative aliquots that are free of laboratory contamination which will be used in the next steps of the protocol without sample loss. Samples were prepared in accordance with applicable Safe Operating Procedures (SOPs) and laboratory SOPs using information provided by field sample preparation. The samples were grinded to fineness and an aliquot of about 10.0 g was measured on the beam balance and mounted on the sample holders for analysis.
Sample Analysis on EDXRF Spectrometer
A total of 25 rice samples were taken to the chemical and environmental laboratory at African Minerals and Geosciences Centre (AMGC), Tanzania for undertaking chemical analysis. They were properly identified and coded. These samples were then analyzed using an Energy Dispersive X-Ray Fluorescence (EDXRF) Spectrometer named as The Rigaku NEX CG model (Figure 1). This instrument is capable for elemental analysis from sodium to uranium in solid, liquid and powder samples as well as thin film coatings on solid substrates. In EDXRF low energy “soft” X-rays (1-50keV) are emitted from an X-ray tube. Theses source X-rays enter the sample and cause the atoms in the sample to fluoresce their own characteristic low energy “soft” X-rays. These fluorescent X-rays are captured in a detector and counted by a multi-channel analyzer. The NEX CG software then calculates the concentration of each of the analyzed element present in the sample.
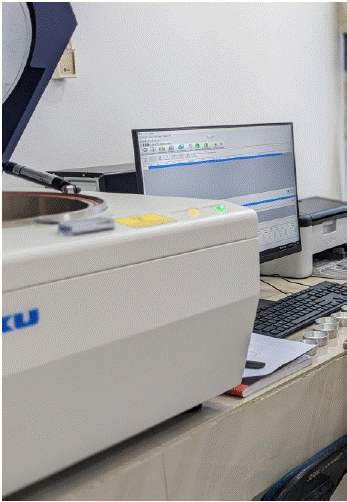
Figure 1: Rigaku NEX CG EDXRF Spectrometer.
The spectrometer machine was first calibrated using a Multi- Channel Analyzer (MCA) calibration sample (Figure 2) so as to calibrate the relationship between the channels of spectrum data and energy of fluorescent X-rays and the standard results Fe = 663 keV, Ba = 470 keVand K = 356 keV were obtained.
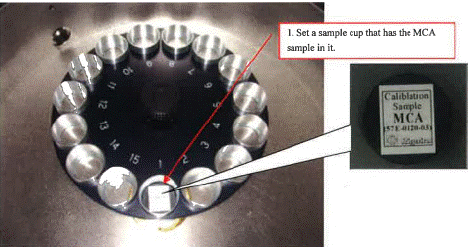
Figure 2: MCA Calibration of Rigaku NEX CG EDXRF Spectrometer.
The library calibration was also conducted (Figure 3). In the library calibration, the peak profiles of elements are obtained using Sn, Cu and SiO2 samples and the peak profiles are calibrated. The fluorescent X-ray intensities of elements contained in the MCA sample are also obtained to carry out the drift calibration of sensitivity library measurement intensities. If this calibration is not carried out for a long period, library data will not correlate with the data of samples because of variations in peal profiles and X-ray intensities, and erroneous identifications and the shifts of analysis value will result.

Figure 3: Library Calibration of Rigaku NEX CG EDXRF Spectrometer.
Afterwards, samples were loaded and analyzed on the EDXRF spectrometer (Figure 4). The obtained sample results were evaluated using a NEX CG software, normalized and finally reported in percentage (%) and parts per million (ppm).
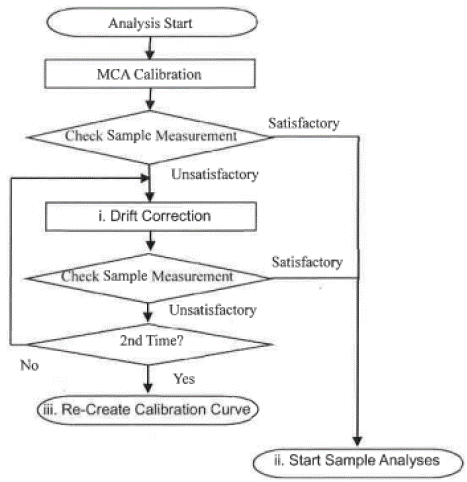
Figure 4: Analysis Process in the Rigaku NEX CG EDXRF Spectrometer.
Figure 4 displays the entire analytical procedures undertaken in Rigaku NEX CG EDXRF spectrometer during analysis of all analyzed elements in brands of rice.
Statistical Analysis
Descriptive statistics including One Way ANOVA statistical methods of analysis was used in the study. The software SPSS 20 was used for statistical analysis. The significant differences for analyzed parameters were also demonstrated via Analysis of Variance (ANOVA).
Results
This study concerned with analysis of elements in seven brands of rice namely; Basmati, Jasmine, Shinyanga, Mbeya, Morogoro, Mapembe and Cheju. The brands of rice were found to contain nine elements with varying concentrations. The observed elements included S, P, Si, Cl, Al, Rb, Br, Se and Te. Results of analyzed elements in seven rice brands as obtained from The Rigaku NEX CG EDXRF Spectrometer are summarized in Table 1.
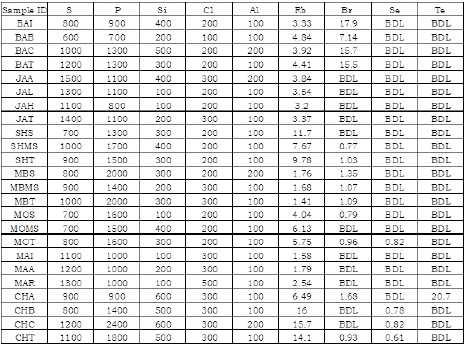
Table 1: Results of 7 Rice Brands from Rigaku NEX CG EDXRF.
Regardless the concentrations of elements, the Table 2 explores general existence trend of detected elements in analyzed rice brands. It also shows percentage occurrence of element, percentage contamination of rice brand and the origin of the particular brand of rice.

Table 2: Occurrence of the Metals in Rice Brands.
Table 2 shows that Cheju rice was comprised of all nine analyzed elements making 100% contamination. Basmati, Shinyanga, Mbeya and Morogoro rice contained seven elements each and their percentage of contamination was 77.77%, Mapembe rice had six metals with 66.66 percentage contamination. The least contaminated rice was Jasmine which contained five detected elements, its percentage contamination was 55.55. This can generally depict the following trend: Cheju > (Basmati, Shinyanga, Mbeya and Morogoro) > Mapembe > Jasmine
On the other side, SPSS program was used to manipulate some of the descriptive statistics. Some of those manipulated statistics include:
Minimum and maximum concentrations of elements (mg/Kg) in analyzed rice were computed through descriptive statistics and the results were summarized in Table 3. Meanwhile range of each element (mg/Kg) in all analyzed rice was calculated and the obtained results were depicted in Table 6.

Table 3: Min. and Max. Conc. of Elements in Analyzed Rice.
Elements that were found to exist in all rice brands were phosphorus, sulphur, silicon, chlorine and rubidium. Other elements including aluminium, bromine, selenium and tellurium were found in some brands of rice (Table 4). The actual trend of each element in all analyzed rice brands is shown in Table 5
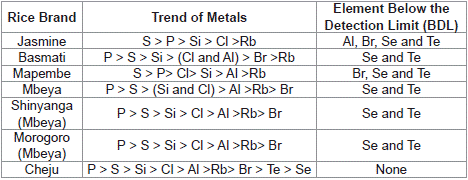
Table 4: Trends on the levels of Elements in Rice Brands.
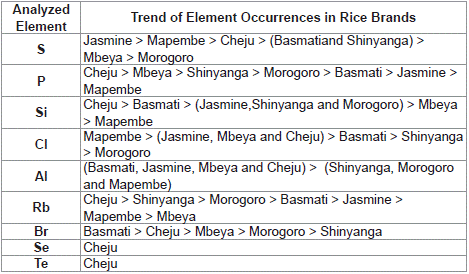
Table 5: Order of Occurrence of Elements in the Analyzed Rice Brands.
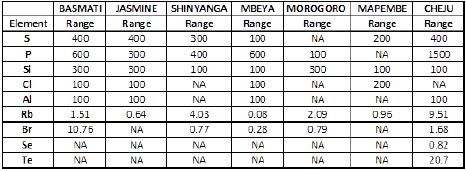
Table 6: Range of Elements (mg/Kg) in Analyzed Rice.
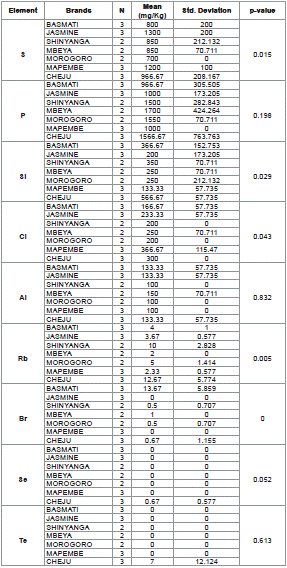
Table 7: Descriptive Statistics from Analyzed Element in Rice Brands.
Table 3 and Figure 5 exhibit the fact that phosphorus in all analyzed rice was superior (2400 mg/Kg) in Cheju rice while sulphur (1500 mg/Kg) was highly found in Jasmine rice. Other elements including silicon, chlorine and aluminium were detected in moderate concentrations. Among these large quantity of Si (600 mg/Kg) was detected in Cheju rice, Cl (500 mg/Kg) was found in Mapembe and Al (200 mg/Kg) was identified in Basmati, Jasmine, Mbeya and Cheju rice (Table 3 & Figure 6).
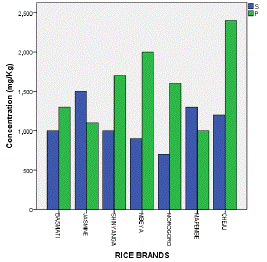
Figure 5: Max. Conc. of S and P in Analyzed Rice.
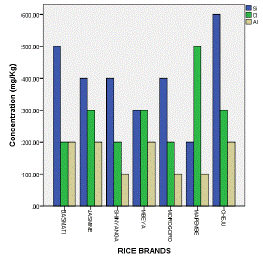
Figure 6: Max. Conc. of Si, Cl and Al in Analyzed Rice.
The remaining elements exhibited during analysis were Rb, Br, Se and Te. Rb was detected in all rice brands while the remains were not (Table 4). Se and Te were only found in Cheju rice. Rb (16 mg/Kg) was highly concentrated in Cheju rice, Br (17.9 mg/Kg) appeared highly in Basmati rice, Se (0.82 mg/Kg) and Te (20.7 mg/Kg) were identified in Cheju rice (Table 3 & Figure 7).
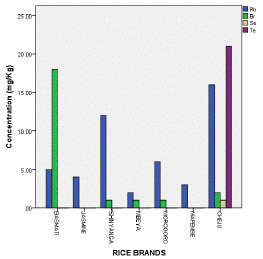
Figure 7: Max. Conc. of Rb, Br, Se and Te in Analyzed Rice.
From analysis done, it was observed that the level of S, Si and Cl were significantly different from other metals with p – value 0.015, 0.029 and 0.043 respectively. Rb, Br and Se also exhibited significance different from other elements and their p – values were 0.005, 0.000 and 0.052 correspondingly (Table 7).
Conclusion
Results from this study revealed that, Cheju rice was the most contaminated with all analyzed elements and the least contaminated rice was Jasmine. The highest levels of the mineral elements in Cheju rice might be could be attributed by the effects of chemicals like pesticides, herbicides, fertilizers on the mineral contents of the soils where these rice plants are cultivated. Other factors could be genetic of rice, location and environment.
It was noticed that, there is significant difference of elements within and between the groups, for example, S, Si and Cl were significantly different from other metals with p – value 0.015, 0.029 and 0.043 respectively. Meanwhile, Rb, Br and Se were significantly different from other elements with p – values 0.005, 0.000 and 0.052 in accordance.
Recommendation
To ensure safe intake of mineral elements from the rice people consume, the authors suggest the following:
i) More education on proper use of pesticides, insecticides, herbicides and other chemical fertilizers and manure should be produced to local farmers to reduce over usage which might increase possibility of heavy metal contamination in rice.
ii) Soil analysis should be done before cultivating rice or any other crop so as to ensure that soil is fertile with required nutrients.
Further studies should be conducted worldwide to establish standards for metals in rice which are not yet discovered.
References
- Brown KM, Arthur JR. Selenium, selenoproteins and human health a review, Public Health Nutrition. 2001; 4: 593-599.
- Frankowski M. Aluminium uptake and migration from the soil compartment into Betulapendula for two different environments: a polluted and environmentally protected area of Poland. Environ SciPollut Res. 2016; 23: 1398-1407.
- Hays VW, Swenson MJ. Minerals and Bones. In: Dukes’ Physiology of Domestic Animals, Tenth Edition. 1985: 449-466.
- IOM (Institute of Medicine). Dietary reference intakes: Calcium, phosphorus, magnesium, vitamin D and fluoride. Food and Nutrition Board, Washington, DC: National Academy Press. 1997.
- Malhotra VK. Biochemistry for Students. Tenth Edition. Jaypee Brothers Medical Publishers (P) Ltd, New Delhi, India. 1998.
- Murray RK, Granner DK, Mayes PA, Rodwell VW. Harper’s Biochemistry, 25th Edition, McGraw-Hill, Health Profession Division, USA. 2000.
- NAS/IOM (National Academy of Sciences/Institute of Medicine). Dietary reference intakes for Vitamin A, Vitamin K, arsenic, boron, chromium, copper, iodine, iron, manganese, molybdenum, nickel, silicon, vanadium, and zinc. Food and Nutrition Board, Institute of Medicine, Washington, DC. ISBN 0-309-7279-4.
- Roger M. The Minerals You Need, USA: Safe Goods Publishing. 2011: 21.
- Sharma S, Mahotra P, Bhattacharyya AK. Effect of electroplating industrial waste on ‘‘available phosphorus’’ of soil in relation to other physico-chemical properties. Afr J Environ Sci Technol. 2008; 2: 257264
- Soetan KO, Olaiya CO, Oyewole OE. The importance of mineral elements for humans, domestic animals and plants: A review, African Journal of Food Science. 2010; 4: 200-222.
- Vobecky M, Babicky A, Lener J, Svandova E. Interaction of bromine with iodine in the rat thyroid gland at enhanced bromide intake. Biological Trace Element Res. 1996; 54: 207-212.
- Yu GH, Wu MJ, Wei GR, Luo YH, Ran W, Wang BR, et al. Binding of organic ligands with Al (III) in dissolved organic matter from soil: implications for soil organic carbon storage. Environ Sci Technol. 2012; 46: 6102-6109.