
Research Article
Austin J Genet Genomic Res. 2015; 2(2): 1014.
Stable Instability of Sarcoma Cell Lines Genome Despite Intra-Tumoral Heterogeneity: A Genomic and Transcriptomic Study of Sarcoma Cell Lines
Lagarde P1,2, Brulard C¹, Pérot G¹,³, Mauduit O¹, Delespaul L¹, Neuville A1,3, Stoeckle E4, Le Guellec S5, Rochaix P5, Coindre JM1,2,3 and Chibon F1,3*
¹INSERM U916, France
²Bordeaux University, France
³Department of Biopathology, Institut Bergonié, Comprehensive Cancer Centre, France
4Department of Surgery, Institut Bergonié, Comprehensive Cancer Centre, France
5Departement of Pathological Anatomy and Cytology, Oncopole, 1 avenue Irène Joliot-Curie, France
*Corresponding author: Frédéric Chibon, Tumor Genetics - Department of Biopathology and INSERM U916, Genetics and Biology of Sarcomas, Insitut Bergonié, 229 cours de l’Argonne, 33076 Bordeaux, France
Received: October 13, 2015; Accepted: December 04, 2015; Published: December 07, 2015
Abstract
Background: Sarcoma oncogenesis is still poorly understood and functional studies are hampered by the dearth of cell lines representative of diverse sarcoma types. The existing models suffer from two main pitfalls: lack of representativeness of the tumors from which they were derived and lack of information about their evolution over passages. There is therefore a pressing need to generate new cell lines.
Methods: All sarcoma tumors from patients receiving surgery in a large tertiary referral center in France were cultured to establish the corresponding cell lines. We performed comparative genomic and transcriptomic studies of the original tumor and cell lines to evaluate the representativeness of the cell line to the original tumor and evolution over passages.
Results: Pleomorphic sarcomas are genetically heterogeneous. As a consequence, cell lines derived from that kind of tumor developed from selected clones roughly representing the initial tumor. More importantly, our results show that there are no genetic imbalances and transcription modifications along passages.
Conclusion: Even if pleomorphic sarcomas are genetically unstable at the cellular level, they appear to be genetically stable at the multicellular one, and therefore remain representative of the initial tumor even after passages. We established a sarcoma cell line panel gathering 32 cell lines with genomic, transcriptomic and clinical data, which will be significant to understand genomic alterations, sarcoma biology and to manage preclinical studies and clinical trials.
Keywords: Cell lines; Heterogeneity; Instability; Sarcoma
Introduction
Soft Tissue Sarcomas (STS) are a heterogeneous group of mesenchymal tumors that account for 1-2% of all cancers. More than 100 types and subtypes of sarcomas are listed by the World Health Organization (WHO). Metastatic risk depends on histological type and varies from 20% to 60% [1], meaning that an accurate initial diagnosis is essential for patient clinical management.
Based on cytogenetic and Comparative Genomic Hybridization (CGH) data, sarcomas can be divided into two main groups: one characterized by known alterations such as translocation t(11;22) (q24;q12) in Ewing sarcomas [2], t(X;18) in synovialosarcomas [3,4], mutation in Gastrointestinal Stromal Tumors (GIST) [5,6] or amplifications as MDM2/CDK4 in dedifferentiated and welldifferentiated liposarcomas [7,8]; and a second group of sarcomas without known alterations and with complex genetics, including leiomyosarcomas and undifferentiated pleomorphic sarcomas [9-11].
Although considerable genomic and transcriptomic data are currently available for sarcomas [11-14], oncogenesis is still poorly understood. In order to better understand sarcoma biology, to determine the involvement of a gene and to develop a therapeutic target, genomics-guided functional genetic studies are necessary. Yet, functional studies in sarcomas are hampered by the dearth of appropriate models. Only a limited number of human sarcoma cell lines exist, in part because of the rarity of certain diagnoses and resulting scarcity of samples. Moreover, for each of the subtypes with complex genomes, multiple cell lines are needed to represent the diversity of genetic alterations within that subtype. Several large-scale projects now aim to genetically characterize large numbers of human cancer cell lines and screen these against a range of anticancer therapies to correlate drug sensitivity with genetic markers [15]. Among these are the Cancer Cell Line Encyclopedia and the Sanger Cancer Cell Line Project. The Sanger project is assembling approximately 800 cell lines, of which only 10 (1.3%) represent complex soft-tissue sarcomas. As a result, there is a real need to generate cell lines representative of diverse sarcoma types, mainly for the subtypes with complex karyotypes. The creation of a sarcoma cell line panel with genomic and transcriptomic profiles that mirror the diversity observed in their corresponding tumor types would represent a critical step in understanding the influence of heterogeneity on variability of response to targeted therapies [16]. Such a panel could also drive genomics-guided functional genetics, either with arrayed or pooled loss-of-function RNAi screens [17,18], or ‘ORFeome’ approaches [19,20].
To address this issue, we cultured sarcoma tumor cells from every patient treated by surgery at the Institut Bergonié, a large tertiary referral center in France. Among the 32 established cell lines, we performed genomic and transcriptomic studies on seven of them to evaluate the representativeness of the original tumor and the evolution over more than 50 passages.
Materials and Methods
Ethics statement
The samples used in this study were part of the Biological Resources Center of Bergonie Cancer Institute (CRB-IB). In accordance with the French Public Health Code (articles L. 1243-4 and R. 1243-61), the CRB-IB received the agreement from the French authorities to deliver samples for scientific research (number AC-2008-812, on February 2011). These samples were obtained from regular patient care and requalified for research. Patients provided written informed consent approved by the Committee of Protection of Individuals.
Establishing a cell line
Following surgical resection, fresh tumor tissue was minced with scissors and then digested with 200 IU/ml type II collagenase (Roche) in serum-free RPMI 1640 with glutamax, supplemented with antibiotics (Gibco BRL, Life Technologies) overnight. After digestion, isolated cells and pieces were washed and seeded in a 25cm2 plastic flask containing culture medium, and maintained in a humidified atmosphere of 5% CO2 at air temperature of 37oC. The culture medium was composed of a RPMI 1640 with glutamax (Gibco BRL, Life Technologies, Cergy Pontoise, France) supplemented with 10% fetal calf serum and 1% antibiotics (penicilline /streptomycine, Gibco BRL, Life Technologies, Cergy Pontoise, France). All cell lines were tested for mycoplasma by Polymerase Chain Reaction (PCR) (Sigma; Look Out Mycoplasma PCR Detection Kit) according to manufacturer’s recommendations.
Cell sorting by flow cytometry
Cells from a culture flask were collected into a conical tube and centrifuged at 400g for 5 min. The supernatant was discarded and the pellet was resuspended in medium (cell culture medium Or Phosphate-Buffered Saline [PBS] with 1% bovine serum albumin). Cells were counted and resuspended at an appropriate concentration, in the range of 106–107 per mL.
The pellet was resuspended in 5 mM EDTA (ethylene-diaminetetra- acetic-acid). Cells were isolated by FACS Aria [BD Biosciences, San Jose, CA], every cell isolated was placed in a well of 96-wells plate.
Nucleic acid isolation
DNA from the cell lines and from snap-frozen tumors was isolated for Comparative Genomic Hybridization (CGH). Genomic DNA was isolated with a standard phenol-chloroform extraction protocol after Rnase treatment. Total RNA for gene expression studies was extracted from cell lines (before passage 20 and after passage 30) and from frozen tumor samples with TRIzol reagent (Gibco BRL, Life Technologies) and purified with the RNeasy Min Elute Cleanup Kit (Qiagen, Courtaboeuf, France) according to the manufacturer’s procedures. We checked RNA quality on an Agilent 2100 bioanalyzer (Agilent Technologies, Massy, France) according to the manufacturer’s recommendations.
Array-CGH analysis
DNA was hybridized to 8 x 60K whole-Genome Agilent Arrays (G4450A) according to the manufacturer’s protocol. The ADM-2 algorithm of Agilent Genomic Workbench Lite Edition 6.5.0.18 was used to identify DNA copy number anomalies at the probe level. A low-level copy number gain was defined as a log 2 ratio >0.25 and a copy number loss was defined as a log 2 ratio <-0.25. A high-level gain or amplification was defined as a log 2 ratio >1.5 and a homozygous deletion was suspected when the ratio was < -1.
Gene expression profiling
Gene expression analysis was carried out using Agilent Whole human 44K Genome Oligo Array (Agilent Technologies) according to the manufacturer’s protocol. All microarrays were simultaneously normalized using the Quantile algorithm. T-tests were performed using Gene Spring (Agilent Technologies) and P-values were adjusted using the Benjamini-Hochberg procedure. The P-value and fold change cut-off for gene selection were 0.001 and 3, respectively. Gene Ontology (GO) analysis was performed to establish statistical enrichment in GO terms using Genespring (Agilent Technologies, Massy France).
Statistical analysis
Genomic normalized data files were formatted to obtain 55077 unique probes and in case of duplicate probes the mean value was retained. Pearson’s correlations and graphs were established with R software version 2.14.1. For transcriptomic normalized data files, we excluded controlling probes, and selected unique probes for each gene by maximum Inter Quartile Range (IQR) on R environment. Overall, 30995 probes were used to perform Hierarchical Ascending Classification (HAC) with the Ward method using the “cluster” R library. The agglomerative coefficient is 0.54 for tumor/cell line analysis and 0.61 for early cell lines/late cell lines analysis.
Results
From 2009 to 2012, surgery specimens of malignant mesenchymal tumors of every patient treated at Bergonié Institute were cultured and 32 cell lines were established from 134 tumor samples submitted to cell culture (24%; Supplementary Table S1).
To test whether sarcoma cell lines were representative of their matching tumor and whether their genomic and transcriptomic profile was stable during passages, seven cell lines (Table 1) were characterized at early and late passages and compared to their matching tumor.
    Patient
    Sex
    Age (y)
    Histological    diagnosis
    Site
    FNCLCC    Grading
    Tumor    CGH profile
    Cell    line CGH profile
    Follow-up


    IB105/    IB106
    female
    79
    unclassified    sarcoma
    paravertebral
    3
    complex
    complex
    DOD    (Dead of Disease)


    IB111
    female
    83
    dedifferentiated    liposarcoma
    axillary
    3
    amplicons    (among them : MDM2,CDK4)
    complex    with amplicons (MDM2,CDK4)
    ductal    carcinoma infiltrative


    IB115
    male
    75
    dedifferentiated    liposarcoma
    paratesticular
    3
    amplicons    (among them : MDM2, CDK4)
    amplicons    (MDM2, CDK4)
    lost to    follow-up


    IB114
    female
    90
    myxofibrosarcoma
    left    thigh
    3
    complex    with arms
    complex    with arms
    DOD    (Dead of Disease)


    IB116
    male
    81
    myxofibrosarcoma
    left    thigh
    2
    flat
    complex    with arms
    lost to    follow-up


    IB117
    female
    58
    myxofibrosarcoma
    right thigh
    3
    complex
    complex
    alive    without disease
Table 1: Clinicopathological data of the tumors from which cell lines were established and type of cell lines and their corresponding tumor tissues genomic profile.
Are cell lines representative of their matching tumor?
Genome profiling was performed from DNA extracted at p50 (50 passages is widely accepted as a threshold to declare an established cell line). All cell lines harbored a genomic profile characteristic of the tumor histotype from which they were derived. IB105 and IB106 were derived from an undifferentiated sarcoma and presented highly rearranged genomes (Figure 1), as well as IB114, IB116 and IB117, which were derived from myxofibrosarcomas (Figure 2). IB111 and IB115, established from Dedifferentiated Liposarcomas (DDLPS), were characterized by an amplicon profile with a characteristic MDM2 and CDK4 amplification and a moderately rearranged genome (Figure 3). Comparing these cell line profiles to those of each matching tumor, even if we identified patterns of common alteration profiles, we observed that a few alterations were exclusive to either the cell line or the tumor. Both myxofibrosarcoma (IB114 and IB117) and DDLPS (IB111 and IB115) cell line profiles were similar to those of the matching tumors (Figures 2 and 3), but for IB105 and IB106, which were derived from one undifferentiated sarcoma, genomic profiles were clearly different (Figure 1) even if a large part of the alterations was shared.
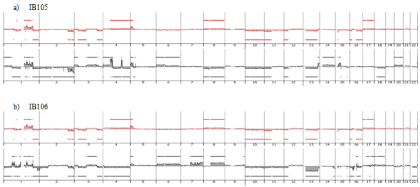
    Figure 1:  Genomic profiles of undifferentiated sarcoma established cell lines a) IB105, b) IB106 and the corresponding tumor: red profiles corresponding to tumor
profile and black profiles corresponding to cell line p50.
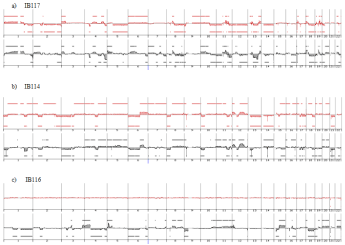
    Figure 2:  Genomic profiles of myxofibrosarcomas established cell lines and the corresponding tumor: red profiles corresponding to tumor profile and black profiles
corresponding to cell line p50.
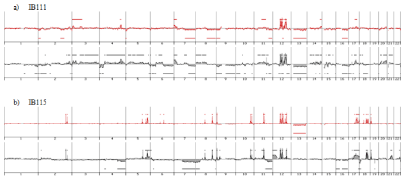
    Figure 3:  Genomic profiles of dedifferentiated liposarcomas established cell lines and the corresponding tumor: red profiles corresponding to tumor profile and
black profiles corresponding to cell line p50.
To evaluate the representativeness of the cell line at the transcriptomic level, we carried out unsupervised clustering of the transcriptomic profiles of all cell lines and tumors (Figure 4a). The samples were split into two groups: cell lines and tumors, with a large distance between the two entities. Among the 15433 probes differentially expressed (P <0.05) between cell lines and tumors, 9939 probes were up-regulated in the cell lines whereas 5494 were downregulated. Regarding the 9939 up-regulated probes, GO analysis (Supplementary Table S2a) identified 178 enriched GO terms (P <0.05), with the most frequent being mitosis and cell cycle. Regarding the 5494 down-regulated probes in the cell lines, GO analysis (Supplementary Table S2b) identified 273 enriched GO terms (P <0.05), with the top ranked being associated with immune response and cell adhesion. Considering that these differentially expressed genes and enriched pathways were associated with the in-vitro cell culture conditions and not with the tumor cell biology, we performed a second unsupervised clustering removing both the 15433 probes differentially expressed and the genes associated with the 451 GO terms differentially enriched. Four of the seven cell lines (IB105, IB106, IB114 and IB117) clustered with their matching tumor (Figure 4b).
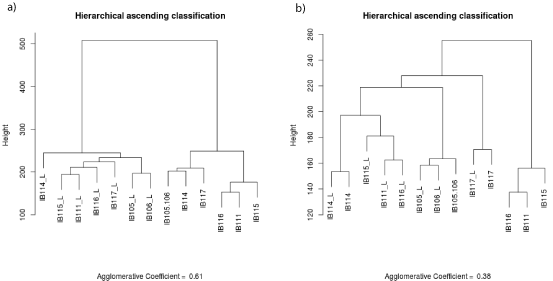
    Figure 4:  Gene expression profiles of late cell lines and corresponding tissue. a) Unsupervised clustering on 30 995 probes b) Unsupervised clustering on 12 695
probes, number total of probes minus probes differentially expressed between cell line and tumors (P< 0.05) and genes associated to 451 GO enriched L: late
culture.
Do cell line genome and transcriptome evolve in culture?
To test whether the cell line genome can evolve in vitro, we performed a genome profiling of each cell line every 10 passages. To evaluate the slight variation associated to technical variability, we performed two genomic profiles per sample, on seven samples, in two independent experiments (extraction and array-CGH) and we calculated the correlation coefficients (r) between the two profiles of the same sample (data not shown). This experiment enabled us to consider two genomic profiles identical when the correlation coefficient was higher than 0.93 [range: 0.93 to 0.99].
For all cell lines, the genomic profiles are similar from p10 to p50 (Figure 5), with correlation coefficients ranging from 0.9 to 0.98 from p20 to p50 (Table 2). Nevertheless, for IB106, we observed a slight difference between profiles from p10 to p20 (correlation coefficient = 0.66), whereas profiles at later passages were highly correlated (correlation coefficient >0.94). These results indicate that no genomic changes occur during cell culture as demonstrated by CGH profiling.
    p10 vs. p20
    p20 vs. p30
    p30 vs. p40
    p40 vs. p50


    IB105
    0.99
    0.98
    0.96
    0.96


    IB106
    0.66
    0.94
    0.95
    0.98


    IB111
    0.83
    0.93
    0.90
    0.92


    IB114
    0.94
    0.98
    0.94
    0.90


    IB115
    0.96
    0.89
    0.95
    0.95


    IB116
    0.92
    0.94
    0.95
    0.98


    IB117
    0.97
    0.95
    0.91
    0.95
Table 2:  Pearson’s correlation coefficient for each cell line between one passage
and the previous one. p = passage.
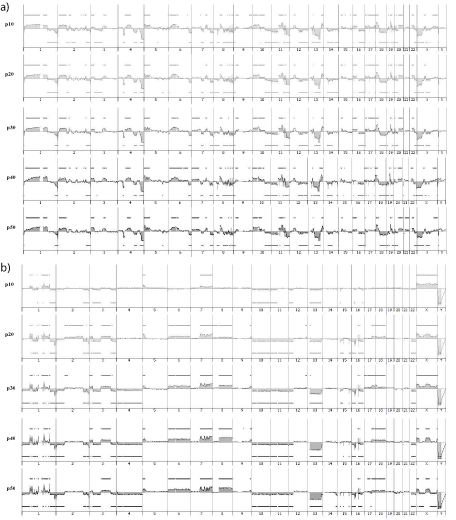
Figure 5: a) IB117 genomic profiles at p10, p20, p30, p40, p50. b) IB106 genomic profiles at p10, p20, p30, p40, p50.
We performed two expression profiling experiments for each cell line, one in early and one in late stages of culture with at least 20 passages between the two profiles. Unsupervised clustering showed that early and late gene expression profiles for each of the IB114, IB115, IB111, IB116 and IB117 cell lines clustered together (Figure 6). For IB105 and IB106 on the other hand, the early passages of both cell lines and the late passages of both cell lines clustered together.
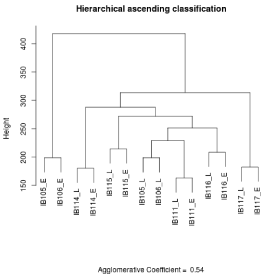
    Figure 6:  Gene expression profiles of cell lines at early culture and at late
culture. Clustering on 30 995 probes E: early culture L: late culture.
Does observed genome stability keep Intra-tumoral heterogeneity hidden?
The aim of our study was to investigate the intra-tumoral hetereogeneity that probably causes differences between original tumor and matching cell line genomes.
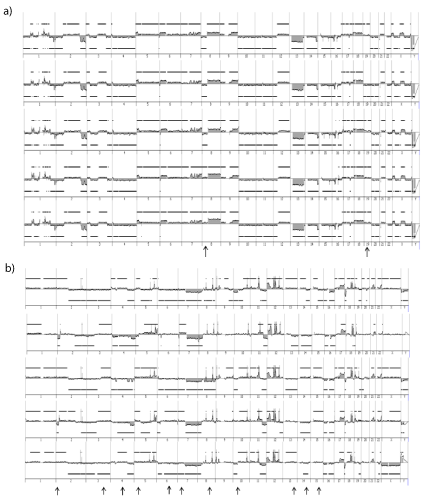
Two cell lines with distinct genetics, IB106 (undifferentiated sarcoma) and IB115 (DDLPS) were sub-cloned at the single cell level.
12/96 (12.5%) and 21/96 (22%) isolated single cells from IB106 and
IB115, respectively, underwent clonal expansion. CGH profiling
of these individual clones revealed that IB106 sub-clones were all
super imposable to the IB106 cell line (Figure 7a) with a correlation
coefficient ranging from 0.92 to 0.99. In contrast, the genome of the
IB115 sub-clone differed from that of the cell line with many specific
alterations present only in the cell line or only in one clone (Figure
7b). Accordingly, the correlation coefficient interval dropped to 0.71
to 0.92. As evidenced in primary cell lines and evaluated by CGH, the
sub-clone genomes did not show any significant variation at passages
2, 10 and 15 post sub-cloning (0.9 Currently, clinical management of STS consists mainly of
surgical resection with adjuvant therapies that depend on surgical
margins and tumor histological type and grade. No targeted therapy
is currently available, except for GISTs with imatinib mesylate
(Gleevec, Novartis Pharma AG) [21]. The main breakthrough
leading to a targeted therapy would first be the identification of a
recurrent genomic alteration and then, its biological characterization.
Furthermore, in vitro cell lines with human xenograft models may
be useful in understanding the biology of this tumors and predicting
drug response [22]. Even if some models are already available, they
suffer from two main pitfalls: lack of representativeness of the tumors
from which they were derived; and lack of information about their
evolution over passages. We evaluated the genomic representativeness of several cell lines
by comparing genomic and transcriptomic profiles from the cell lines
and the original tumors. Our results indicate that the main oncogenic
events are identical in the tumor and matching cell line (eg, MDM2
and CDK4 amplifications in DDLPS, RB1 loss in US and MFS). As
reported by Wistuba et al. [23,24] in lung and breast cancers, in our
series, four cell lines (IB105, IB106, IB114 and IB117) are genetically representative of their corresponding tumors. Among them, two are
undifferentiated sarcomas and two are myxofibrosarcomas. The two
undifferentiated sarcoma cell lines are derived from the same tumor
so the three genomic profiles have similar alterations (1q, 2qter, 5p,
loss of chromosome 10, 11p, 12p, 13, and 16) but some alterations
are specific to each cell line. The IB105 cell line genomic profile
retains its similarities with the IB105-106 tumor genomic profile over
time, and is pure in early passages (before passage 10). The IB106
cell line genomic profile has a weak correlation coefficient with its
corresponding tumor genomic profile at passage 10. After passage 10,
the correlation coefficients between passages increase and stabilize,
demonstrating that the same similarity of the two genomic profiles
(tumor and each passage) is stable through time. This probably means
that at early passages this cell line is contaminated by other clones
or non-tumoral cells and, that cells or clones composing the cell line
reach a stabilization of their relative proportions between passage 20
and passage 30. The IB114 cell line retains the genomic features of the original
tumor. However, the correlation coefficient decreases over passages.
This can be explained by a contamination of non-tumoral cells, clonal
selection, or both. Cell line genomic profiles show only a few alterations that are more
frequently represented than in the corresponding tumor genomic
profiles: deletion of CDKN2a and RB1, gains on chromosome 12,
and alterations specific to the cell line: gains on chromosome 5, and
chromosome 8q. Other common alterations are less frequent in the
cell line than in the corresponding tumor. This observation permits
us to conclude that there is an in vitro clonal selection. To evaluate the transcriptomic representativeness of the cell
lines in relation to the original tumor at late passages, we compared
their transcriptomic profiles. Two different clusters were identified:
tumors and cell lines. As for Gottschling et al. [25,26], GO analysis
on 15 433 probes differentially expressed between the two entities,
showed mitosis and cell cycle to be overexpressed in the cell lines,
and immune response, adhesion, proliferation, differentiation and
angiogenesis to be under expressed. All these deregulated pathways
are linked to microenvironments. Communication between cells
and their microenvironments occurs through a complex network of
signals generated by cell-extracellular matrices and cell-cell adhesion
and junctional molecules, as well as by collaboration between
epithelial, stroma and other organ-specific cell types [27]. However, there were also common gene expression patterns
showing the relationship between cell lines and their corresponding
tumor tissues with cell lines being representative of the tumor in
terms of oncogenic pathways. This is confirmed by the clustering of
probes remaining after removing the most differentially expressed
genes and GO terms. Four of the seven pairs clustered together. These
four cell lines (IB105, IB106, IB114 and IB117) have transcriptional
programs close to their corresponding tumors. IB111 and IB115 cell lines, derived from DDLP, have genomic
profiles close to their corresponding tumors but a cell line expression
profile distinct from their matching tumors. However the MDM2/
CDK4 over-expression is found in both the cell line and the
corresponding tumor expression profiles. The IB111 tumor genome
is less prone to rearrangement than the cell line genome, however, in the tumor genomic profile, all alterations detected are also detected
in the cell line genomic profile but less represented. This observation
suggests a contamination of non-tumoral cells in the tumor. Alterations present in the IB115 tumor genome are also
observed in its corresponding cell line except for two amplicons
on chromosome 6, one amplicon on chromosome 8 and the loss of
chromosome 13. In the cell line genomic profile we can observe an
alteration not detected in its tumor genomic profile. On this cell line,
we performed clonal selection, and after amplification, we established
the genomic profile of each clone. This experiment showed genomic
profiles with common alterations (amplicons) and with some clone
specific alterations (data not shown). The IB115 cell line represents a
pool of clones of the IB115 tumor. The contamination by non-tumoral cells for IB111 and by others
clones for IB115 explain why their global expression profiles did not cluster with their corresponding cell lines. Concerning IB116,
profiling experiments showed that the tumor genome was flat and
the cell line genome rearranged. The diagnosis of IB116 tumor is
myxofibrosarcoma, which is characterized by complex genomics;
the karyotypic abnormalities are multiple numerical and structural
rearrangements [28,29]. We can conclude from these observations
that the flat tumor genomic profile of IB116 shows a strong
contamination by non-tumoral cells. For the seven established cell lines, genomic profiles are stable
across passages in our culture conditions. Furthermore, for two cell
lines (IB106/IB111), we can observe purification over time, which is
illustrated on the IB106 genomic profile by the increasing detection
of the chromosome 13 loss. A clonal in vitro selection is induced from
culture conditions, so one or several clones of the original tumor have
the capacity to adapt to the new environment [30,31]. Trancriptomic profiles are stable across time for five cell lines.
Indeed, the transcriptomic profiles of the same cell line clustered
together, even if in early stages the cell line was contaminated by nontumoral
cells or by other clones. For two cell lines, IB105/IB106, the
two early transcriptomic profiles clustered together and the two late
transcriptomic profiles clustered together, which is probably because
the IB105/106 cell lines arose from the same original tumor so one
was certainly contaminated by the other one and in late stages only
one clone survived. However, the transcriptomic profiles stay close
over time. These experiments indicate that the cell lines’ genomic and
transcriptomic profiles are stable across time. Overall, results strongly suggest that among the intra-tumoral
heterogeneity, a subset of clones establish in culture, creating a
heterogeneous cell line more or less representative of the tumor
depending on the intra-tumoral heterogeneity of the initial tumor.
However, after this first selection step allowing culture establishment,
the cell line, even if heterogeneity remains, is genetically stable across
passages, in non-modified cell culture conditions. This probably
means that, even if pleomorphic sarcomas are clearly genetically
unstable at the cellular level, they appear to be genetically stable at the
multicellular one. This study allows us to extrapolate these genomic and
transcriptomic stabilities across time, to other cell lines established in
our lab. Since 2009, we have systematically submitted to cell culture
every sarcoma resected at the Institut Bergonié Cancer Centre. The
aim of the project is to develop a cell line bank. For all cell lines,
genomic, transcriptomic and clinical data are available. At present,
we have established 32 sarcoma cell lines (Supplemental Table S1).
Therefore, a panel of sarcoma cell lines is now available that will be
crucial to further understand genomic alterations, sarcoma biology
and to manage preclinical studies and clinical trials. Supported by the European Connective Tissue Cancer Network
and the French Ligue Regionale Contre le Cancer. 0102.
Discussion
Acknowledgement
References