
Editorial
Gerontol Geriatr Res. 2024; 10(2): 1101.
Using Olink Proteomic Technology to Identify Biomarkers for Early Diagnosis of Postmenopausal Osteoporosis
Xiuping Yin1#; Chunyan Li2#; Xiao Sun3; Wei Deng4*; Xiaopei Li5; Guangya Wang1*
1The Second Deparment of Endocrinology and Metabolism, Cangzhou Central Hospital, China
2Department of Clinical Laboratory, Beijing Jishuitan Hospital, Capital Medical University, China
3The Third Department of Tuberculosis, Cangzhou third Hospital, China
4Department of Endocrinology, Beijing Jishuitan Hospital, Capital Medical University, China
5Hebei Medical University, Hebei Province, China
*Corresponding author: Guangya Wang, MD, PhD Cangzhou Central Hospital, Xinhua Road, Cangzhou, Hebei Province, China; Wei Deng, MD, PhD, Department of Endocrinology, Beijing Jishuitan Hospital, Capital Medical University, Xinjiekou East St, Xicheng District, Beijing, China. Email: wangguangya2024@163.com
#These authors have been equally contributed to this article.
Received: June 04, 2024 Accepted: July 01, 2024 Published: July 08, 2024
Editorial
Osteoporosis, a systemic bone disorder, is characterized by diminished bone mass and disruption of bone tissue microarchitecture, leading to heightened bone fragility and vulnerability to fractures [1]. Disturbingly, recent findings indicate a significant surge in osteoporosis prevalence among postmenopausal women and individuals aged over 70 [2,3]. Clinically, postmenopausal osteoporosis (PMOP) escalates the risk of both asymptomatic vertebral compression fractures and symptomatic fractures, encompassing the wrist or hip [4]. Although Dual-energy X-ray Absorptiometry (DXA) currently stands as the gold standard for osteoporosis diagnosis [5], its high costs and radiation exposure pose notable drawbacks. In light of this, our study harnesses Olink proteomics to identify potential biomarkers for the diagnosis, early prevention, and treatment of PMOP. Employing the diagnostic criteria outlined in the 2022 edition of the Guidelines for Diagnosis and Treatment of Primary Osteoporosis [6] and the 2018 edition of the Chinese Quantitative CT (QCT) Diagnostic Guidelines for Osteoporosis [7], Postmenopausal women were classified into three groups based on dual-energy X-ray absorptiometry and Quantitative Computed Tomography (QCT) results: the osteoporosis group (T value=-2.5) consisting of 24 cases, the bone mass loss group (-2.5<-1.0) with 20 cases, and the control group (T value=-1.0) comprising 16 cases. Fasting serum samples were collected and subjected to biochemical analysis. Using Olink proteomics technology, based on its core protein detection patent - Proximity Extension Assay (PEA), multiple protein expression values were accurately detected from each sample. The protein expression values were standardized using IPC (Inter-plate Control) Normalization. Samples and proteins were grouped and classified based on similarity to generate a clustering heatmap. Hierarchical clustering analysis of the heatmap (depicted in Figure 1A-C) revealed a consis tent trend in the expression of differentially expressed proteins within each group. However, there were significant variations in the expression of these proteins among the different groups. Illustrated in the volcano plot of differentially expressed proteins among the groups (shown in Figure 2A-C), To validate the proteomic data, six differentially expressed proteins exhibiting substantial alterations were selected, and box plots were generated (Figure 3A-F).Further, subjects from the osteopenia and osteoporosis groups were combined (Group 2-3) and compared with the control group (Group 1) characterized by normal bone mass. Notably, in Group 2-3, the expression of ADAM-TS13, ANGPT1, and CTRC increased, while the expression of IL6, IDUA, and TRAIL-R2 decreased. Their trends of variation were consistent with the outcomes of proteomic analysis. To identify proteins that have similar or related functions, we employed the STRING online analysis tool (http://www.string-db.org/) to construct an intricate Protein-Protein Interaction (PPI) network. We then computed the Pearson correlation coefficient for pairs of such proteins and created the clustering heat map shown in Figure 4 to analyze the correlations between the different proteins. Our investigation revealed 61 differentially expressed proteins among the study samples. Differential protein Venn analysis was conducted for the comparisons between osteopenia (M) and normal bone mass (C) groups (Figure 5A), osteoporosis (S) and normal bone mass (C) groups (Figure 5B), as well as osteoporosis (S) and osteopenia (M) groups (Figure 5C). The outcomes, illustrated in Figure 5. Through ROC curve analysis, we identified 12 candidate molecules with potential relevance to PMOP: CD40-L, PGF, IL-1ra, PRSS27, TF, SCF, KIM1, PRELP, HO-1, GDF-2, MMP12, and CD4. Correspondingly, ROC curves were generated for these twelve distinct proteins. As depicted in Figure B, the AUC was 1, indicating a comprehensive discriminatory ability. Our findings underscore the unique protein profiles and their potential diagnostic significance in distinguishing different osteoporosis groups. Concurrent assessment of plasma biomarkers shows promise in facilitating early detection and prognosis of PMOP. Data availability statement The data that support the findings of this study are available from the corresponding author upon reasonable. Funding statement The study was funded by Beijing Jishuitan Hospital Nova Program XKXX202212; This study was supported by the Beijing Municipal Health Commission (BJRITO-RDP-2023). Conflict of Interest The authors declare that they have no conflict of interest.
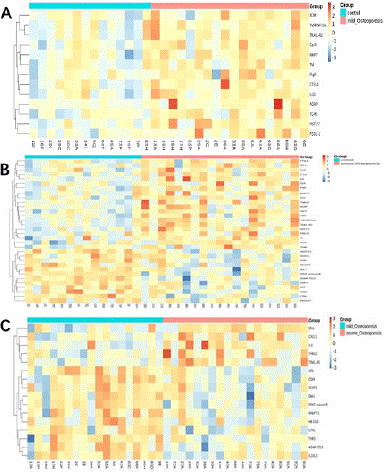
Figure 1: Clustering heat map of differentially expressed proteins. The abscissa in the figure represents the name of the sample, and the ordinate represents the name of the differentially expressed protein, and the proteins are clustered hierarchically. The color corresponding to the gradient of NPX value from small to large is blue to red gradient, and the intermediate color is white.The control group is represented by control, the osteopenia group is represented by mild-Osteporosis, and the osteoporosis group is represented by severe-Osteporosis.
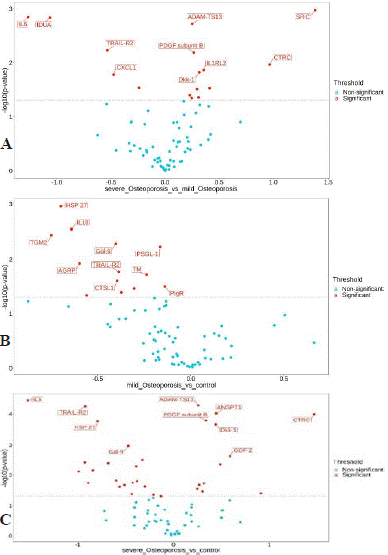
Figure 2: Differentially expressed protein volcano map display. The abscissa is the protein expression difference (NPX Group2 - NPX Group 1); the ordinate is the P value (logarithmic transformation with base 10). The blue dots on the lower side of the figure represent proteins with no significant difference, and the red dots on the upper side represent proteins with significant differences.The control group is represented by control, the osteopenia group is represented by mild-Osteporosis, and the osteoporosis group is represented by severe-Osteporosis
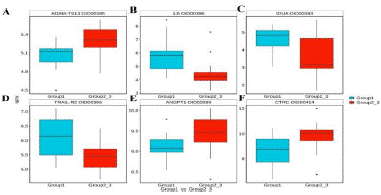
Figure 3: Boxplot display of differentially expressed proteins. The abscissa in the figure is the group name, and the ordinate is the sample NPX value. The rectangular box corresponds to the upper and lower quartiles (Q1 and Q3) of the data. The median line inside the rectangular box is the median, the upper line is Q1-1.5IQR, and the underline is Q3+1.5IQR, where IQR is the quartile Spacing, IQR=Q3-Q1.
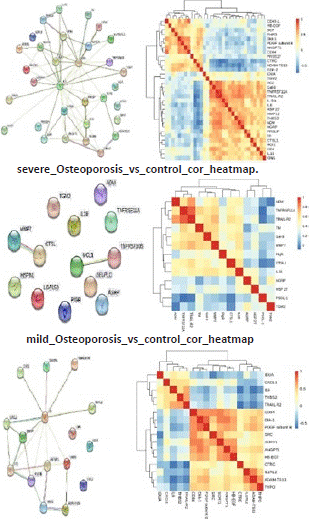
Figure 4: Heat map of differential protein coefficients. The horizontal and vertical coordinates in the figure represent the names of differential proteins, red indicates positive correlation, blue indicates negative correlation, and darker color indicates higher degree of correlation.
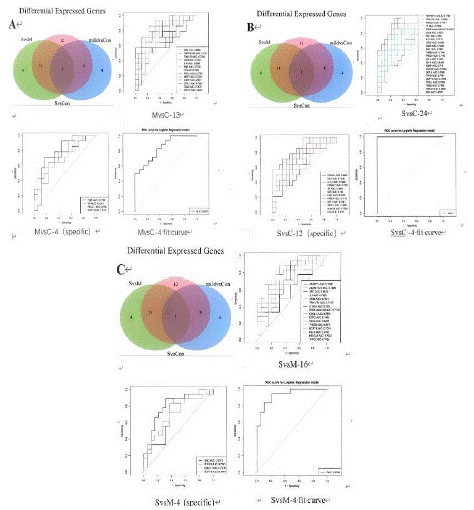
Figure 5: Differential Protein Venn Diagram and ROC Curve. The closer the value of the area under the curve (AUC) to 1, the better the diagnostic value. When the AUC is 0.5-0.7, the accuracy is low, when the AUC is 0.7-0.9, the accuracy is high, when the AUC is above 0.9, the accuracy is very high, and when the AUC is below 0.5, there is no diagnostic value.
References
- Consensus development conference: diagnosis, prophylaxis, and treatment of osteoporosis. AM J Med. 1993; 94: 646-650.
- Bijelic R, Milicevic S, Balaban J. Risk factors for osteoporosis in postmenopausal women. Med Arch. 2017; 71: 25–28.
- Tian L, Yang R, Wei L, Liu J, Yang Y, Shao F, et al. Prevalence of osteoporosis and related lifestyle and metabolic factors of postmenopausal women and elderly men. Medicine (Baltimore). 2017; 96: e8294.
- Rosen CJ. The Epidemiology and Pathogenesis of Osteoporosis. In: Feingold KR, Anawalt B, Blackman MR, et al., eds. Endotext. South Dartmouth (MA): MDText.com, Inc. 2020.
- Meeta, Digumarti L, Agarwal N, Vaze N, Shah R, Malik S. Clinical practice guidelines on menopause: An executive summary and recommendations. J Midlife Health. 2013; 4: 77-106.
- Chinese Medical Association Osteoporosis and Bone Mineral Disease Branch, Zhang Zhenlin. Guidelines for the diagnosis and treatment of primary osteoporosis (2022). Chinese General Medicine. 2023; 26: 1671-1691.
- Cheng Xiaoguang, Wang Liang, Zeng Qiang, et al. Guidelines for the diagnosis of osteoporosis by quantitative CT (QCT) in China (2018). Chinese Journal of Osteoporosis. 2019; 25: 733-737.