
Review Article
Ann Hematol Onco. 2024; 11(3): 1458.
Novel Method of Human Plasma Nanovesicles Isolation and Their use for Diagnosing of Certain Types of Lymphomas
Maria A Slyusarenko¹; Natalia P Yevlampieva¹*; Olga S Vezo²; Anastasia V Malek³
¹Department of Molecular Biophysics and Polymer Physics, Saint Petersburg State University, St. Petersburg, Russia
²Center for Diagnostics of Functional Materials for Medicine, Pharmacology, and Nanoelectronics, Saint Petersburg State University, St. Petersburg, Russia
³Subcellular Technology Lab, N.N. Petrov National Medical Research Center of Oncology, St. Petersburg, Russia
*Corresponding author: Natalia P Yevlampieva Department of Molecular Biophysics and Polymer Physics, Saint Petersburg State University, St. Petersburg, Russia. Email: n.yevlampieva@spbu.ru
Received: July 08, 2024 Accepted: July 30, 2024 Published: August 06, 2024
Abstract
The present research aims to overcome the current limitations in utilizing extracellular vesicles circulating in mammalian biological fluids for clinical use. The human blood plasma vesicles contain valuable information regarding the health of an organism. The main challenges lie in isolating, concentrating, and preserving these bio-objects for further analysis. Our work focuses on the development of a method using a two-phase polymer system composed of dextran and polyethylene glycol. This system allows for the extraction of a fraction enriched in extracellular nano-sized vesicles from blood plasma. The study of polymers behavior and their phase separation under different conditions were performed. The impact of temperature, pH, molecular weight, and concentration of both polymers in human plasma on the extraction of nano-sized vesicles was investigated. Additionally, the interaction mechanism between the polymers of two-phase system and plasma components was studied by employing the model mixtures. The results of this study have revealed that polyethylene glycol plays a vital role in binding plasma proteins during the separation process within two-phase system, when both polymers are innately unreactive towards the nano-sized vesicles. The second part of the work involved proving that the amount of extracellular nanovesicles released from one cubic centimeter of plasma is sufficient for biomedical analysis. To accomplish this, a specialized biosensor based on gold nanoparticles modified with DNA-aptamers was developed. The biosensor functioned by leveraging the competing properties of DNA-aptamers which could both hinder the enzymatic activity of the gold nanoparticles and bind to specific markers on the surface of nanovesicles isolated from human plasma. The proposed biosensor has been tested as the analytical system for diagnosing and monitoring of Hodgkin lymphoma, and has shown promising results compared to traditional diagnostic methods for this disease.
Keywords: Extracellular vesicles; Two-phase polymer systems; Dextran; Polyethylene; Gold nanoparticles; Biosensor
Introduction
The progress in harnessing nano-sized entities has facilitated their pervasive integration across numerous spheres of human activity, particularly in the field of medicine. Quite often, this has become feasible through the utilization of polymers. Water-soluble polymer macromolecules, both synthetic and natural, being typically nano-sized objects, are presently extensively utilized across various nanotechnologies. A prime example is the use of biocompatible polymers as carriers for low molecular weight drugs, thereby improving their solubility and extending their targeting action. In this study, a solution of polymers is employed to separate multicomponent biological fluid, like human blood plasma, in order to isolate vesicles of specific sizes for their subsequent diagnostic purposes. A novel method of nano-sized vesicles isolating from plasma relies on the physical properties of so-called two-phase polymer systems. The properties of isolated vesicles in this study are analysed using a test system involving the gold nanoparticles. But first it is essential to discuss what the vesicles are and why isolating them is crucial. Vesicles are the small-sized structures that form within cells, containing a variety of molecules that can be valuable for diagnostic purposes. They hold potential as biomarkers or indicators for various conditions or diseases. Vesicles are present in all biological fluids of living organisms. These are membrane formations, the biological function of which is associated with mediating the interaction of anatomically distant cells [1 -3] . In other words, vesicles circulating in biological fluids transport various substances, such as proteins, nucleic acids and many others, from one part of the body to another, carrying out the intercellular exchange. Vesicles are capable of carrying proteins both encapsulated and attached to the surface of their lipid membrane. As a whole, a vesicle population is highly heterogeneous in size, form and morphology, since each cell type produces its own vesicles. The size of the vesicles varies in the range from 30 nm to 10 μm. Heterogeneity is one of the reasons why it is difficult to separate and concentrate one type vesicles for subsequent study or analysis [3] . Interest in vesicles has grown significantly in recent years in connection with the award in 2013 of the Nobel Prize in Physiology or Medicine to J. E. Rothman, R. W. Schekman and T.C. Südhof for their work on the mechanism that controls the transport of «membrane-bound parcels or 'vesicles' through cells», and in connection with the proof of the high diagnostic significance of these objects [2–4].
Extracellular vesicles found in human plasma primarily exist as spherical particles with nano-sized diameters [1 ,3] . Recently it was demonstrated that extracellular vesicles, approximately 100 nm in diameter, exhibit specific alterations in their surface proteins, showing potential for early cancer diagnosis [5,6]. This discovery has spurred the exploration of new, more streamlined methods for isolating such nanovesicles compared to current techniques. The current approaches can be divided into two main groups: those reliant on the physical properties of extracellular vesicles and those based on the chemical characteristics of the vesicular membrane. The foremost method, which allows to obtaining the pure concentrate of nano-sized vesicles, considered now as best one, involves a double-stage ultracentrifugation process at high speeds of 11 0x103g [7]. However, while highly effective, this technique is complex and not readily accessible for widespread application in medical practice. Hence, the quest for alternative methods remains pertinent.
The mentioned two-phase polymer systems also require an introduction. Divided into two phase solution based on hydrophilic polymers like polyvinylpyrrolidone, polyethylene glycol, polypropylene glycol, their copolymers, and dextran derivatives have long been recognized, predominantly confined to laboratory settings [8]. These systems are typically formed by combining a low-molecular-weight salt with a high-molecular-weight compound or by blending two polymers incompatible in an aqueous environment. Their significance lies in the potential isolation or separation of biological entities: cells, organelles, enzymes, proteins, and peptides, provided these substances remain undamaged [8–11] . The success of these systems is gauged by the concentration of the chosen entity in one phase or at the interphase boundary. However, this method is mainly empirical, demanding experimental determination of parameters and conditions for its effectiveness concerning the target entity. Hence, the utilization of two-phase polymer systems remains limited in analytics and biotechnology. Investigating the behavior and operational patterns of two-phase polymer systems holds significance owing to their multitude of potential applications. It's essential to highlight that within this study framework, the separation of biological object mixtures using two phase polymer systems, based on affine principles, is not considered as we aim for the simplest possible approach.
In this study, the dextran-polyethylene glycol (dextran–PEG) Two-Phase Polymer System (TPPS) comprised of commercially available and biocompatible polymers, is selected as the method for isolating extracellular Nanovesicles (NVs). However, it's important to note that this particular TPPS isn't specifically employed for isolating NVs from blood plasma. While instances of using this system for targeted isolation of various biological entities exist [8–14], unfortunately, there lacks a comprehensive set of criteria for selecting TPPS parameters such as the Molecular Weight (MW) of polymers or their quantitative relationship. Apart from the mentioned parameters, practical implementation of TPPS requires the additional consideration of factors like temperature, pH of the medium, ionic strength and composition of low-molecular-weight ions [1 2–14].
The primary objective of this research is not only to establish the criteria for employing TPPS dextran–PEG in isolating specific-sized vesicles from human blood plasma but also to investigate the mechanisms behind how TPPS polymers interact with plasma components under conditions near the system's bimodal curve. Additionally, the study aims to quantitatively evaluate the effectiveness of isolating nanoscale plasma extracellular vesicles using dextran–PEG TPPS, facilitating their subsequent analysis. This research is intricately connected to advancing liquid biopsy techniques by utilizing blood plasma vesicles for the early detection and surveillance of cancer.
Experimental
Materials
Components of two-phase polymer systems: To create the TPPSs, we utilized polymers sourced from renowned biomedical manufacturers (as indicated in the first column of Table 1). Six samples of PEG and three samples of dextran were procured, encompassing a wide range of molecular weights; their numbers are given in Table 1. These polymers were used without any additional purification steps. Notably, PEG stands as a widely recognized synthetic polymer known for its biocompatibility (Figure 1), while dextran represents a polysaccharide exhibiting variable branching patterns contingent upon its source.
Sample
[n] ×10-2,
cm3/g,
(k´)Δρ/Δc,
g/cm3D0×108, cm2/s
Rh ×107, cm
Mw ×10-3,
g /molA2×104
mol×mL/g2A0×1010
(CGS)Dextran-1
(Loba Chemi)0.14±0.01
(0.53)0.351±
0.00766 ±7
3.6 ±0.4
19.4 ±0.2
3.9± 0.4
2.7±0.5
Dextran -2
(Serva)0.36±0.03
(0.55)0.364± 0.002
31±5
8±1
320±10
2.0± 0.4
–
Dextran -3
(Sigma-Aldrich)0.48±0.05
(0.46)0.403±
0.00120±2
11.9±0.3
470±10
1.7± 0.3
3.8±0.4
PEG-1
(Serva)0.18±0.01
(0.54)0.162±
0,002104±10
2.3±
0.44.9±0.5
–
3.1±0,3
PEG -2
(Sigma-Aldrich)0.21±0.01
(0.49)0.161±
0.00191±9
2.6± 0.3
6.6±0.5
–
3.1±0.3
PEG -3
(Loba Chemi)0.28±0.02
(0.46)0.161±
0.00162±6
3.8± 0.4
12±1
30± 3
2.9±0.3
пЭГ-4
(Loba Chemi)0.11±0.01
(0.62)0.151± 0.002
112±12
2.1±0.2
9±1
–
3.4±0.4
PEG 5
(Sigma)0.49±0.04
(0.20)0.136 ±0.004
57±6
4.2±0.2
17±1
27± 2
3.6±0.3
PEG -6
(Sigma)0.63±0.01
(0.25)0.162±
0.00241±4
5.8±0.1
26.2±0.5
25± 4
3.2±0.3
Table 1: Hydrodynamic characteristics of dextran and PEG samples in PBS at 298 K: intrinsic viscosity [ɳ], Huggins constant k', density increment Δρ/Δc, translation diffusion coefficient D0, hydrodynamic radius Rh, molecular weight Mw, second virial coefficient A2 and hydrodynamic invariant A0.
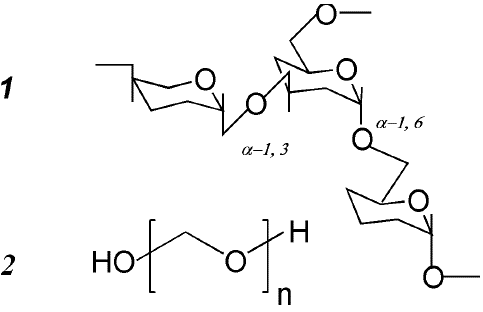
Figure 1: Structure of dextran (1) and PEG (2).
For this study, dextran samples were specifically chosen, all derived from the bacteria strain Leuconostoc mesenteroides, ensuring a low branching percentage of 5%. In the structure of dextran, the monomers constituting the primary polysaccharide chain are linked by a-1,6 bonds, while the side branch chains connect through a-1,3 bonds (Figure 1).
Phosphate-buffered saline (PBS or phosphate buffer) at pH value of 7.4 was used as the main solvent in the work.
Biological materials: The study was approved by the local ethics committee of N.N. Petrov NMRC of Oncology (10.11 .2017, protocol AAAA-A18-118012390156-5) and conducted in accordance with the ethical guidelines outlined in the Declaration of Helsinki. Plasma was obtained from healthy donors in the blood transfusion department. All participants signed a voluntary and informed study participation form. Blood was collected in a BD Vacutainer spray-coated Ethylenediaminetetraacetic Acid (EDTA) tubes, and plasma was immediately separated from the blood, aliquoted, and stored at -800 C. Before use, plasma was slowly thawed at +40 C. In order to remove cells, cellular detritus and large protein complex plasma was centrifuged: 300 g – 10 min, 2000 g – 20 min, 10000 g – 40 min.
Experimental Methods
The static light-scattering method was used to determine the weight-average molecular weights Mw of polymer samples. Measurements of the intensity of scattered light in polymer solutions in PBS were carried out according to the standard procedure in the range of scattering angles of 300–1400 using the Photocor Complex installation (Russia) of the resource center of St. Petersburg State University “Center for Diagnostics of Functional Materials for Medicine, Pharmacology, and Nanoelectronics.” The light source was a semiconductor laser (25 mW) with a wavelength of 445 nm; data processing was carried out using the double extrapolation method according to Zimm procedure [1 5].
The refractive indices of the solutions were determined using an Abbemat WR/MW refractometer (Anton Paar) from the named above resource center.
To determine the hydrodynamic sizes Rh of the objects in solution, two methods were used: Dynamic Light Scattering (DLS) [1 6] and Nanoparticle Tracking Analysis (NTA) [1 7]. DLS measurements were carried out in the corresponding mode of the Photocor Complex spectrometer. A laser (25 mW) with a wavelength of 654 nm was used as the radiation source. The range of scattering angles was varied from 400 to 1400 and the measurements were carried out at a temperature of 298 K.
The relaxation-time spectra obtained by recording scattered light intensity at different angles were analyzed using the DYNALS program [1 8]. To determine the translation diffusion coefficient D, the dependence of the inverse relaxation time 1/τ on the squared wave vector q2 was obtained from four to five solute concentrations. Each of the obtained dependences was approximated by a linear function. According to the approximation data, the diffusion coefficients D at each concentration were obtained from the slopes of the straight lines, and then the concentration dependence of D was obtained, which, when extrapolated to zero concentration ?, made it possible to determine the values D0 = limc→0 D (Table 1). The typical particle size variations in the solutions of PEG and dextran samples obtained by DLS are shown in Figure 2. One can note also the difference in the width of the distributions for these polymers.
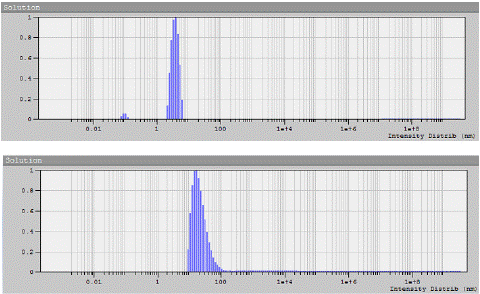
Figure 2: Dependence of scattered light intensity on particle size for sample PEG-6 at concentration of 1.495 × 10⁻² g/cm3 (a) and for sample dextran-2 at concentration of 0.05 × 10⁻² g/cm3 (b) in phosphate buffer at the scattering angle of 900, obtained by the DLS method.
dependence of the diffusion coefficients D for PEG-5 in PBS at 298 K (b). The measurements were carried out at concentrations of c1 = 2.967, c2 = 1.992, c3 = 1.503, c4 = 0.991 and c5 = 0.573 × 10⁻² g/cm3.
An example of DLS relaxation time data processing is shown for one of the PEG samples in Figure 3. The concentration dependences of the translation diffusion coefficients D for dextran samples are shown in Figure 4a.
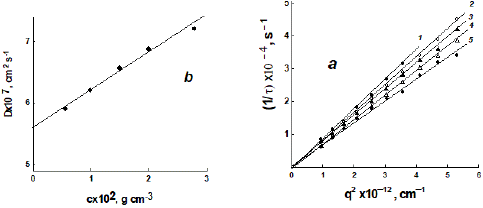
Figure 3: Dependences of the inverse relaxation times 1/t of particle concentration fluctuations in solution on the squared scattering vector q2 (a) and the corresponding concentration dependence of the diffusion coefficients D for PEG-5 in PBS at 298 K (b). The measurements were carried out at concentrations of c1 = 2.967, c2 = 1.992, c3 = 1.503, c4 = 0.991 and c5 =0.573 × 10⁻² g/cm3.
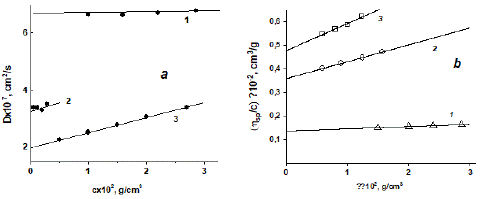
Figure 4: Concentration dependences of the diffusion coefficient D (a) and the reduced viscosity value ɳsp/c (b) for dextran samples in PBS at 298 K. The numbers of straight lines correspond to the numbers of dextran samples in Table 1.
The hydrodynamic radii Rh of macromolecules and particles in the studied solutions were obtained using the Stokes–Einstein relation (1) and experimentally determined translation diffusion coefficients D0:
Rh = kT/ 6πη0D0 (1)
where k is the Boltzmann constant, η0 is viscosity of the solvent, and T is the temperature.
The NTA method is relatively new; in this work, it was used to determine the size and concentration of isolated NVs. Measurements were carried out on a Nanosight NS300 analyzer (Malvern, USA). The spectra were processed using Nanosight NTA 3.2 software [1 9]. Four or five measurements were conducted for distinct samples derived from the same solution. Each measurement lasted 60 s, which corresponded to 1498 frames. The measurements were performed at 298 K. The NTA method is based on recording the displacements of nanoparticles due to Brownian motion in real time. Fixing the coordinates of particles in time occurs by observing displacement of the light-diffraction spot, when a laser beam hits the particles. From the equation for the average displacement of a Brownian particle (2) over a selected time interval, the diffusion coefficient can be calculated:
< r2xyz > = 6Dt (2)
where r2xyz is the mean square displacement of the Brownian particle, D is the diffusion coefficient, and t is the time of observation of the particle.
The hydrodynamic radius Rh of particles, as in the DLS method, was calculated using relation (1).
The intrinsic viscosity [η] of a polymer in a solution is its important hydrodynamic parameter, depending on the properties of both the polymer and the solvent:
where η is the viscosity of the solution, η0 is the viscosity of the solvent, c is the solute concentration, and ηsp/c is the reduced viscosity.
The value of [η] was determined by extrapolation to c → 0 using the Huggins method:
ηsp/c = [η] +k’[η]²c+…. (4)
here K’ is the Huggins constant [20].
A Lovis 2000 M/ME automated microviscometer on the basis of the Heppler method was used for [η] measurements. The device allows one to determine the time of rolling of a ball at different angles of inclination of a capillary filled with a solution or a solvent. The measurements were carried out at two angles of inclination of the viscometer capillary, 500 and 550, the ball-rolling time was recorded 5–6 times, and the measurement result was averaged for each solution concentration. The value of ηsp/c was calculated as (t – t0)/t0c, where t and t0 are time of movement of the ball in the solution and solvent. The concentration dependences of ηsp/c for the dextran samples are shown in Figure 4b.
Densitometer DMA 5000M (Anton Paar, Austria) was used to determine the density of polymer solutions.
Phase diagrams were obtained in water at 298 K based on known critical ratios of PEG and dextran of close Mw at room temperature [8,11] . This significantly shortened the stage of rough selection of the concentration range for studying the phase behavior of dextran–PEG systems. Next, a PEG solution of known concentration was added to 1 cm3 of a combined solution of dextran and PEG in a cuvette of an SF-56 spectrophotometer at a component ratio close to critical, slowly introducing it with a dispenser of 0.2 cm3 after 5 min and measuring the optical-absorption value of the solution at a wavelength of 300 nm. During phase separation, a sharp decrease in the optical absorption of the solution by 15–20% was observed relative to the previous measurement. The position of the point on the TPPS binodal was determined by calculating the exact ratio of the concentrations of PEG and dextran, taking into account the additional introduced PEG solution. The phase diagrams below were obtained by smoothing the experimental curve drawn over eight points.
Cryogenic transmission electron microscopy (cryo-TEM) was used to visualize NVs isolated from plasma. A carbo-film-coated copper mesh (TEMLC200CU25, Sigma-Aldrich, USA) was treated (15 s, O2/H2) using a Jeol EM-39010 hydrophilic cleaner. An NV suspension (4 μL) was applied to a grid in a climate chamber (relative humidity of 90%, temperature of 20C). Excess suspension was removed using filter paper, and the resulting film was frozen in liquid ethane using a Leica EM GP automatic sample freezer. Images of the samples were obtained at –170°C on a Gatan 914 cryo-holder for cryo-TEM imaging on a JEM-2100 transmission electron microscope (Jeol, Japan). Micrographs were taken using a Gatan Ultrascan 4000 camera at either Å~30000 or Å~15000 magnification.
Results and Discussion
Mammalian blood plasma is a complex biological fluid. Besides of the extracellular vesicles plasma additionally contains proteins, nucleic acids, lipids, vitamins and more. Due to this complexity, plasma cannot be called a convenient object for studying its interaction with TPPS. But on the other hand, plasma is a valuable resource for studying how the polymers of TPPS interact with different structure biological micro-particles and nano-particles with distinct physical and biochemical properties. Our work focuses on a physical approach that utilizes a dimensional criterion to understand the interaction between particles in a multicomponent medium. By employing this approach, we have significantly simplified the examination of the processes occurring upon the separation of TPPS polymers directly in blood plasma. The dimensional criterion requires a reliable knowledge on the hydrodynamic properties of the objects under investigation; for this reason, the hydrodynamic studies were quite detailed.
The results of the work are presented below in two parts. The part 3.1 is devoted to the properties of the TPPS “dextran–PEG” itself, its components and mechanism of TPPS interaction with plasma. Part 3.2 connects with a practical application of extracellular NVs selected using TPPS “dextran–PEG” for monitoring of cancer markers of Hodgkin lymphoma [21] .
Characterization of TPPS
Molecular weight and hydrodynamic properties of TPPS polymers: The position of the binodal on phase diagram of two-phase polymer systems strongly depends on molecular weight of each of its components. Information about this specific feature is also available for the discussed TPPS [11 –14]. Therefore, the selected samples of PEG and dextran were characterized by the method of static light scattering in order to determine their weight-average molecular weight Mw. DLS and viscometry methods were used to determine the hydrodynamic characteristics of the polymers. These measurements were carried out in PBS, which was considered an aqueous medium similar to plasma, since vesicles and proteins retain their native state in PBS. Table 1 presents the obtained characteristics of polymers in PBS, which were further considered to correspond to the same characteristics in plasma.
Data presented in Table 1 demonstrate the difference in the molecular properties of PEG and dextran in the same solvent. PEG is a linear synthetic polymer, and dextran is a polysaccharide with a slightly branched structure (Figure 1, part 2.1.1). The difference in the chemical structure and structure of polymers is manifested in the conformational and hydrodynamic properties of their molecules. The conformation of PEG is an asymmetric statistical coil, while for branched dextran chains, the spatial shape of the molecules is obviously different. For example, Table 1 shows that the hydrodynamic radii Rh of PEG and dextran molecules at close molecular weight values are comparable (see, please, PEG-5 with Mw =17 × 103 g/mol and dextran-1 with Mw = 19.4 ×10³ g/mol), but not their intrinsic viscosity [η], which also depends on the shape of the molecules. The value of [η] for PEG-5 is comparable to that for dextran-3 with a significantly higher molecular weight Mw = 470 ×103 g/mol. The totality of hydrodynamic data shows that PEG molecules should have a significantly larger excluded volume than dextran molecules in PBS. In particular, as can be seen from Table 1, the density increment Δρ/Δc for dextran is higher than for PEG.
Polymers have certain molecular weight dependences (Mark–Kuhn–Houwink (M-K-H) relations) of their properties; therefore, it is convenient to refer to these dependencies when comparing polymers of different types. The PEG samples in Table 1 represent a homologous series, since the obtained its power exponents of the molecular weight dependences for [η] and D are in good agreement with the published data (Figure 5). For dextran, as a representative of the class of branched poly Polymers have certain molecular weight dependences (Mark–Kuhn–Houwink (M-K-H) relations) of their properties; therefore, it is convenient to refer to these dependencies when comparing polymers of different types. The PEG samples in Table 1 represent a homologous series, since the obtained its power exponents of the molecular weight dependences for [η] and D are in good agreement with the published data (Figure 5). For dextran, as a representative of the class of branched polysaccharides of bacterial synthesis, such a comparison can only be said conditionally, since its molecular properties, due to its branching increasing with Mw, differ from polymers with a linear chain structure. This was demonstrated in the classic work of W. Burchard’s group on dextran fractions in the molecular weight range from tens of thousands to tens of millions [22]. However, in the limited range of Mw (20–500)×103 g/mol with a weak degree of branching of ~5% (as in the studied samples), a linear approximation of the molecular mass dependences is acceptable for dextran [22,23] ; therefore, in order to compare the properties of dextran samples with the previously published data, such an approximation was made. Figures 5a and 5b demonstrate the closeness of [η] and D of the samples studied in this work to the data previously published for PEG and dextran in the PBS [24]. At the same time, it is seen from Figure 5 that the slopes of the dependences for PEG and dextran are different, i.e., in PBS at 298 K, the polymers have significantly different exponents in M-K-H relations. As an example, let us present the M-K-H relations for viscosity from [24], where more homogeneous homologous series of PEG and dextran were studied: [η] = (1.4 ±0.2) × 10–3 M0.45 ±0.05 for dextran, [η] = (4.3 ± 0.4) × 10–4 M0.67 ± 0.07 for PEG.
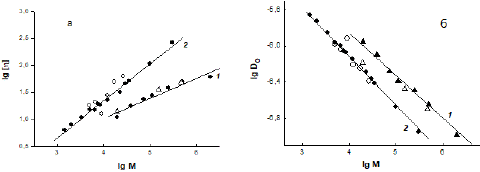
Figure 5: Molecular weight dependences of the intrinsic viscosity [ɳ] (a) and diffusion coefficient D0 (b) for dextran (1) and PEG (2) in phosphate-buffered saline at 298 K; light dots are this work, dark dots are [24].
As is known, under thermodynamically ideal conditions for a polymer in solution, when intramolecular interactions and the “polymer–solvent” interaction compensate each other (so called, T-conditions when the second virial coefficient A2 = 0), its conformation is not perturbed by volume effects, then the exponent aη in the M-K-H equation for viscosity should be equal to 0.5 [25]. The classical Flory–Huggin’s theory [25] also predicts that A2 > 0 for solutions of macromolecules in thermodynamically good solvents and A2 < 0 in poor solvents. In this case, the exponent in the M-K-H equation is aη< 0.5 for the polymer under thermodynamically poor conditions, and aη > 0.5 under good conditions [25].
For dextran in aqueous solvents, the second virial coefficient A2 has positive values; information about this can be found both in scientific periodicals [22–24] and in reference publications. The A2 values obtained in the work for dextran samples in PBS (Table 1) confirm this and are quite consistent with the data [24]. At the same time, there are a significant number of experimental studies, in which the exponent in the M-K-H ratio for the intrinsic viscosity of dextran in aqueous salt solvents is less than 0.5 [24–26], although such solvents are not thermodynamically poor for it. That is, dextran, even being a weakly branched polymer, differs in its molecular properties from polymers with a linear structure, which include PEG. For the latter, A2 > 0 and aη > 0.5, i.e., PBS is definitely a thermodynamically good solvent for PEG. Thus, the reason for the incompatibility of PEG and dextran is both the chemical structure and different architecture of their macromolecules which are the reason for their different interactions with the solvent.
The second virial coefficient A2 for the polymers under consideration in PBS is different: the A2 value for PEG is approximately an order of magnitude higher than for dextran at similar Mw (see, please, Table 1). This fact indicates the difference in thermodynamic conditions for PEG and dextran in PBS. Indeed, according to classical thermodynamic theories, the closer the value of A2 is to zero, the more preferable intramolecular interactions are for the polymer rather than interaction with the solvent.
Figure 6a shows a graphical construction for estimating the equilibrium thermodynamic stiffness (or the length of the statistical Kuhn segment A) of PEG chains. This construction, based on the hydrodynamic theory of Gray–Bloomfield–Hearst [25,30], allows one to determine the value A of chain macromolecules from the slope of the linear dependence (M2 [η])1/3 = f(M(1 – ε)/2) to the abscissa axis and the diameter of the chain d from the size of the segment cut off by it on the ordinate axis and proportional to (A/d):

Figure 6: Dependence of (M2/[ɳ])1/3 on M(1-ε)/2 for PEG samples (a) and dependence of [ɳ]M on M on a logarithmic scale for PEG and dextran (b); dark dots correspond this work, light dots are [24].
Here φ0 and P0 are the Flory parameters, ML = Mo/l is the molecular weight per unit length of the molecule, l is the projection of the monomer unit onto the direction of chain growth, Mo is the mass of the monomer unit, φ(ε) = 1.43 + 2.635ε + 4.709ε2 + …, ε is the hydrodynamic parameter of the “polymer–solvent” interaction, defined as ε = (2aη – 1)/3 , where aη is the exponent in the M-K-H equation for intrinsic viscosity [25].
For PEG in PBS from the dependence shown in Figure 6a, the value for the length of the Kuhn segment A = (2.0 ±0.5) × 10–7 cm and d = (0.2 ±0.1) ×10-7 cm is obtained; in this case, the following numerical values of the parameters included in relation (5) were used: ε = 0.113 , φ0 = 2.86 × 10²³ mol–1, P0 = 5.11, ML = 154 × 107 g/(mol cm). Quantitative assessment of the equilibrium stiffness of the PEG chain confirms that it is a typically flexible chain polymer [29].
Among polysaccharides, dextran, for which the dominant type of bond of cyclic monomers is a-1,6 (Figure 1), also belongs to flexible polymers, in contrast, for example, to cellulose with its characteristic β-1,4 glycosidic bond. A significant number of publications at the end of the 20th century were devoted to proving the flexibility of dextran chains [26–28]. For example, based on the data from the method of birefringence in a flow and assuming that the contribution to the optical anisotropy of a solution is made mainly only by linear sections of dextran chains independently oriented in the flow, in [28], they obtained an estimate of the thermodynamic stiffness for such sections A = (1.5 ±0.5) × 10–7 cm. The low equilibrium stiffness of dextran and PEG, despite the difference in the chemical structure, determines the strong dependence of the conformation and size of their molecules on thermodynamic conditions.
Upon discussing the hydrodynamic properties of polymers in the solutions, it is customary to estimate the value of the hydrodynamic invariant A0 (6). The hydrodynamic invariant reflects the interdependence of all parameters of macromolecules in solution through their molecular weight and the constancy of their average sizes in the phenomena of translational and rotational friction. Usually, assessment of the numerical value of A0 confirms the complementary nature of the hydrodynamic characteristics of macromolecules experimentally obtained by different methods [29]:
where M is the weight-average molecular weight of the polymer, [η] is the intrinsic viscosity, is viscosity of the solvent, D0 is the translational-diffusion coefficient at concentration c → 0, and T is absolute temperature.
For the range of PEG samples, the average value of the hydrodynamic invariant turned out to be equal to (3.2 ±0.3) × 10–10 g cm2 s–2 deg–1 mol–1/3, which fully corresponds to the value of A0 for flexible-chain polymers in thermodynamically good solvents [29, 30]. It is not the same for dextran. For the studied dextran samples, the A0 values differed widely (Table 1), which may be due to the discrepancy in the type of branching and degree of polydispersity of dextrans from different manufacturers. The latter is noted by many researchers of polysaccharides of bacterial origin, preferring the use of dextrans from a single manufacturer [21,22]. In this regard, we state that the architecture and type of branching of dextran obviously differ from synthetic branched polymers, both regular and irregular, for which a tendency toward a decrease in the A0 value is observed in comparison with polymers with a chain structure [3 0–32].
A universal parameter for comparing macromolecules of different topologies is their hydrodynamic density. For this, the experimental dependence [ɳ]M = f(M) is used, since the value [ɳ] M is proportional to the volume V occupied by the macromolecule in solution (7) [33] . The slope of the dependence log([ɳ] M) on logM will be inversely proportional to the average hydrodynamic density of polymer molecules (~log(1/ρ)):
[ɳ]M = φ03/2 ~V, (7)
where <h2>1/2 is the root-mean-square distance between the ends of the macromolecule value averaged over the entire ensemble.
The smaller the slope corresponds to the higher the density of the polymer coil for the compared polymers [33 ,34]. Figure 6b shows that for dextran, the linear approximation of the experimental data has a lower slope than for PEG, i.e., dextran, compared to PEG, has a denser
intramolecular packing under the same external conditions. This conclusion is fully consistent with those values given in Table 1 of the density increment Δρ/Δc for dextran and PEG in PBS.
The obtained Rh estimates of PEG and dextran molecules in PBS (Table 1) were used to study the interaction of these polymers with plasma components.
We note that the study of the hydrodynamic properties, including molecular-weight dependences, makes it possible to identify features that are important for understanding the behavior of an incompatible pair of polymers in the same solvent. For PEG and dextran, in addition to the difference in the topology of their molecules and polymer–solvent interaction, such a feature is the difference in the hydrodynamic density of macromolecules, due to their structure and the volume they occupy in the solution.
TPPS behavior in blood plasma and its optimization for isolation of nanovesicles: As follows from Table 1, PEG and dextran samples were selected in a fairly wide range of molecular weight variations. Examples of phase diagrams for specific PEG–dextran pairs are shown in Figure 7. The position of the TPPS binodal greatly depended on temperature and the molecular weight of each of the polymers in the system, while the ionic strength did not have a

Figure 7: Phase diagrams for three TPPSs of different composition in water at 298 K: dextran-1 : PEG-1 (1), dextran-1 : PEG-5 (2) and dextran-3 : PEG-5 (3).
noticeable effect on the phase diagram. A clear separation into two phases in a combined solution of PEG and dextran was obtained, when the concentration composition of TPS corresponded directly to the binodal or lay above it.
The methodology for selecting the most optimal conditions for isolating vesicles with an average hydrodynamic radius of Rh ~ 50 × 10–7 cm from plasma for each pair of polymer samples presented in Table 1 was as follows: two dextran–PEG compositions were selected slightly higher than the binodal, one directly at the binodal and two below the bimodal curve, based on the phase diagrams obtained in water (Figure 7). Before adding the mixture of dry polymers into the plasma, it was purified from cellular detritus, large vesicles, and protein conglomerates by step-by-step centrifugation (300g/10' – 1000g/10' – 2500 g/10'), which is traditionally carried out before isolating NVs by any other method [5–7,11] . Dextran and PEG were then dissolved in plasma for one hour at 277 K with occasional stirring. The efficiency of NVs isolation was assessed by analyzing the particle-size distribution in the lower phase after single application of TPPS, since the presence of vesicles was established namely in the lower phase. For each of the systems presented in Table 2, the particle distribution was analyzed an hour after the addition of polymers to the plasma at several concentrations near the phase curve. The particle size distributions in the lower phase were studied by the ANT method. The criterion was a comparison with the unimodal distribution of NVs, which are isolated from blood plasma by double ultracentrifugation at 11 0000 g, since this method is the “standard” for isolating ENVs from blood plasma [11] .
Samples
PEG-1
PEG-2
PEG-3
PEG-5
PEG-6
Dextran-1
1 (7,5:10)*,
2 (8:6),
3 (13:7,5),
4 (19:1),
5 (11,6:5)6 (15:3,4),
7 (10:4),
8 (8,5:5,6),
9 (3,5:7,6),
10 (3,5:10)11(15:2,5),
12(10:2,5),
13 (7,5:5),
14 (5:6),
15 (7:916 (12,5:1),
17(12,5:2,2),
18 (6:5,5),
19 (2,5:7),
20 (2,7:10)21(12,5:1,3), 22(8,5:1,5), 23(5,9:3,8), 24 (2,8:5),
25 (1,1:9)Dextran -2
26 (12,5:1),
27 (15:2,5),
28 (7,5:4,5),
29 (3:5),
30 (3:8)31 (9:2),
32 (12,5:2,5), 33 (6:4),
34 (2,5:5,5),
35 (2,5:7)36(10:1,6), 37(12,5:2),
38 (5:4),
39 (2:5),
40 (1:841 (2:5),
42 (2:2,5),
43 (5:2,5),
44 (10:1),
45 (14:1,8)46 (12:0,9),
47 (7:0,8),
48 (4:2),
49(0,8:2,8), 50 (0,8:5)Dextran -3
51 (14:2),
52 (10:3),
53 (7,5:4,6),
54 (2,5:4,9),
55 (1,2:8)56 (2:6),
57 (4:4),
58 (2:4),
59 (4:2,5),
60 (14:2)61(10:1,4), 62(27,5:2,5), 63(3,8:4,7), 64 (1:5),
65 (1:9)66 (3,5:1),
67(3,5:3,5), 68 (1,5:5),
69 (7,5:2),
70 (1:3,5)71 (3:1,5),
72 (4,4:2),
73 (2:3),
74(0,8:3,5), 75 (0,8:4,7)*The number before the brackets is the serial number of TPPS. For example, entry 1 (7, 5: 10) means: TPPS with serial number one consists of 7.5 wt% of dextran-1 and 10 wt % of PEG-1.
Table 2: Compositions of the tested TPPS.
It was found that TPPSs, which make it possible to obtain a fraction of particles with dimensional characteristics closest to the “standard” (Figure 8), correspond to the PEG: dextran quantitative ratios that belong to the region near the binodal, but lying below it. Under such conditions, a clear separation into two phases in the plasma does not occur: both polymers, dissolving in the plasma during stirring and interacting with its components, move to the upper part of the solution (upper phase), and heavy vesicles are concentrated in the lower phase of the “plasma–TPPS” system for high-molecular-weight samples. The higher the molecular weight of the TPPS polymers, the lower their concentrations at which the release of NVs occurred.
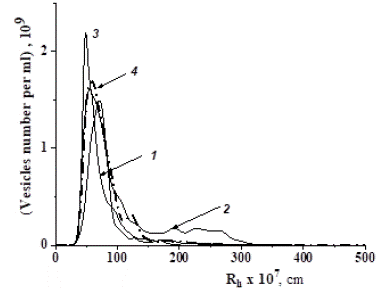
Figure 8: Particle size distributions in the lower phase of the “plasma–TPPS” system for compositions with numbers 66 (1), 59 (2), 60 (3) (Table 2) obtained by the NTA method, and for vesicles isolated from plasma by ultracentrifugation at 11 0000 g (4).
Only one among the tested compositions, the TPPS-66 (Table 2), composed of dextran with Mw =470 × 103 g/mol and PEG with Mw = 19.4 × 10³ g/mol with a mass percentage ratio of dextran: PEG = 3.5 :1, was selected as the optimal one. The main reason for distinguishing TPPS-66 from the others was that it made it possible to obtain unimodal distributions of vesicles corresponding to “standard” and high concentrations of NVs of the required sizes, also close to the “standard” and even higher. In addition, in comparison, for example, with TPPS-60 (Figure 9), it required a minimum amount of polymers to achieve the goal. TPPS-66 was used to analyze the interaction of TPPS polymers with plasma components.
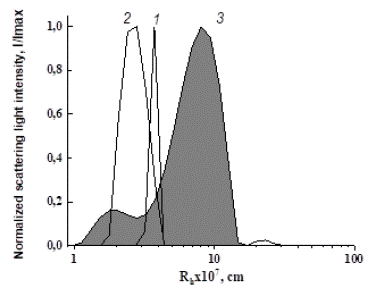
Figure 9: Comparative dependences of the scattered light intensity on particle size in solution of PEG-5 (1), BSA (2) and in model system PEG-5-BSA (3) at PEG concentration 1.38 wt % (c) and BSA concentration 5.2 wt %.
In the process of TPPS optimization, the dependence of the size of the released vesicles on the ratio of the hydrodynamic volumes of TPS polymer molecules was revealed. The value of the hydrodynamic volume was estimated as Vh = (4/3)pRh3 . For the optimal TPPS-66 system and systems similar in quality for isolating NVs with an average hydrodynamic radius of Rh ~50 × 10–7 cm, the ratio (Vhdex/VhPEG) = 24 ±4. A characteristic feature of TPPS at this ratio of the hydrodynamic volumes of dextran molecules and PEG was that the resulting particle distributions in the lower phase of the “TPPS–plasma” system corresponded to unimodal particle fractions similar to those shown in Figure 8.
Interaction of TPPS polymers with plasma components: Mechanism of selective action of TPPS onto NVs was studied using model systems by the DLS method in solutions in PBS. Albumin was taken as a universal model of plasma proteins, since the fraction of albumins in the total amount of proteins in plasma is 60%, i.e. albumin is a typical blood-plasma protein. Bovine Serum Albumin (BSA) was used. The experimental design was as follows: preliminarily prepared solutions of PEG and BSA in PBS were mixed, and the distribution of particles as a result of their interaction was recorded. This study shows an appearance of particles (curve 3, Figure 9) larger than the molecular size of BSA (curve 2) and PEG (curve 1), which clearly indicates a complex formation between the components (Figure 9). Ssuch complex formation between PEG and BSA was reported earlier, for instance in [3 5]. In this experiment the concentration of bovine serum albumin of 5.2 wt % was constant, and concentration of PEG was varied in wide range.
Dextran, unlike PEG, did not show a tendency to form complexes with BSA. So, it was concluded the absence of interaction between dextran and BSA in the same media.
Studying the interaction of dextran with NVs (Figure 10a), as well as PEG with NVs (Figure 10b) using a similar model scheme, showed the absence of complex formation between NVs and polymers, as evidenced by the preservation of particle sizes in the combined solution.
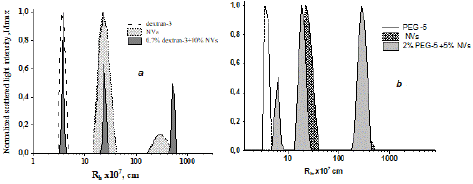
Figure 10: Comparative dependencies of the scattering light intensity on particle size in solutions of the initial polymers, pure NVs and their mixtures in PBS at 298 K: mixture of dextran-3 and NVs (a) and mixture of PEG-5 and NVs (b). The scattering angle is 900.
Thus, using model systems, the inertness of the polymers of the used TPPS to NVs and their surface proteins was established, and the absence of interaction between dextran and plasma proteins, as well as the presence of complexation between plasma proteins and PEG, was shown. This result allowed one to come to a general conclusion about the possibility of using dextran–PEG TPPS for the effective isolation of extracellular vesicles with an average hydrodynamic radius of Rh=50 × 10–7 cm.
The presence of vesicles in the lower phase of the “plasma–TPPS” system after separation was confirmed by the cryo-TEM method (Figure 11 ). The received images were typical for NVs isolated from biological liquids by other methods [2,3] .
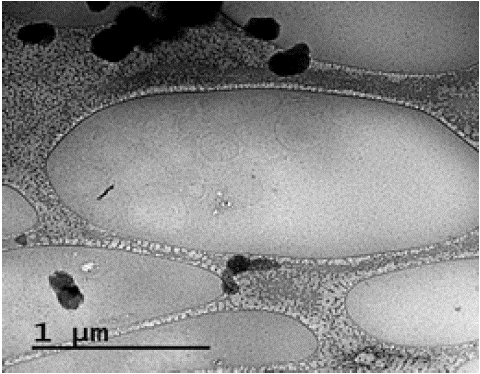
Figure 11: Cryo-TEM image of vesicles isolated using TPPS dextran-PEG.
Conclusion of part 3.1.: The inexpensive and reliable method for isolating extracellular nano-sized vesicles from blood plasma using the dextran–PEG TPPS system has been proposed. In this approach, a high concentration of NVs with hydrodynamic radius near 50 mn is released due to separation of plasma components at the combination of three main conditions: 1) nonequilibrium media of proximity to the TPPS binodal, 2) the inertness of the vesicles to both polymers, and 3) as well as the effective binding of plasma-protein components to only PEG component of the polymer system. It should be especially noted that the required dimensions of vesicles were isolated only at a certain ratio of the hydrodynamic volumes of the TPPS polymers (Vh dex/Vh PEG) = 24 ±4).
Practical Application of Extracellular Nanovesicles Circulating in Blood Plasma for Analysis of The Hodgkin Lymphoma Activity
Several biochemical aspects: As it was mentioned at the Introduction, the extracellular vesicles produced by cancer cells are capable of carrying specific biomarkers, which can be detected using any method. Current advancements in this field primarily rely on the use of nanoscale biosensors sensitive to specific protein markers.
In the present study, a special biosensor specific to Hodgkin lymphoma (cHL) molecular markers has been developed. Biosensor was created based on the gold nanoparticles (AuNPs) modified by DNA-aptamers to exhibit a fermentative peroxidase activity. These modified AuNPs were then utilized for the detection of molecular markers produced by the cells of cHL and carried by extracellular NVs presented in human plasma. Here we relied on well-known experience in creating such biosensors due to the gold nanoparticles have attracted much attention in the past several years because of their low cost, simplicity, practicality, and applicability for various targets [3 6].
The aptamers are single-stranded short DNA molecules capable of tightly binding to specific molecular targets [3 7]. A combinatorial technique, termed the systematic evolution of ligands by exponential enrichment (SELEX), has been developed to identify aptamers with an affinity to specific molecular targets [3 7]. Currently, this technique is widely applied in practice. DNA-aptamers for cHL tumor cells were found using so called, cell-based SELEX protocol [3 8]. Aptamers capable of capturing and detecting NVs have been considered to be a promising type of biosensors, or aptasensor [3 9]. Regardless of the target specificity, aptasensors can be classified according to sensing technologies as follows: fluorescence, electrochemistry, luminescence, colorimetry, surface-enhanced Raman scattering, surface plasmon resonance, and others. The limit of NVs detection for some aptasensors reaches 102 to 103 vesicles/mL suggesting a high sensitivity and great diagnostic potential of aptamer-based techniques [3 9]. In this study the colorimetric type aptasensor was applied. Colorimetric aptasensors employ the ability of DNA- aptamers to reversibly modulate either the colloidal stability or enzyme-mimetic activity of metal nanoparticles. For instance, a colorless suspension of gold nanoparticles (AuNPs) stabilized by aptamers was turned dark after adding NVs due to AuNPs aggregation [40]. In our case the second type of activity of AuNPs modified by DNA- aptamers was preferable.
Due to Hodgkin lymphoma cells secrete proteins-markers CD30 and CD63, a relative amount of circulating NVs, bearing these markers, might reflect a classical form of Hodgkin lymphoma activity and can be measured by using a nanozyme-based technique. Sensing was mediated by competing properties of DNA aptamers to attach onto surface of AuNPs inhibiting their enzymatic activity and to bind specific markers on NVs surface. An enzymatic activity of AuNPs was evaluated through the color reaction. Methods of Nanoparticle Tracking Analysis (NTA) and Dynamic Light Scattering (DLS) were also used to characterize AuNPs and to estimate the results of interaction of AuNPs with the NVs in solutions. At this part of the study our tasks were to find the condition of gold nanoparticles stability, to confirm its complexation with DNA-aptamers, and to check in the biosensor interaction with blood plasma NVs.
Synthesis and characterization of AuNPs and modified AuNPs: The synthesis of AuNPs was carried out from the H[AuCl4]·3H2O according to the method previously described in [41] . The obtained AuNPs were characterized using a Zetasizer Nano ZS (Malvern Panalytical, Malvern, USA). It was determined that an initial gold concentration used for synthesis (260 ± 4) mg/mL is optimal for receiving the suspension of AuNPs concentration of 2×10¹⁵ particles/mL, according to Nanoparticle Tracking Analysis data (NTA).
In order to enhance the suspension stability of AuNPs in aqueous media a citrate HOC(COOH)3 was used. This is because AuNPs possess a positively charged surface [41] . At this condition only a unimodal distribution of AuNPs it was possible to observe as shown in Figure 12. The mean value of hydrodynamic radius of AuNPs estimated experimentally by DLS method was (7 ± 2) nm. In the context of experimental errors, the NTA method yielded consistent estimations. Thus obtained AuNPs with the described parameters were considered to be suitable for the following modification.
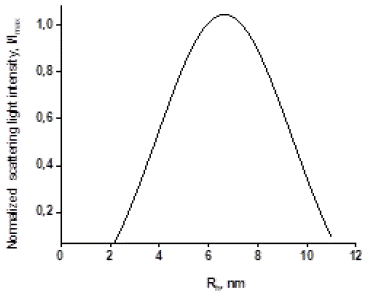
Figure 12: Hydrodynamic radius Rh distribution of AuNPs in aqueous media obtained by DLS method.
The metal nanoparticles have exhibited enzyme-like properties. Previous studies, for example [27], have reported data on the enzyme-mimetic activity of AuNPs. It is this property of AuNPs that was used to create a biosensor.
Interaction of AuNPs and DNA-aptamers: To modulate the enzymatic activity of AuNPs the single-stranded DNA oligomers (aptamers) were used: CAC CCC ACC TCG CTC CCG TGA CAC TAA TGC TA (CD63) [43] :
length 32 bp, GC 59.4%, ACT GGG CGA AAC AAG TCT ATT GAC TAT GAG (CD30) [44]:
length 30 bp, GC 43.3%, purchased from Evrogen Ltd. (Moscow, Russia). As expected, the secondary structures of these molecules mediated their highly affine binding with specific protein-markers CD63 [43] , CD30 [44] of cHL cells [3 8].
According to the principle of the proposed analytic system, the peroxidase activity of AuNPs should first be suppressed by DNA attachment. The quantity of DNA-aptamers used to suppress the enzymatic activity of AuNPs should be sufficient for complete suppression but not excessive; therefore, free aptamers remain in the reaction mixture.
To form AuNP–DNA complexes, a constant amount of AuNPs suspension (10 μL of suspension at a concentration of 2 × 10¹⁵ particles/mL) was mixed with 2.5 μL of aptamer solution at the desired concentration, and incubated for 30 min at 40 C. Subsequently, the hydrodynamic radius of particles was assayed by DLS. The scattered light intensity of the AuNP solution and peroxidase activity of AuNPs was measured in the range of DNA-aptamer concentrations 5-20 mmol. In this way the optimal conditions for the AuNP–aptamer formations were determined based on the absence of large in size aggregates.
The AuNPs concentration 1.6×10¹⁵ particles/mL and DNA-aptamer concentration of 15 mmol in common solution was assumed as optimal and was used in further experiments. Those concentrations of both type aptamers and AuNPs were sufficient for complex formation (according to spectral control) but did not cause the appearance of a significant proportion of aggregates according to DLS data.
The peroxidase activity of AuNPs was evaluated after adding 3,3’,5,5’-tetramethylbenzidine (10 μL) to the resulting solution and incubating for 18 min at 370 C in the dark. We utilized a ready-to-use 3,3’,5,5’- Tetramethylbenzidine (TMB) substrate solution (Xema Co. Ltd., Moscow, Russia). After incubation, the suspensions were centrifuged (6000 g, 3 min), the supernatants were carefully transferred to the wells of a 384-well plate, and the absorption spectra were measured immediately.
Biosensor interaction with nanovesicles: The interactions between AuNP–DNA complexes and NVs were studied by mixing the AuNP–DNA complexes (12.5 μL) and NVs (1 μL) suspensions at the desired concentrations. The mixtures were incubated for 30 min at 40 C to release AuNPs and to recover their peroxidase activity. The hydrodynamic radii of particles in the resulting suspension and peroxidase activity of AuNPs were assayed, as described above. The following step was connected with observation of the change in peroxidase activity of modified AuNPs in a series of NVs solutions at different concentrations. The complexes of AuNP aptamers always were formed at an optimal concentration ratio (AuNPs, 1.6×10¹⁵ particles/mL and CD63-aptamer, 15 mM). The NVs were added in the concentration interval from 8×10⁶ to 16×107 vesicles/mL.
The suspension of AuNPs (1.6×10¹⁵ particles/mL) without aptamers was used to define the maximum peroxidase activity of the analytic system. The mixtures were incubated (30 min at 40 C); afterwards, a solution of TMB (10 μL) was added, mixed, incubated (~20 min at 370 C in the dark), and centrifuged (3 min 6000g). Figure 14 shows the results of the experiment. The reaction of biosensor to TMB peroxidation was an appearance of a characteristic blue color in suspension which intensity depended on the concentration of vesicles (Figure13 ). The colorimetry results of the experimental samples revealed a growth of peaks from AuNPs at 370 nm (Figure 13 , left) and 370 nm. A strong linear dependence of optical density from NVs quantity was observed in a range of concentration from 5 ×10⁶ to 40 ×106 particles/mL, useful for practical application.

Figure 13: Change of enzymatic activity of AuNPs, modified by CD63 DNA-aptamers, in solutions of NVs evaluated by TMB peroxidation: optical absorbance of the probes measured at 370 nm (left) and the photography of differently colored probes with the successive increases in concentration of NVs (right) in a range from 5× 10⁶ to 40×106 particles/mL
Thus, obtained results demonstrated a possibility to measure the concentration of NVs with the developed AuNP aptasensor. The linear dependency between NVs concentration and AuNP’s peroxidase activity was observed in quite a narrow diapason, whereas the observed limit of detection was rather average in terms of parameters reported for aptasensors in other studies [3 9]. So, the practical applicability of AuNP aptasensors should be experimentally explored for any specific clinical task. It was performed to detect plasma NVs bearing cHL-specific markers and determine whether the developed system could address clinically relevant questions.
Positron Emission Tomography (PET) Combined with Computed Tomography (PET/CT) is a standard method for the primary assessment of patients with Hodgkin’s lymphoma (cHL) and for further monitoring of chemotherapy. The PET/CT analysis was performed for 10 patients with cHL. According to the measured parameters (MTV, metabolic tumor value) and (SUV, standardized uptake value in all separated disease focuses), the complex parameter of the total lesion glycolysis was calculated for each patient. This parameter integrally reflects the amount and metabolic activity of disease-affected lymphoid tissue and serves as important criterium for cHL diagnosis. It was logical to assume that amount of NVs with protein markers of lymphoma in plasma is associated with disease severity; therefore, it was expected to correlate with the PET/CT results.
For 10 cHL patients it was measured a number of plasmas NVs bearing characteristic protein markers before and after chemotherapy, using the developed biosensor according to the procedure described above. Typical test is shown in Figure 14. It presents the probes absorbance after aptasensor application. The results of PET/CT study and biosensor’s application completely coincided in assessing the tumor activity. More details and biochemical aspects of the action of the developed biosensor in comparison with various other methods for diagnosing and monitoring Hodgkin lymphoma can be found in our publication [45].
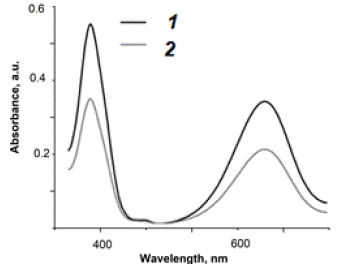
Figure 14: Evaluation of the results of chemotherapy for cHL patient before (1) and after (2) the treatment using AuNP aptasensor. Figure demonstrates change in absorbance according to decrease of NVs in blood plasma, bearing proteins specific to cHL
Summary
The implementation of a liquid biopsy, which relies on the analysis of nano-sized extracellular vesicles in blood plasma, has not yet been widely adopted in routine clinical practice due to the absence of reliable analytical technologies. The significance of conducting further research in this area is clear, and we hope that the performed study will contribute to progress in this direction. The proposed method for isolating of nano-sized extracellular vesicles from blood plasma based on utilization of Two-Phase Polymer System (TPPS) “dextran–PEG” is quite accessible for widespread use in routine practice. Application of TPPS made it possible to isolate up to 2 × 10¹¹ vesicles/mL (according to the NTA data) due to non-destructive effect on its lipid membrane. This concentration can be considered as high in comparison with the current standard methods for isolating plasma NVs [45]. It was also demonstrated that amount of NVs that can be isolated using TPPS from 1 cm3 of plasma is sufficient for further analysis of their surface proteins.
Author Statements
Acknowledgements
Authors are grateful for assistance to “Center for Development of Molecular and Cellular Technologies” where cryo-TEM micrographs were obtained, and to the “Center for Diagnostics of Functional Materials for Medicine, Pharmacology, and Nanoelectronics” of Saint Petersburg State University.
References
- Yáñez-Mó M, Siljander PRM, Andreu Z, Zavec AB, Borras FE, Buzas EI, et al. Biological properties of extracellular vesicles and their physiological functions. J Extracell Vesicles. 2015; 4: 27066.
- Abels ER, Breakefield XO. Introduction to Extracellular Vesicles: Biogenesis, RNA Cargo Selection, Content, Release, and Uptake. Cell Mol Neurobiol. 2016; 36: 301–31 2.
- Doyle LM, Wang MZ. Overview of Extracellular Vesicles, Their Origin, Composition, Purpose, and Methods for Exosome Isolation and Analysis. Cells. 2019; 8: 727.
- Bebelman MP, Smit MJ, Pegtel DM, Baglio SR. Biogenesis and function of extracellular vesicles in cancer. Pharmacol Ther. 2018; 188: 1–11 .
- Gao Y, Qin Y, Wan C, Sun Y, Meng J, Huang J, et al. Small Extracellular Vesicles: A Novel Avenue for Cancer Management. Front Oncol. 2021; 11 : 638357.
- Repetto O, Lovisa F, Elia C, Enderle D, Romanato F, Buffardi S, Sala A, et al. Proteomic Exploration of Plasma Exosomes and Other Small Extracellular Vesicles in Pediatric Hodgkin Lymphoma: A Potential Source of Biomarkers for Relapse Occurrence (2021) Diagnostics (Basel). 2021; 11 (6):917.
- Yang D, Zhang W, Zhang H, Zhang F, Chen L, Ma L, et al. Progress, opportunity, and perspective on exosome isolation - efforts for efficient exosome-based theranostics. Theranostics. 2020; 10: 3684–3707.
- Albertsson PA. Fractionation of particles and macromolecules in aqueous two-phase systems. Biochem Pharmacol. 1961; 5: 351–358.
- Platis D, Labrou NE. Application of a PEG/salt aqueous two-phase partition system for the recovery of monoclonal antibodies from unclarified transgenic tobacco extract. Biotechnol J. 2009; 4: 13 20–13 27.
- Andrews BA, Huang RB, Asenjo JA. Purification of virus like particles from yeast cells using aqueous two-phase systems. Bioseparation. 1995; 5: 105–11 2.
- Asenjo JA, Andrews BA. Aqueous two-phase systems for protein separation: Phase separation and applications. J Chromatogr. 2012; 1238: 1–10.
- Johansson HO, Persson J, Tjerneld F. Thermoseparating water/polymer system: a novel one-polymer aqueous two-phase system for protein purification. Biotechnol Bioeng. 1999; 66: 247–257.
- Andrews BA, Schmidt AS, Asenjo JA. Correlation for the partition behavior of proteins in aqueous two-phase systems: effect of surface hydrophobicity and charge. Biotechnol. Bioeng. 2005; 90: 380-390.
- Jadhav SB, Singhal RS. Conjugation of a-amylase with dextran for enhanced stability: process details, kinetics and structural analysis. Carbohydrate Polymers. 2012; 90: 1811 –1817.
- Schärtl W. Light scattering from polymer solutions and nanoparticle dispersions. Springer, Berlin-Heidelberg. Germany. 2007.
- Chu B. Laser Light Scattering: Basic Principles and Practice, 2nd Ed. Academic Press, New York, USA. 1991.
- Fedosov I, Nefedov I, Khlebtsov B, Tuchin VV. Measurements of the diffusion Coefficient of Nanoparticles by Selective Plane Illumination. Optics and Spectroscopy. 2009; 107: 846-852.
- DYNALS software.
- Nanosight NTA 3.2 Software. https://www.malvernpanalytical.com/en/assets/NanoSight-NTA32-SUN-Software
- Kulicke WM, Clasen C. Viscosimetry of Polymers and Polyelectrolytes. Springer Laboratory Series. Berlin, Heidelberg, Germany. 2004: 111-115.
- Rossi D, Spina V, Bruscaggin A, Gaidano G. Liquid biopsy in lymphoma. Haematologica. 2019; 104: 648–652.
- Ioan CA, Aberle T, Burchard W. Structure Properties of Dextran. 2. Dilute Solution. Macromolecules. 2000; 3: 5730-5739.
- Heinze T, Liebert T, Heublein B, Hornig S. Functional Polymers Based on Dextran. Adv Polym Sci. 2006; 205: 199–291.
- Armstrong JK, Wenby RB, Meiselman HJ, Fisher TC. The hydrodynamic radii of macromolecules and their effect on red blood cell aggregation. Biophys J. 2004; 87: 4259–4270.
- Seiffert S. Physical Chemistry of Polymers: A Conceptual Introduction. De Gruyter, Berlin, Boston. 2020.
- Gray HB, Bloomfield VA, Hearst JE. Sedimentation Coefficients of Linear and Cyclic Wormlike Coils with Excluded-Volume Effects. J Chem Phys. 1967; 46: 1493-1498.
- Huber AJ. Characterization of branched and linear polysaccharides by size-exclusion chromatography/low-angle laser light scattering. J Appl Polym Sci Appl Polym Symp. 1991; 48: 95-109.
- Pavlov GM, Korneeva EV, Yevlampieva NP. Hydrodynamic characteristics and equilibrium rigidity of pullulan molecules. Int J Biol Macromol. 1994; 16: 318-323.
- Pavlov GM, Grishchenko AE, Rjumtsev EI, Yevlampieva NP. Optical properties of dextran in solution and in films. Carbohydr Polymers. 1999; 38: 267-271.
- Tsvetkov VN. Rigid-Chain Polymers: Hydrodynamic and Optical Properties in Solution (Macromolecular Compounds). Consultants Bureau(Premium), New York, USA. 1989.
- Grube M, Cinar G, Schubert US, Nischang I. Incentives of Using the Hydrodynamic Invariant and Sedimentation Parameter for the Study of Naturally- and Synthetically-Based Macromolecules in Solution. Polymers. 2020; 12: 277.
- Shpyrkov AA, Tarasenko II, Pankova GA, et al. Molecular mass characteristics and hydrodynamic and conformational properties of hyperbranched poly-L-lysines. J Polym Sci A. 2009; 51: 250-258.
- Pavlov GM, Koreeva EV, Jumel K, Harding SE, Meijer EW, Peerlings HWI, et al. Hydrodynamic properties of carbohydrate-coated dendrimers. Carbohydr Polymers. 1999; 38: 195-202.
- Pavlov GM. Size and average density spectra of macromolecules obtained from hydrodynamic data. Eur Phys JE. 2007; 22: 171-180.
- Bekale L, Agudelo D, Tajmir-Riahi HA. The role of polymer size and hydrophobic end-group in PEG-protein interaction. Colloids Surf B. 2015; 130: 141-148.
- Zhao W, Brook MA, Li YF. Design of Gold Nanoparticle-Based Colorimetric Biosensing Assays. Chembiochem. 2008; 9: 2363–2371.
- Ellington AD, Szostak JW. In vitro selection of RNA molecules that bind specific ligands. Nature. 1990; 346: 818–822.
- Röthlisberger P, Hollenstein M. Aptamer chemistry. Adv. Drug Deliv Rev. 2018; 13 4: 3–21.
- Zhu C, Li L, Wang, Z, Irfan M, Qu F. Recent advances of aptasensors for exosomes detection. Biosens. Bioelectron. 2020; 160: 112213.
- Jiang Y, Shi M, Liu Y, Wan S, Cui C, Zhang L, et al. Aptamer/AuNP Biosensor for Colorimetric Profiling of Exosomal Proteins. Angew. Chem. Int. Ed. 2017; 56: 11 916–11 920.
- Barmin R, Rudakovskaya P, Gusliakova O, Sindeeva OA, Prikhozhdenko ES, Maksimova EA, et al. Air-Filled Bubbles Stabilized by Gold Nanoparticle/Photodynamic Dye Hybrid Structures for Theranostics. Nanomaterials. 2021; 11 : 415.
- Ghosh S, Jaiswal A. Peroxidase-Like Activity of Metal Nanoparticles for Biomedical Applications. In Nanobiomaterial Engineering. Springer, Singapore. 2020; 6: 109-126.
- Zhou Q, Rahimian A, Son K, Shin DS, Patel T, Revzin A. Development of an aptasensor for electrochemical detection of exosomes. Methods. 2016; 97: 88–93.
- Parekh P, Kamble S, Zhao N, Zeng Z, Portier BP, Zu Y. Immunotherapy of CD30-expressing lymphoma using a highly stable ssDNA aptamer. Biomaterials. 2013 ; 34: 8909–8917.
- Slyusarenko M, Shalaev S, Valitova A, Zabegina L, Nikiforova N, Nazarova I, et al. AuNP Aptasensor for Hodgkin Lymphoma Monitoring. Biosensors. 2022; 12: 23.