Research Article
Austin J Hydrol. 2014;1(1): 13.
Subsurface Transport of As, Se, Cu, and Pb Contaminants in Association with Soil and Biosolid Nano- and Macro- Colloid Fractions
Karathanasis AD*, Ghezzi JL, Wendroth O, Matocha CJ, Unrine J and Thompson YL
Department of Plant and Soil Sciences, University of Kentucky, USA
*Corresponding author: Karathanasis AD, Department of Plant and Soil Sciences, University of Kentucky, N-122K Ag. Science North, Lexington, KY, 40475, USA
Received: May 19, 2014; Accepted: May 29, 2014; Published: May 30, 2014
Abstract
This study investigated the potential of nanocolloid and macrocolloid fractions separated from selected soils and biosolids to co-transport two anionic (Se, As) and two cationic (Cu, Pb) contaminants through intact soil monoliths. The soil colloids represented smectitic, kaolinitic, and mixed mineralogical compositions while the biosolid colloids were derived from an aerobically digested municipal sewage sludge. Selected characterizations of the colloids included particle size (DLS, TEM, SEM), SA, settling stability, EC, pH, CEC, OC, zeta potential, Kf, and mineralogy. Leaching experiments involved the elution of nano- and macrocolloid suspensions mixed with 2 mg L-1 contaminants through soil monoliths during a four pore volume leaching cycle. In spite of similar contaminant sorption affinities and notable nanocluster formation during the transport, nanocolloids were eluted in greater quantities than macrocolloids and co-transported higher metal contaminant loads for both anionic and cationic contaminants. Significantly higher contaminant loads were mobilized in association with the colloids over the control contaminant solution, with soluble forms dominating the anionic and colloid-bound forms the cationic contaminants. The enhanced elution of both soluble and sorbed contaminant loads in the presence of nanocolloids is attributed to preferential flow, size exclusion and ion exclusion mechanisms. The findings of this study emphasize the importance of considering multiple physicochemical and mineralogical parameters in contaminant transport models in order to accurately assess environmental pollution risks and develop efficient remediation strategies.
Keywords : Nanoparticles; Particle size; Colloid composition; Colloid migration; Contaminant transport behavior
Abbreviations
BTCs = Break Through Curves; CEC = Cation Exchange Capacity; TEM = Transmission Electron Microscopy; EDS = Energy Dispersion Spectrum; SEM = Scanning Electron Microscopy; OC = Organic Carbon; XRD = X-ray Diffraction; TG = Thermogravimetric; D = Depth; H = Height; PVC = Polyvinyl Chloride; EC = Electrical Conductivity; DI = De-Ionized; M = Molar; ICP-MS = Inductively Coupled-Mass Spectroscopy; ANOVA = Analysis of Variance; LSD= Least Statistical Difference; SAS = Statistical Analysis System; PZC = Point of Zero Charge; DOC = Dissolved Organic Carbon; TOC = Total Organic Carbon; DLS = Dynamic Light Scattering; C/Co = Influent to Eluent Concentration Ratio; PV = Pore Volumes; Kf = Freundlich Sorption Coefficient.
Introduction
Recent studies have shown that environmental nanoparticles with their high surface area and reactivity may enhance the transport of contaminants in both surface waters and through soil media into the groundwater [1-3]. Nanoparticle mobilization may be influenced by hydraulic gradients and preferential flow paths within the soil, particle size and morphology, competitive sorption-desorption processes with soluble ions and organic functional groups, pore size distribution, as well as dispersion-flocculation phenomena [2,4-7]. The transport of nanoparticles in soil environments is controlled by Brownian motion rather than gravitational settling. Nanoparticle mobility may be limited by sequestration within micropores, coagulation into larger size aggregates that may lead to extensive straining even within macropores, and sorption or physical attachment to non-mobile particles. Nanoparticle sorption at the air-water interface may also affect their transport in the unsaturated zone [2].
While soil transport studies have shown that nanoparticles and colloids are capable of leaching through soil horizons, the likelihood of particle movement through both the soil root and vadose zone in most cases seems unlikely. However, under certain conditions when there is a large influx of water during storms or during snow melt events, a significant number of nanoparticles could migrate from the soil vadose zone to the groundwater [8]. Previous studies have suggested that nanoparticles are vehicles for the movement of heavy metals and other contaminants in surface and shallow subsurface environments [2,3,5,6]. This process involves complex biogeochemical interactions, including physicochemical sorption and precipitation reactions. Some groundwater nanocolloids have demonstrated enhanced transport of contaminants via high sorption affinities for aquifer solids [5]. Studies have shown that radionucleotides can be transported over several kilometers via nanoparticles in groundwater over short time periods, defying thermodynamic predictions [1,2,6]. Leaching experiments with contaminant-colloid suspensions of 220- 1050 nm in diameter through undisturbed soil monoliths produced eluted nanocolloids with a mean diameter range of 50-120 nm and a significant load of metal contaminants [3,4].
The spatial distribution of physical and chemical features along a flow path in an aquifer will also affect nanocolloid and associated contaminant transport [5]. Subsurface environments are not usually favorable for nanocolloidal deposition because of the electrostatic repulsion between the generally negatively charged nanocolloids and subsurface media. Furthermore, the surface charge (zeta potential) of nanocolloids or nanoparticles can become irrelevant to transport predictions due to spatial heterogeneity [5]. Aggregation, sorption or dissipation of surface charges will affect particle mobility and therefore the likelihood of contaminant transport [7]. However, nanocolloids because of their smaller size, high surface reactivity and contaminant sorption capacity, and prolonged stability in suspension are likely more potent contaminant transport vectors than macrocolloids in surface waters, unsaturated subsurface media, and in groundwater.
Although a considerable volume of research has been conducted on colloid-facilitated transport of pollutants, there is a limited knowledge on the role of natural nano- vs. macro-colloid particles in mediating transport of emerging contaminants such as Se, As, Cu and Pb in subsurface soil environments. The objectives of this study were to evaluate the potential of soil- and biosolid-derived nano- and macro-colloids to sorb and transport As, Cu, Pb, and Se contaminants through soil media. The study also addresses the effects of particle size and compositional differences among particles.
Material and Methods
Colloid generation and characterization
Three Kentucky soil Bt horizons were used to generate the mineral colloids: Caleast-variant (fine, smectitic, mesic mollic Hapludalf), Tilsit (fine-silty, mixed, mesic Typic Fragiudult), and Trimble (fineloamy, siliceous, mesic Typic Paleudult), referred to as smectitic, mixed, and kaolinitic nano- and macro-colloids, respectively. Biosolid nano- and macro-coloids were derived from aerobically digested municipal sewage sludge (Jessamine County, Kentucky). Centrifugation was used to fractionate colloids into two size classes (nanocolloids <100 nm and macrocolloids 100-2000 nm) using a Centra GP8R Model 120 centrifuge (Thermo IEC) in deionized water (resistivity of 1 μΩcm at 25°C) [3]. Sample suspensions were then diluted to 50 mg L-1 concentrations for additional analysis. Primary particle size of the nano- and macro-colloids was determined using TEM-EDS (JEOL 2010F, Tokyo, Japan) [9,10] and SEM-EDS ( Hitachi S-4300, Tokyo, Japan), respectively [11,12]. Dynamic light scattering was used to determine hydrodynamic diameters (dH) on a Malvern Zetasizer Nano ZS (Malvern, United Kingdom). Surface area was measured using the Ethylene Glycol Monoethyl Ether method. Settling kinetics experiments were used to determine the stability of the nano-and macro-colloid fractions over a 48 hour period in 50 mg L-1 suspensions containing 2 mg L-1 mixed contaminant concentrations. The suspended colloid concentrations were determined using a colorimetric procedure on a Molecular Devices Versa Max Microplate Reader at 450 nm [4]. Mineralogical characterizations were conducted using XRD and TG analyses on a Phillips PW 1840 diffractometer and PW 1729 x-ray generator (Mahwah, NJ), and a Thermal Analyst 2000 (TA Instruments) equipped with a 951 Thermo gravimetric Analyzer (DuPont Instruments), respectively [13,14].
Cation exchange capacity was determined using an adapted version of the ammonium acetate method. A Flash EA 1112 Series NC Soil Analyzer (Thermo Electron Corporation) with a Mettler Toledo MX5 microbalance was used to determine OC. A Denver Instruments Model 250 pH*ISE* electrical conductivity meter was used to measure pH and electrical conductivity (Arvada, CO). Macro- and nano-colloid affinity for the contaminants was evaluated from Freundlich sorption coefficients developed from mixed metal adsorption isotherms using duplicate colloid suspensions of 50 mg colloid L-1 spiked with 2 mg L-1 Cu, Pb, Se, and As. The Smoluchowski approximation was used to determine zeta potentials from electrophoretic mobilities in colloid suspensions with 0.001M NaCl background electrolyte using a Malvern Zetasizer Nano ZS (Malvern, United Kingdom). Selected characterization data of the colloid fractions are shown in Tables 1 and 2.
Soil monolith preparation and characterization
Twenty-two intact soil monoliths (D-18x H-30 cm) representing the Bt horizon of an Ashton soil series (Fine-silty, mixed, active, mesic Mollic Hapludalfs) were encased in PVC columns and sealed with Poly-U-Foam to decrease preferential flow. Four extra monoliths were collected for characterization. Soil bulk density (Db) was determined from triplicate oven dried cores collected with a bulk density probe. Hydraulic conductivity was determined on measurements taken at 10 minute intervals for one hour at upper and lower boundaries set first at -10 cm and then at -5 cm prior to leaching experiments. A representative monolith sample was air dried, ground, homogenized and analyzed for mineralogy, pH, EC, OC and CEC using the methods described in the colloid chemical characterization section. Particle size analysis was completed using the pipette method.
Colloid leaching experiments
Colloid-contaminant suspensions of 2 mg L-1 As, Cu, Se and Pb with 50 mg L-1 colloid were infused through duplicate columns using an unsaturated, steady state, unit gradient, downward percolation experiment with upper and lower boundaries set at -5 cm, referring to a hydraulic conductivity of 5.57 mm per hour, representing a 10- day Kentucky rainstorm with a 2-year frequency of reoccurrence. Infusions occurred over four continuous pore volumes. Soil Measurement Systems infiltrometers attached to baseplates at the top of the monolith controlled the upper boundary while a marriote device at the bottom of the monolith controlled the lower boundary. Collection vials allowed sample collection at the outlet of the marriote device at the lower boundary. Control monoliths were infused with DI Water solutions of 2 mg L-1 As, Cu, Se and Pb. Infusion of a 0.02 M solution of KBr acted as a conservative tracer. Leaching experiments were conducted under controlled temperature conditions (200 C).
Eluted colloid concentrations were determined using a colorimetric procedure on a Molecular Devices Versa Max Microplate Reader at 450 nm alongside a standard colloid curve. The pH and EC were measured using a Denver Instruments Model 250 pH*ISE*electrical conductivity meter (Arvada, CO). DOC was determined on 20 mL samples acidified with 50 μL of concentrated HCl on a Flash EA 1112 Series NC Soil Analyzer (Thermo Electron Corporation) with a Mettler Toledo MX5 microbalance. Eluted colloid mineralogy was determined using XRD and TG analysis and checked against the composition of colloids from the stock suspension. This comparison allowed assessment of colloid contamination from the column matrix and preferential filtration of specific minerals [4,15].
Total, soluble, and sorbed metals were analyzed using a Millipore filtration system set up with 0.025 µm nitrocellulose filters. Blanks consisted of 30 mL of double-deionized water passed through and analyzed for As, Cu, Pb, and Se. Aliquots (15 ml) of eluent samples were filtered and analyzed for soluble As, Se, Cu and Pb. Finally, 15 mL of 1N trace metal grade nitric acid was passed through the filter and analyzed for sorbed metals. Filtered samples were preserved with 1% nitric acid, stored in polyethylene vials, and analyzed within 24 hours via ICP-MS.
Statistics
Significant differences between means were tested using ANOVA (SAS PROC GLM) and the Fisher’s protected LSD in SAS 9.3 (SAS Institute Inc., Cary, NC, USA). The statistical significance level used was α = 0.05.
Results and Discussion
Soil monolith characteristics
Leaching experiments were conducted with soil monoliths representing depths of 5 cm to 35 cm below the surface with a neutral pH (7.07), 1.45% OC, and 42% porosity (Table 3). The pH of the monoliths (7.07) was considerably higher than the colloid suspensions (4.92 to 5.39) (Tables 2 and 3). The monoliths had a loam texture, and a CEC (8.12), typical of a mixed clay mineralogy (Table 3). The CEC of the monoliths was comparable to that of the mixed and kaolinitic colloid suspensions, but significantly lower than that of the smectitic and biosolid colloids (Tables 2 and 3). The loam texture, porosity, and hydraulic conductivity suggested adequate potential for subsurface flow pathways for transport (Table 3). Contaminant sorption affinity by the soil monolith matrix as indicated by Freundlich coefficients (Kf) followed the sequence Pb > Cu > Se > As. However, all values (except for the Kf(As) of the biosolid nanocolloids) were lower than those of the colloid fractions suggesting little competition during the contaminant transport process (Table 3).
Properties
Colloids
Smectitic
Mixed
Kaolinitic
Biosolid
Size Class
Macro
Nano
Macro
Nano
Macro
Nano
Macro
Nano
SEM/TEM Mean Smallest Particle Size ±SD (nm)
328±144
37±13
549±394
7±5
288±184
41±19
363±338
50±19
DLS Mean Particle Size (dH) ±SD (nm)
487±10
181±3
596±21
205±4
545±25
187±4
4456±599
353±8
Surface Area (m2 g-1) ±SD
708±137
879±76
420±105
466±10
333±37
389±44
1674±70
1303±63
% Stability after 48 hours with 2 mg L -1 contaminant additions
74.20
67.80
38.00
57.70
22.20
69.90
7.60
30.10
Kaolinite (%)
29
30
42
46
52
55
NA §
NA §
Geothite (%)
7
9
5
7
12
15
NA §
NA §
Gibbsite (%)
0
0
0
0
5
6
NA §
NA §
Quartz (%)
6
4
5
3
4
2
NA §
NA §
Mica (%)
10
6
31
30
3
3
NA §
NA §
Smectite (%)
48
51
0
0
0
0
NA §
NA §
MVI ¶ (%)
0
0
7
7
0
0
NA §
NA §
HIV# (%)
0
0
10
7
24
19
NA §
NA §
SD = Standard Deviation was calculated for duplicate or triplicate measurements (see Methods section).
§ NA = Not Applicable
¶ MVI = Mica-Vermiculite Interstratified
# HIV = Hydroxyinterlayered Vermiculite
Table 1: Selected physical and mineralogical characteristics of nano- and macro-colloid fractions.
Properties
Colloids
Smectitic
Mixed
Kaolinitic
Biosolid
Size Class
Macro
Nano
Macro
Nano
Macro
Nano
Macro
Nano
Electrical Conductivity (mmhos cm -1)
3.93x10⁻³
6.07x10⁻³
2.91x10⁻³
3.09x10⁻²
2.87x10⁻³
3.80x10⁻³
1.56x10⁻²
4.69x10⁻²
Natural pH
4.92
5.12
5.07
4.92
4.91
5.38
5.39
5.25
CEC (cmolc kg-1) #
35.05±12.84
42.19±15.12
8.89±1.62
10.51±1.67
6.94±1.85
13.12±2.84
37.61±14.85
70.99±22.98
Kf (Se) Kg L -1
4.12
3.95
3.85
4.00
3.79
4.03
4.22
3.92
Kf (As) Kg L -1
3.04
3.26
3.32
3.48
3.70
3.39
3.78
1.32
Kf (Cu) Kg L -1
5.04
5.44
5.30
5.52
5.22
5.16
5.62
5.30
Kf (Pb) Kg L -1
4.55
6.18
5.67
5.48
7.39
4.54
6.57
6.15
OC (mg kg-1)
658
897
645
774
430
647
1.3K
16K
Zeta Potential (mV)
-27
-28
-34
-39
-34
-38
-19
-11
SD = Standard Deviation for duplicate or triplicate measurements.
# CEC = Cation Exchange Capacity by sum of cations.
Kf = Freundlich sorption coefficient
OC = Organic Carbon (TOC-DOC).
Table 2: Selected chemical characteristics of the nano- and macro-colloid fractions.
pH
7.07
Total C
1.45%
Bulk Density g cm-3
1.54
Porosity
42%
Texture
Loam
Hydraulic Conductivity (mm h-1)
5.57
CEC cmolc kg-1
8.12
Na+ cmolc kg-1
0.01
Ca2+ cmolc kg-1
8.06
Mg2+ cmolc kg-1
1.52
K+ cmolc kg-1
0.23
Kf (Se) Kg L -1
2.82
Kf (As) Kg L -1
2.46
Kf (Cu) Kg L -1
3.56
Kf (Pb) Kg L -1
3.92
Clay Mineralogy Class
Mixed
Kaolinite %
35
Mica %
20
HIV# %
15
Goethite %
12
MVI ¶ %
10
Quartz %
5
Feldspar %
3
¶ MVI = Mica-Vermiculite Interstratified
# HIV = Hydroxyinterlayered Vermiculite
Kf = Freundlich sorption coefficient
Table 3: Selected soil monolith characteristics.
Eluent solution characteristics
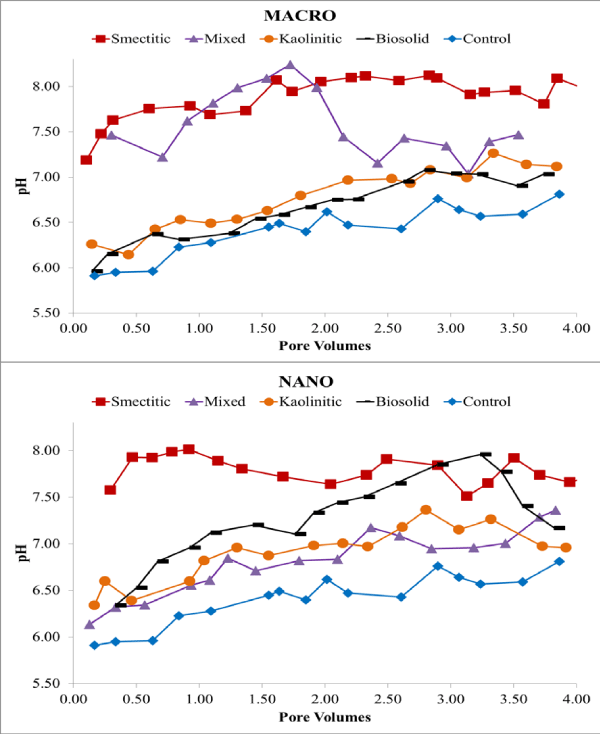
Eluents were collected over four continuous PV and analyzed for pH, EC, and DOC. Overall, eluent pH (Figure 1) was higher than the initial colloid-contaminant suspension pH (Table 1) suggesting significant buffering by the soil matrix and potential enhancement of colloid stability and mobility [15-17]. This was more likely for the smectitic nanocolloids and mixed macrocolloid fractions, which showed pH ranges between 7.51-8.02 and 7.01-8.24, respectively (Figure 1). Eluent pH > 7 probably resulted from dissolution of trace carbonates present within the soil matrix. The lowest eluent pH was associated with the biosolid macrocolloids and mixed nanocolloids, showing 5.96-7.08 and 6.14-7.36, respectively (Figure 1).
Figure 1: Eluent pH for macro- and nano-colloid suspensions.
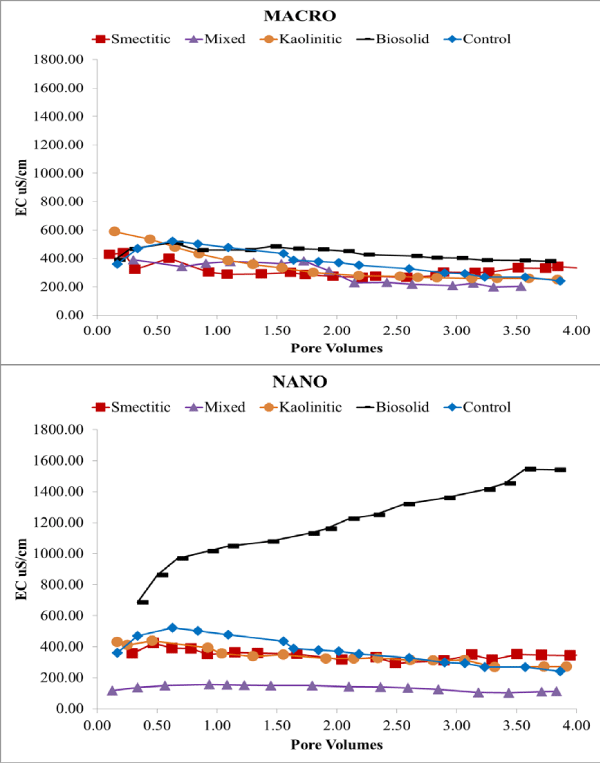
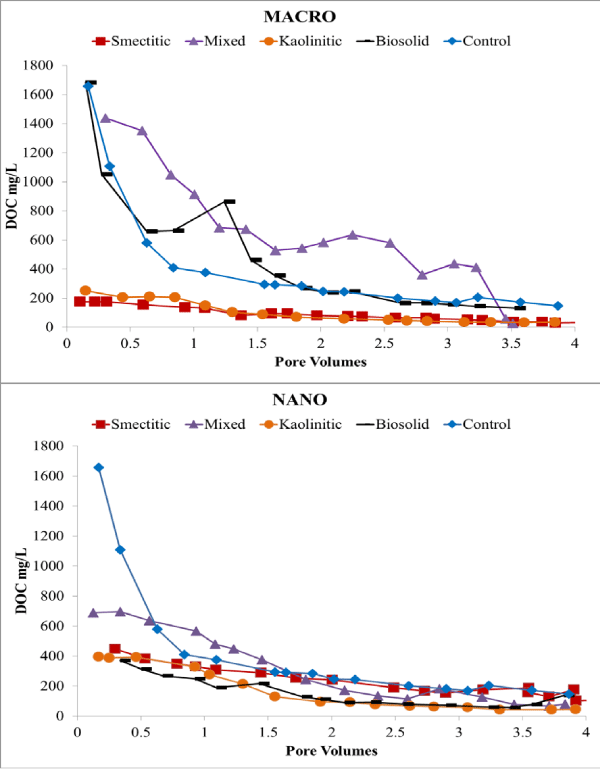
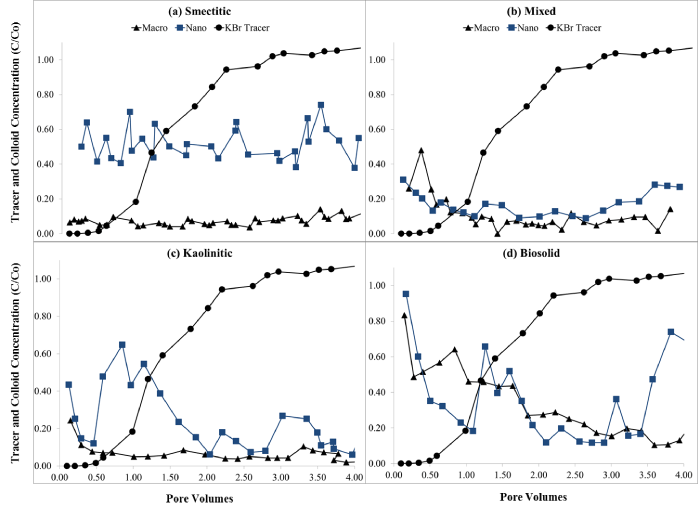
Electrical conductivity remained constant or decreased slightly over time except for the nano-biocolloid fraction which showed a more than 2-fold increase by the end of the leaching cycle (Figure 2). The nanocolloid eluents had higher DOC concentrations than did the macrocolloid eluents, with the exception of the mixed and biosolid macrocolloids (Figure 3). This is consistent with the higher TOC levels of the nanocolloid-suspensions prior to leaching (Table 1). Studies have indicated that 83-99% of all TOC is expected to be leached as DOC [18]. The high initial DOC of the nanocolloid fractions may have also induced the instantaneous breakthrough curves (Figure 4), which have usually been associated with greater facilitated transport [17]. Significant fluctuations of the nano- biocolloid eluents were associated with increased EC and significantly higher pH likely caused by carbonate dissolution (Figure 2,4). Abrupt fluctuations in eluent pH, EC, and DOC are probably associated with clogging and flushing of pores by colloid particles during the leaching cycle.
Figure 2: Eluent EC of macro- and nano-colloid suspensions.
Figure 3: Eluent DOC of macro- and nano-colloid suspensions.
Figure 4: Eluent concentrations (C/Co) for KBr tracer and for (a) smectitic, (b) mixed, (c) kaolinitic, and (d) biosolid macro- and nano-colloids (average of duplicate soil monoliths with SE < 10%).
Eluent colloid break through curves (BTCs)
Eluents from monoliths receiving nano- and macro-colloid suspensions portrayed irregular colloid BTCs (Figure 4). This usually occurs when colloids are transported and deposited in clusters, resulting in blocked macropores that are irregularly flushed after water pressure builds [15,19]. The instantaneous breakthrough of colloids ahead of the conservative KBr tracer suggests preferential flow and size exclusion as the dominant colloid transport mechanisms [3,4,15]. Monoliths receiving nanocolloids generally showed greater mobility than macrocolloid suspensions, which was for the most part consistent with their stability trends (Figure 4, Table 1). The smectitic nanocolloids showed the highest and more consistent breakthrough compared to their corresponding macrocolloid fraction, with average C/Co concentrations as high as 51% (Figure 4a). Lower macrocolloid elutions were attributed to greater matrix straining due to their larger size, while irregular nanocolloid BTCs may be indicative of nanocluster transport [20]. The bio-macrocolloid fraction exhibited one of the highest initial breakthroughs, followed by a substantial reduction in eluent colloid concentration, which dropped erratically from 83% to < 18% by the end of the leaching cycle (Fig. 4d). The bio-nanocolloid fraction exhibited the highest initial breakthrough (96%) but also the most irregular elution, with C/Co concentrations fluctuating between 18 and 75 % thereafter. Resurgence of colloid elution after a gradually declining trend is probably the result of flow path clogging and flushing cycles from backed up water pressure [3,20]. Likely examples of this pattern were notable with the kaolinitic nanocolloids at 0.5, 2.0, and 2.8 pore volumes and biosolid nanocolloids at 1.2, 2.9, and 3.4 pore volumes, respectively (Figure 4c,4d). The smectitic nanocolloids also showed somewhat erratic BTCs, but with a lower fluctuation range than the kaolinitic or the biosolid nanocolloids (Figure 4).
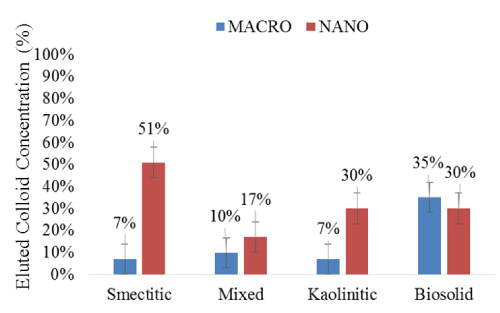
Although their irregular BTCs suggested a cluster-like transport [19,21], nanocolloids were eluted in significantly higher concentrations than their corresponding macro-fractions (Figure 5). The greater mobility of the nanocolloids may have been induced by relatively higher DOC concentrations and their smaller size, which allowed them to bypass matrix filtration processes [20]. The most drastic differences were observed with the smectitic and kaolinitic nanocolloids, with respective average concentrations of 51 and 30% compared to only 7% for the macrocolloid fractions. The mixed colloids displayed the smallest difference between sizes within the mineral colloids, yet they still eluted 1.7 times more particles in the nano- than in the macro-fraction (Figure 5). There was no significant difference based on size in the elution of bio-colloids, although the particle concentration was 5% higher in the macro compared to the nano-fraction (Figure 5). The consistently higher breakthrough of the soil nanocolloid fractions highlights their greater mobility and potential risk as contaminant transport vectors in subsurface environments.
Figure 5: Mean concentrations (%) of eluted colloid fractions during the leaching experiments (error bars represent SE).
The overall compositional trends based on size were as follows: a) for the nanocolloid fractions, smectitic > kaolinitic = biosolid > mixed; and b) for the macrocolloid fraction, biosolid > mixed = smectitic = kaolinitic (Figure 5). Based on averages across both sizes, compositional trends for colloid elution indicated the following sequence: biosolid = smectitic > kaolinitic = mixed. Instantaneous breakthrough and greater elution of smectitic compared to nanocolloids of mixed and kaolinitic mineralogy was also reported by other investigators [3]. Other studies have shown similar kaolinitic recoveries, but indicated greater overall recoveries of smectitic and mixed colloid fractions, which may be attributed to higher input concentrations of colloid-suspensions [3,4]. The lower elution of the mixed nanocolloids could be attributed to their higher initial EC (Table 1), which may have caused some aggregation and destabilization [4]. The low mobility of the smectitic macrocolloids may be explained by their relatively high goethite content (Table 1). Fe-hydroxide- coated macrocolloid smectitic surfaces may exhibit a PZC of ~8, which is near the pH of the eluents, causing considerable coagulation and straining to occur [3]. The smaller fluctuations in the macrocolloid BTCs compared to those of the nanocolloid fractions, insinuate more consistent matrix filtration effects after the initial breakthrough and less reactive behavior within the monolith matrix [22].
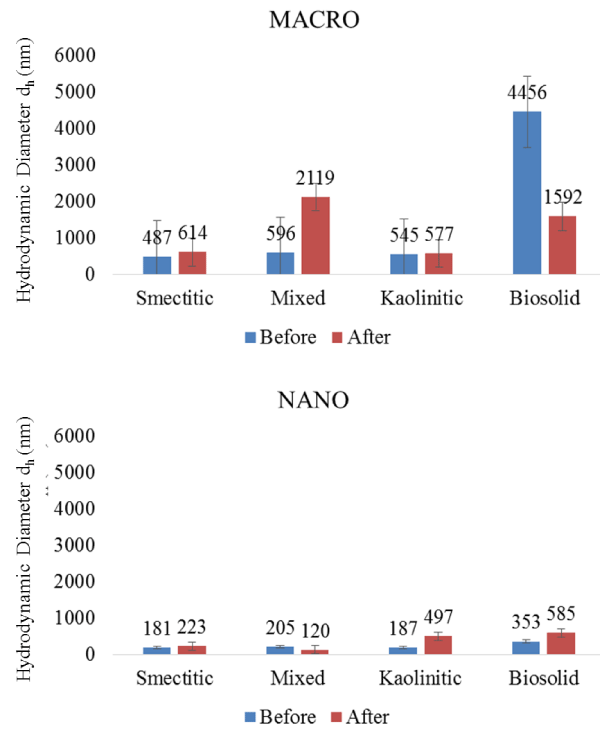
The eluted colloids showed similar mineralogical composition to the infused colloids, suggesting very little preferential filtration or contamination by the monolith matrix. However, despite indications of enhanced transport with decreasing particle size, DLS measurements of eluted colloids indicated some aggregation, as evidenced by larger dH sizes compared to those of colloid-suspensions prior to leaching (Figure 6). The largest average size increase in colloid eluents was associated with the mixed macrocolloids (2119 vs. 596 nm) and the smallest with the kaolinitic macrocolloids (577 vs. 545 nm), respectively. Within the nanocolloid eluted fractions, the largest size was associated with the biosolid composition (585 nm), and the smallest with the mixed composition (120 nm) (Figure 6). Most eluted colloid average sizes were larger than the mean dH of the infused colloid suspensions (except for mixed nanocolloid eluent and biosolid macrocolloid eluents). This emphasizes the reactive behavior among colloid particles and between colloid particles and the monolith matrix during their migration within the pore space. It also underscores the importance of preferential flow pathways and size exclusion mechanisms in the colloid and contaminant transport processes in subsurface environments [4]. It further demonstrates that colloids are likely transported in clusters as nano- or macroaggregates rather than as individual particles [21]. Even though the size of some of the eluted fractions may be distorted by a few soil matrix particles detached from the monolith during the leaching cycle, the similar mineralogy between infused and eluted colloids suggested that such contamination of eluted colloids was not a significant factor.
Figure 6: Hydrodynamic diameter (dH) of colloid fractions before and after elution from soil monoliths (error bars represent SE).
Contaminant elution BTCs
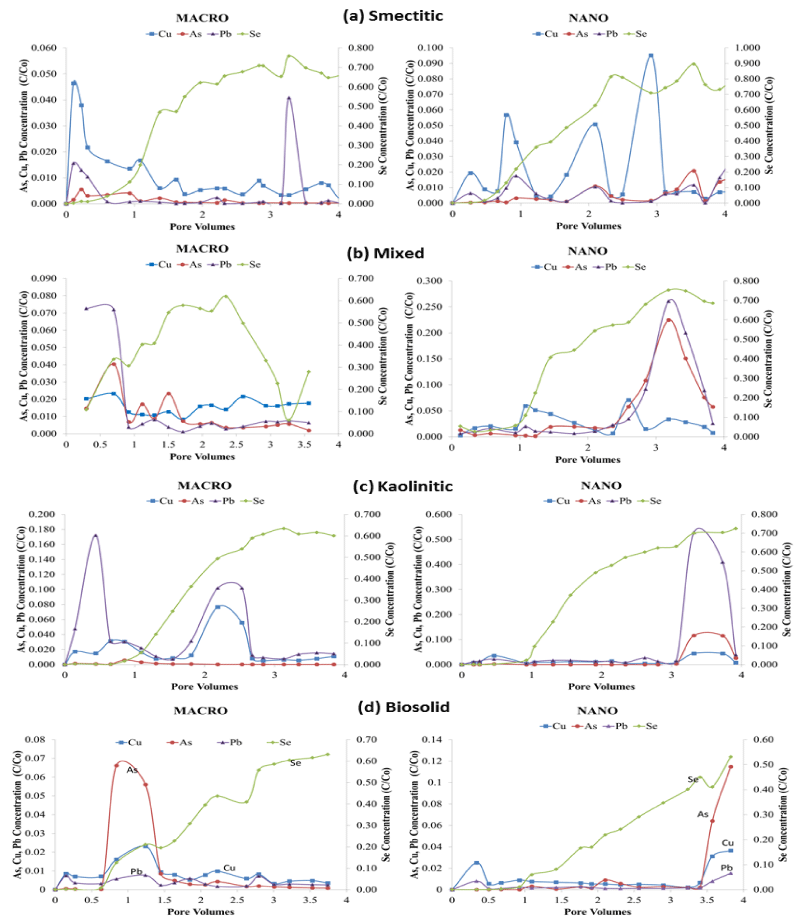
Figure 7 shows BTCs of total contaminant loads eluted from the soil monoliths by colloid composition and size. Most BTCs exhibited irregular elution patterns with multiple spikes and valleys indicative of clogging and flushing of conducting pores during the leaching cycle [19,23]. However not all maxima and minima coincided with those observed in the colloid BTCs, indicating multiple pathways of transport. Selenium was the only contaminant consistently showing a gradual increase in elution over time except for the mixed macrocolloid fraction which showed a drastic decrease in eluent concentration between 2.5 and 3.3 PV before ascending again towards the end of the leaching cycle. Interestingly, Se was the contaminant eluted in the highest concentrations by all colloids highlighting its great mobility through soil media (Figure 7). Both colloid size fractions showed high initial breakthroughs of As, Cu, and Pb, with the nanocolloids showing greater fluctuations and higher maxima than macrocolloids. Generally, contaminant loads eluted in association with nanocolloids were higher than those eluted with macrocolloid fractions, with magnitudes varying with composition.
Figure 7: BTCs for total metal concentrations (C/Co) eluted by pore volume in association with (a) smectitic, (b) mixed, (c) kaolinitic, and (d) biosolid macro- and nano-colloids (left y axis for As, Cu, Pb; right y axis for Se).
Overall, the smectitic nanocolloids were the most effective in transporting all four contaminants, with highly erratic BTCs, particularly for Cu (Figure 7a). Elution maxima for the contaminants coincided well with nanocolloid elution patterns (Figure 4a), suggesting co-transport mechanisms. Eluted Se concentrations in association with smectitic nanocolloids peaked at 0.90 C/Co after 3.5 PV compared to 0.75 C/Co for the macrocolloid fraction. Copper eluted in association with smectitic nanocolloids showed multiple maxima between 0.02 and 0.10 C/Co, while the macrofraction exhibited a high initial breakthrough near 0.05 C/Co followed by a moderately irregular and gradually declining elution pattern terminated at <0.01 C/Co. The elution of As and Pb in the presence of smectitic nanocolloids closely followed the pattern of Cu with lower maxima (C/Co < 0.02), but still at least twice as high to those shown by the macrocolloid fraction. The lower total contaminant elution associated with the macrocolloid fraction suggest more matrix filtration likely due to their larger size and emphasizes the importance of particle size in contaminant transport [20,23].
The mixed colloids had differing trends based on size, with the nanocolloids showing higher overall maxima in later stages and the macrocolloids in early stages of the leaching cycle (Figure 7b). Nanocolloid associated Se peaked at 3 PV with a 75% elution compared to 60% of the macrocolloid fraction. Eluted As and Pb in association with mixed nanocolloids also reached maxima of 23% and 25% around 3 PV, while the macrocolloids showed maxima of 7% and 4% before the first PV and declined with some fluctuation thereafter. These elution patterns were consistent with colloid elution breakthrough, implicating colloid mediated contaminat transport pathways (Figure 4b). Nanocolloid eluted Cu showed two maxima of 5% between the 1st and 3rd PV, while elution with the macrocolloid fraction fluctuated between 1 and 2%. In spite of the irregular BTCs, nanocolloids eluted greater total concentrations of contaminants, showing total elutions of As, Cu and Pb to be almost 3.5 times greater than corresponding macrocolloids (Figure 7b). Additionally, leaching of As complimented DOC elutions in the mixed colloids, implicating organo-complex effects in the transport process (Figure 3).
Selenium eluted in association with kaolinitic colloids was slightly higher (70% vs. 60%) in the nano than the macro-fraction (Figure 7c). Kaolinitic nanocolloids had elution maxima after the 3rd PV for all other three contaminants of 50%, 12%, and 5% for Pb, As, and Cu, respectively, probably associated with a major flushing event. Themacrocolloid fraction also showed two flushing events before the 1st and between the 2nd and 3rd PV that eluted 10-17% of Pb, and 3-7% of Cu, with As remaining below 1% throughout the leaching cycle. The kaolinitic colloid BTCs indicated greater fluctuations than did the contaminant BTCs, suggesting that dissolved organic ligands may be responsible for carrying more of the load than the colloids themselves [24].
In contrast to the mineral colloids, the biosolid nanocolloids eluted about 10% less Se than the macrocolloid fraction, with significant breakthroughs of other contaminants occurring after 3.5 PV pore volumes (Figure 7d). At that point, elution maxima reached 11% for As, 4% for Cu, and 2% for Pb. This elution pattern coincided with a decrease of one pH unit in the eluent, which apparently mobilized more contaminants. With the exception of maximum elutions of 7% and 2.5% for As and Cu, respectively between the 0.5 and 1.5 PV in the macrocolloid fraction, contaminant elution for the rest of the leaching cycle was similar for both colloid fractions fluctuating between 0 and 2%. The elution maxima of As and Cu at that point were apparently induced by a flux of DOC constituents (Figure 3). Both of these contaminant elution peaks were also corroborated with colloid breakthrough maxima patterns (Figure 4d). The drastic increase of the EC in macrocolloid suspensions during the leaching cycle may have also inhibited contaminant mobility (Figure 2) due to sorption or precipitation reactions induced by carbonate dissolution [14].
Despite greater overall contaminant elutions (Figure 7) and higher initial eluted colloid concentrations (Figure 4) by nanocolloids, macrocolloid BTCs exhibited faster initial breakthrough times for contaminats by about half a pore volume. The delayed breakthrough of contaminants observed in the mixed, kaolinitic and biosolid nanocolloid fractions may insinuate that significant contaminant elution increases occurred only after a certain contaminant saturation threshold of the soil matrix had been reached [23]. The faster breakthrough of the smectitic nanocolloids in association with contaminants highlights their greater mobility and surface reactivity that outcompetes other nanocolloids. The relatively stable pH of the smectitic nanocolloid suspensions compared to other nanocolloids which experienced pH increases of over a unit in the course of the leaching cycle may have also enhanced their potential for contaminant migration through the soil monoliths (Figure 1).
Eluted total contaminant loads
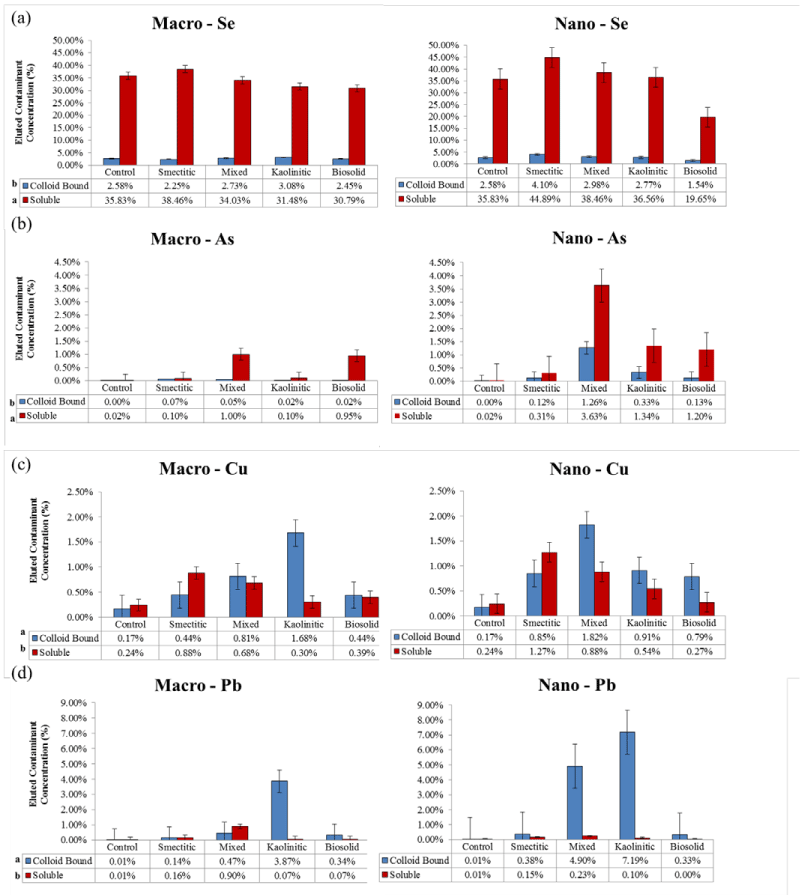
Individual contaminants: Figure 8 depicts average trends for total soluble and colloid-bound contaminant loads eluted in the leaching experiments. Overall, there were greater colloid-bound associations for Pb and Cu and higher soluble contaminant associations for Se and As contaminants. With the exception of Se, the presence of colloids enhanced contaminant elutions above that of the control treatment (contaminants added without colloids) (Figure 8). Total amounts of contaminants eluted in association with the colloids followed the sequence (α = 0.05): Se > Pb = Cu ≥ As, with specific preference trends for different colloid composition and size. Selenium was by far the contaminant with the highest eluted soluble loads across all colloid fractions. However, only the smectitic (macro- and nano- ) fractions demonstrated significantly greater potential for Se cotransport. The rest of the colloids failed to show significant differences from the control and in the case of the bio-nanocolloids elution totals were lower than the control (Figure 8a). Studies have shown that Se is highly mobile in the environment and more likely to be quickly leached through the soil as an oxy anion [25-27]. In spite of this trend, the kaolinitic and mixed macrocolloids, as well as the smectitic and mixed nanocolloids demonstrated significant associations with the colloid-bound Se fraction (Figure 8a). These associations are most likely the result of weak outer sphere cation bridging mechanisms between organic functional groups and Se anions [23,28]. The relatively high DOC concentrations of the smectitic nanocolloids may explain the enhanced colloid-bound Se transport through this mechanism (Figure 3).
Figure 8: Mean concentrations of % soluble and colloid-bound Se, As, Cu, and Pb eluted over that infused in association with different colloids compared to the control (no colloids) (error bars represent SE).
Although As, like Se, behaves as an oxy-anion in soil environments, soluble As loads eluted in association with colloid fractions were drastically smaller than those for Se (Figure 8b). Nevertheless, eluted soluble As loads were generally significantly higher than the colloid-bound eluted fraction. The highest elutions of soluble As were associated with the mixed and biosolid macrocolloids, and the mixed nanocolloids. Despite having 15 times more soluble As eluted in association with the smectitic nanocolloids and 5 times more with the kaolinitic and smectitic macrocolloids over the control, the differences were not statistically significant due to large standard errors. Colloidbound As was higher for the mixed nanocolloids although all nanocolloids eluted higher colloid-bound As concentrations than the control (Figure 8b). The consistent association of As with the mixed nanocolloid fractions is likely due to their high mica and DOC content (Table 1), which has been shown to possess As retention properties [29]. Colloid-bound arsenate transport is likely through the formation of organic complexes and cation or Fe/Al-OH bridging mechanisms [30-32]. The higher overall elution of colloid-bound As in the presence of nanocolloids may have also been induced by high Al/Fe:Si and C:SA ratios [23] (Table 1).
In contrast to Se and As, most of the Cu loads eluted in the presence of colloids were associated with the colloid-bound fraction (Figure 8c). The exception was the smectitic colloids which showed higher soluble than colloid- bound Cu elutions, apparently induced by organic complex formations and size or ion exclusion mechanisms. Overall, macrocolloids eluted 1.6 to 3.7 times more soluble Cu than the control. The corresponding range for nanocolloids was 1.5 to 11 fold. Generally, the mineral nanocolloids had higher soluble Cu associations than the biosolid colloids, emphasizing their greater potential for mediating contaminant transport. The lower initial pH of nanocolloid suspensions compared to that of macrocolloids (Table 1) may have contributed to higher soluble Cu elutions through carbonate dissolution (Figure 1) and metal-organo complex formation [14]. Although some reports cite high affinity of Cu for biocolloids and significant bio-colloid mediated transport [14,17], the biosolid nanocolloids in this study failed to show significantly higher soluble-Cu elution than the control (Figure 8c). This may indicate enhanced organic-Cu complex formation and immobilization within the monolith soil matrix. The highest colloid-bound Cu elutions were associated with the mixed nanocolloid and kaolinitic macrocolloid fraction (Figure 8c). With the exception of the kaolinitic colloids,nanocolloids generally transported greater colloid-bound Cu loads than macocolloids. However, these loads were much lower than those reported in other studies where biosolid and smectitic colloids demonstrated high affinity for Cu co-transport potential [17]. The weaker association found in this study could be attributed to both lower inputs of colloid and contaminant concentrations and greater competitive sorption of Cu by the soil monolith matrix likely due to higher pH (7.07) as compared to that of the colloid-suspensions (<5.36) [14,24,33].
Significant soluble Pb loads eluted in association with colloids were detectable only with the mixed macrocolloid fraction but still <1% (Figure 8d). The low soluble Pb elutions were attributed to the high sorption affinity of Pb to both soil matrix and colloid surfaces and the tendency to form organo-colloid complexes with OH - , carboxylic, and phenolic groups [14,33]. In addition, the high pH of the soil monolith matrix may have caused some Pb-carbonate precipitation, which may have even limited some of the colloid bound Pb elution. This is corroborated by the consistently high pH of the smectitic eluents which showed the lowest overall Pb elution (Figure 1). The highest colloid-bound Pb concentrations were eluted in the presence of kaolinitic macro- and nanocolloids and the mixed nanocolloid fraction (Figure 8d). These fractions also exhibited some of the lowest overall pH elution patterns (Figure 1), emphasizing the impact of pH in the co-transport process.
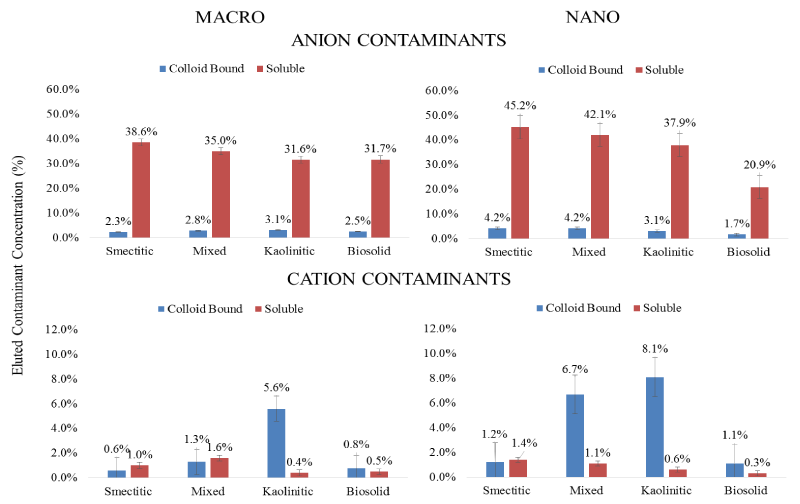
Anionic vs. cationic contaminants: Average trends for cation and anion contaminant loads eluted through the monoliths are displayed in Figure 9. It is clear that a major portion of the anionic contaminants (Se and As) were consistently eluted in the soluble fraction by all colloids, while most of the cationic contaminant load was eluted in the colloid-bound fraction. Selenium and As typically found as oxy-anions in soil environments are usually repelled, while Cu and Pb being positively charged are expected to readily sorb to the negatively charged colloid surfaces [34,23]. Overall, the total amount of the eluted anionic contaminants was at least 5 times greater than the eluted cationic contaminant load. Within the nanocolloid fraction the capacity for soluble anionic contaminant transport followed the sequence: smectitic> mixed> kaolinitic> biosolid, while the sequence for the macrocolloid fraction was: smectitic>mixed>kaolinitic=bi osolid. Surprisingly, a greater than expected load of colloid-bound anionic contaminants was mobilized by most colloids, particularly in association with the smectitic and mixed nanocolloid fractions, likely due to organic C and cation bridging mechanisms [23,35]. Eluted soluble cation contaminant loads averaged < 1.6% and were greater with the smectitic and mixed colloid fractions. The capacity for colloidbound cationic contaminant transport within both nanocolloid and macrocolloid fractions followed the sequence: kaolinitic>mixed> smectitic = biosolid, with the nanocolloids generally showing higher potential. The higher elution capacity for cationic contaminants shown by the kaolinitic colloids is likely due to enhanced mobility of contaminant carrying particles within a comparatively lower pH porous medium that inhibits carbonate precipitation, and their high Fe/Al-OH content (Figure 1). Generally, contaminant co-transport was greater by mineral- than biosolid colloids and with the exception of biosolid colloids by nano- vs. macrocolloid fractions (Figure 9). Even though sorption isotherms indicated differences in sorption amongst only a select few size fractions, it is likely that greater cotransport of contaminants in association with mineral nanocolloids is likely due to less matrix straining and more size and ion exclusion processes [3,4,17].
Figure 9: Mean concentrations of % soluble and colloid-bound metal loads eluted over that infused in association with different colloid fractions for anionic and cationic contaminants (error bars represent SE).
Conclusion
The findings of this study demonstrated that smaller size nanoparticles have a tendency to form larger size nanoclusters during subsurface transport processes but still may pose a greater threat to groundwater quality than macro-colloid fractions. In spite of negligible to small differences in mineralogical composition and contaminant sorption affinity, leaching experiments indicated significantly higher colloid-bound and soluble loads of As, Se, Cu and Pb contaminants transported in association with nanocolloids than macrocolloids. Apparently, the smaller nanocolloid size and higher surface area along with increased OC coatings and greater stability allowed for less straining and enhanced mobility compared to that of the larger size macrocolloids within the soil monolith matrix. Contaminant transport patterns generally followed the order, Se>Cu, Pb and As, with mineral colloids carrying larger loads of contaminants than bio-colloids, but with contaminant preferences based on composition. Greater Se migration was associated with the smectitic colloids, while greater quantities of Pb and Cu were transported in association with kaolinitic and mixed nano-fractions. Finally, the mixed colloids, particularly the nano-fraction, were associated with greater quantities of As. The higher pH of the monolith matrix as compared to that of the input colloid suspensions may have acted as a remediatory agent, inhibiting somewhat the migration of the cationic contaminants (Cu, Pb). Colloid-facilitated transport of anionic contaminants (As, Se) was apparently mediated by cation bridging with organic functional groups, while for cationic contaminants (Cu, Pb) by specific sorption and direct complex formation with organically coated colloid surfaces. The increase of both, the soluble and colloid-bound contaminant loads in the presence of colloid particles emphasizes their dual role as contaminant carriers and facilitators. Increased elutions of soluble loads compared to control treatments are probably associated with ion exclusion from matrix sites blocked by migrating or attached colloid particles. The uncertainties associated with the contaminant sorption affinities to predict colloid mediated transport highlights the importance of transport experiments in assessing the complexities of environmental contaminant behavior. This is particularly critical for nano-size particles of certain mineralogical composition that demonstrate a strong potential to mobilize large amounts of specific contaminants to greater than expected distances and pose a severe threat to groundwater quality.
References
- Hochella MF Jr, Lower SK, Maurice PA, Penn RL, Sahai N, Sparks DL, et al. Nanominerals, mineral nanoparticles, and Earth systems. Science. 2008; 319: 1631-1635.
- Maurice PA, Hochella MF Jr. Nanoscale particles and processes: A new dimension in soil science. Adv. Agron. 2008; 100: 123-153.
- Karathanasis AD. Composition and transport behavior of soil nanocolloids in natural porous media. Frimmel FH, Niessner R, editors. Chapter 4. In: Nanoparticles in the water cycle. Springer-Verlag Berlin Heidelberg. 2010; 35-54.
- Seta AK, Karathanasis AD. Stability and transportability of water-dispersible soil colloids. Soil Sci. 1997; 61: 604-611.
- McCarthy JF, McKay LD. Colloid transport in the subsurface: Past, present, and future challenges. Vadose Zone J. 2004; 3: 326-337.
- Madden AS, Hochella MF Jr, Luxton TP. Insights for size-dependent reactivity of hematite nanomineral surfaces through Cu2+ sorption. Geochim Cosmochim Ac. 2006; 70: 4095-4104.
- Waychunas GA, Zhang HZ. Structure, chemistry, and properties of mineral nanoparticles. Elements. 2008; 4: 381-387.
- McCarthy JF, Zachara JM. Subsurface transport of contaminants. Environ. Sci. Technol. 1989; 23: 496-502.
- Nemeth T, Jimenez-Millan J, Sipos P, Abad I, Jimenez-Espinosa R, Szalai Z. Effect of pedogenic clay minerals on the sorption of copper in a Luvisol B horizon. Geoderma. 2011; 160: 509-516.
- Zhu R, Lu S. A high-resolution TEM investigation of nanoparticles in soils. In Molecular Environmental Soil Science at the Interfaces in the Earth's Critical Zone, Session 4 Springer Berlin Heidel. 2010; 282-284.
- Deng Y, White N, Dixon JB. Soil Mineralogy Laboratory Manual Texas A&M University, College Station, TX. 2009.
- Goldstein JI, Newbury DE, Echlin P, Joy DC, Fiori C, Lifshin E. Scanning Electron Microscopy and X-ray microanalysis. 2nd edn. New York: Plenum Press. 1992; 820.
- Karathanasis AD. Thermal Analysis of Soil Minerals. Ulery AL, Drees LR, editors. Chapter 5. In: Methods of Soil Analysis, Part 5- Mineralogical Methods. Soil Sci. Soc. Am. Book 5, Madison, WI. 2008; 117-160.
- Karathanasis AD, Johnson DMC, Matocha CJ. Biosolid colloid-mediated transport of copper, zinc, and lead in waste-amended soils. J. Environ. Qual. 2005; 34: 1153-1164.
- Karathanasis AD, Johnson DMC, Matocha CJ. Subsurface transport of heavy metals mediated by biosolid colloids in waste-amended soils. Frimmel F, von der Kammer F, Flemming HC, editors. Chapter 7. In: Colloidal Transport in Porous Media. Springer, Cambridge, Mass. 2007; 175-201.
- Seta AK, Karathanasis AD. Water dispersible colloids and factors influencing their dispersibility from soil aggregates. Geoderma. 1996; 74: 255-266.
- Karathanasis AD. Subsurface migration of copper and zinc mediated by soil colloids. Soil Sci. Soc. Am. J. 1999; 63: 830-838.
- Kjaergaard C, Hansen HCB, Koch CB, Villholth KG. Properties of water-dispersible colloids from macropore deposits and bulk horizons of an Agradalf. Soil Sci. Soc. AM. J. 2004; 68: 1844-1852.
- Jacobsen OH, Moldrup P, Larsen C, Konnerup L, Petersen LW. Particle transport in macropores of undisturbed soil columns. Journal of Hydrology. 1997; 196: 185-203.
- Barton CD, Karathanasis AD. Influence of soil colloids on the migration of atrazine and zinc through large soil monoliths. Water, Air, Soil Poll. 2003; 143: 3-21.
- Kjaergaard C, Moldrup P, de Jonge LW, Jacobsen OH. Colloid mobilization and transport in undisturbed soil columns. II. The role of colloid dispersibility and preferential flow. Vadose Zone J. 2004; 3: 423-433.
- Gang C, Flury M. Retention of mineral colloids in unsaturated porous media as related to their surface properties. Colloids Surf. A. Physicochem. Eng. Asp. 2005; 256: 207-216.
- Karathanasis AD, Johnson DM. Subsurface transport of Cd, Cr, and Mo mediated by biosolid colloids. Sci Total Environ. 2006; 354: 157-169.
- Karathanasis AD, Miller JO. Colloid-associated transport and metal speciation at reclaimed mine sites following biosolid application. Selim HM, editor. Chapter 5. In: Dynamics and bioavailability of heavy metals in the rootzone. CRC Press, Boca Raton, FL. 2011; 129-146.
- Wang CB, Zhang W. Synthesizing nanoscale iron particles for rapid and complete dechlorination of TCE and PCBs. Environmental Science & Technology. 1997; 31: 2154-2156.
- Jackson BP, Miller WP. Soluble arsenic and selenium species in fly ash/organic waste-amended soils using ion chromatography - inductively coupled plasma mass spectrometry. Environ. Sci. Technol. 1999; 33: 270-275.
- Goh K, Lim T. Geochemistry of inorganic arsenic and selenium in a tropical soil: effect of reaction time, pH, and competitive anions on arsenic and selenium adsorption. Chemosphere. 2004; 55: 849-859.
- Violante A. Elucidating Mechanisms of Competitive Sorption at the Mineral/Water Interface. In: Donald LS, editor. Chapter 3. In: Advances in Agronomy. Academic Press. 2013; 118: 111-176.
- Huang PM. Retention of arsenic by hydroxy-aluminum on surfaces of micaceous mineral colloids. Soil. Sci. Soc. Am. J. 1975; 39: 271-274.
- Smith E, Naidu R, Alston AM. Chemistry of inorganic arsenic in soils: II. Effect of phosphorus, sodium, and calcium on arsenic sorption. J Environ Qual. 2002; 31: 557-563.
- Voegelin A, Hug SJ. Catalyzed oxidation of arsenic(III) by hydrogen peroxide on the surface of ferrihydrite: an in situ ATR FTIR study. Environ Sci Technol. 2003; 37: 972-978.
- Han DS. Sorption of arsenic, mercury, selenium onto nanostructured adsorbent media and stabilization via surface reactions. Ph.D. [dissertation]. Texas A&M University, College Station, TX. 2009.
- McBride MB, Blasiak JJ. Zinc and copper solubility as a function of pH in an acid soil. Soil Sci. 1979; 43: 866-870.
- Papelis C. Cation and anion sorption on granite from the project Shoal Test Area, near Fallon, Nevada, USA. Adv. Environ. Res. 2001; 5: 151-166.
- Karathanasis AD, Johnson DMC. Stability and transportability of biosolid colloids through undisturbed soil monoliths. Geoderma. 2006; 130: 334-345.
