Research Article
J Plant Chem and Ecophysiol. 2016; 1(2): 1011.
Screening and Identification of Differentially Expressed Genes in Reproductive Stage of Rice (Oryza sativa) Using Digital Differential Display Tools
Ebadi H, Ahmadi DN and Sorkheh K*
Department of Agronomy and Plant Breeding, Shahid Chamran University of Ahvaz, Iran
*Corresponding author: Karim Sorkheh, Department of Agronomy and Plant Breeding, Faculty of Agriculture, Shahid Chamran University of Ahvaz, P.O. Box 61355/144, Iran
Received: October 31, 2016; Accepted: December 07, 2016; Published: December 09, 2016
Abstract
Growth and development of any plant tissue due to variation in genes expression level related to each tissue, indicates the specific pattern of genes expression. The whole of Expressed Sequence Tags (ESTs) of rice clustered in unigene sets in NCBI UniGene database that offer a platform for identifying differentially expressed genes in rice reproductive stage. This report illustrates a means to efficiency utilize this public database for gene expression (transcriptome) profiling reproductive stage. Using a data mining tool known as Digital Differential Display (DDD), comparisons were performed between 52 libraries of reproductive stage and 110 libraries of vegetative stage. DDD identified 812 specific unigene set in reproductive stage. Some of these genes encode for proteins such as prolamin, lipid transfer proteins, glutelin proteins and other unknown but novel gene sequences that’s coded expression proteins without reveal functional. Also, part of genes screened was related to housekeeping genes. This study proves that the use of in silico analysis of the rice UniGene database led to the acceleration in create transcriptional profiles of known and novel genes in developing reproductive stage.
Keywords: Rice; Reproductive stage; Digital Differential Display (DDD)
Introduction
Rice (Oryza sativa L.) is one of the most important cereal crops worldwide, and the major source of human nutrition and livestock feed in many countries [1]. Considering the importance of reproductive phase of plants, identification of specific genes of a reproductive stage can be effective in improving the quality and quantity of cereals. In order to screen these genes, use of expression patterns is resultful [2]. Two analysis approaches, analog and digital used for the estimate of expression level. The analog approach based on oligonucleotide probe hybridizations such as microarray while the digital approach is based on the high-throughput generation of gene transcripts as in the case of Expressed Sequence Tags (ESTs) [2,3]. ESTs are a fast; inexpensive way to determine which genes are being actively transcribed in a tissue or organ at a given stage of development [4,5]. The one of high-throughput generation is Digital Differential Display (DDD) [2]. The goal of this study was to screen and identify genes specifically expressed in the reproductive stage of rice with DDD tool.
Methods and Materials
Extraction of rice cDNA library
In order to determine the level of genes expression was use a total of 623800 rice Expressed Sequence Tags (ESTs) (December 2015) that are available from the National Center for Biotechnology Information (NCBI) database. The ESTs sequences have been divided into162 library. The ESTs were computationally clustered into unigene set. Each unigene set is defined as hypothetical genes that based on sequence homology, originate from the same gene or expressed pseudogene in this study, the UniGene database was analyzed by an in silico tool known as Digital Differential Display (DDD).
Digital differential displays analysis
DDD is an online bioinformatics tool for identification of differentially expressed genes. The general framework of DDD is based on the comparison between the relative abundance of ESTs from various libraries [2,6]. To eliminate the difference caused by the unequal number of ESTs in each selected libraries, DDD uses the Fisher Exact Test. The output provided a numerical value in each pool denoting the fraction of sequences within the pool that mapped to the unigene cluster [2,7]. In the current work Comparisons between libraries related to reproductive phase and other libraries (Vegetative tissue) was used to identify unigene sets that were reproductive stage specific. Libraries chosen for DDD comparison are listed in Table 1. For those libraries that have sequences in UniGene, DDD lists the title and tissue source and provides a general description of each UniGene.
    Reproductive stage (Pool A)
    Vegetative stage (Pool B)


    Tissue
    library
    ESTs
    Tissue
    library
    ESTs


    Panicle
    25
    135641
    Callus
    31
    168798


    Flower
    19
    134349
    Leaf
    39
    177881


    Seed
    3
    22829
    Root
    24
    66590


    Other
    1
    9271
    Stem
    10
    135906


    Mixed
    1
    12172
    Vegetative    meristem
    3
    4537


    Unreported
    2
    21626
    Mixed
    3
    36500


    Total
    52
    335888
    Total
    110
    590212
Table 1: Summary of the libraries used for DDD screening.
Result and Discussion
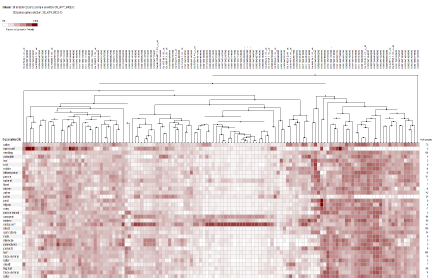
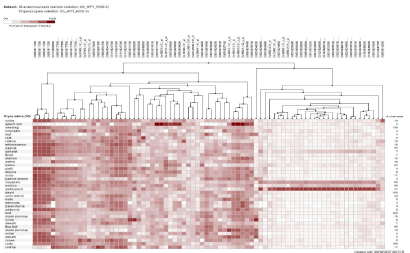
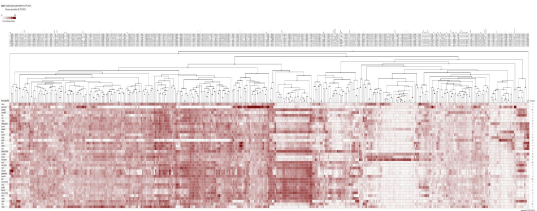
This study explored the utility of DDD as a means of in silico digital transcriptome profiling to identify differentially expressed genes in reproductive stage of rice. The results of DDD comparison led to identification 812 unigene sets. Then, after the blast of sequences each of the unigene sets were assigned to a specific gene. Some of these genes encode for proteins such as prolamin, lipid transfer proteins, glutelin proteins and other unknown but novel gene sequences. Also, part of identified genes was related to housekeeping genes. Screened genes were divided into three groups, high expression (Figure 1A), moderate expression (Figure 1B), and weak expression based on expression level (Figure 1C). The heat map of investigated genes was provided by GENEVESTIGATOR (www.Genevestigator.com). The screened unigene sets by DDD should be converting to probeset that is necessary for heat map [7]. During the analysis, it is worthily noticed that not all the unigenes screened have the corresponding probeset. Analysis of the heat map was confirming the specificity of screened genes in the reproductive stage. The results of developmental stage analysis demonstrated that screened gene expression in the flowering stage was more than other reproductive stages (results not shown). According to this analysis, the specificity of the genes identified in the reproductive stage will be confirmed experimentally using RT-PCR.

    Figure 1A:  Heat map and hierarchical clustering of 812 reproductive stage -specific genes based on their expression profile in different tissue. (A) High expression
group.

    Figure 1B:  Heat map and hierarchical clustering of 812 reproductive stage -specific genes based on their expression profile in different tissue. (B) Moderate
expression group.

    Figure 1C:  Heat map and hierarchical clustering of 812 reproductive stage -specific genes based on their expression profile in different tissue. (C) Weak expression
group. The accession number of each gene was listed on the above. The hierarchical clusters are color-coded: the largest values are displayed in red (hot), the
smallest values are displayed in white, while the intermediate values are a lighter color of either white or red. Pearson correlation clustering was used to group the
developmentally regulated genes.
Conclusion
This study demonstrated the utility of Digital Differential Display (DDD) as a tool to analyze the rice transcriptome via the NCBI UniGene dbEST database. In this study, DDD enabled the identification of numerical differences in transcript frequency between individual or pooled cDNA libraries from various tissues of the reproductive stage [8]. These genes screened during this study will provide valuable information for further studies about the functions of these genes in rice. Bioinformatics methods can be very effective in acceleration to identify novel genes and improvement of costs. It should be noted that any DDD results should be validated experimentally using quantitative RT-PCR or other methods using a panel of genotypes and tissues.
Acknowledgment
The authors wish to acknowledge Shahid Chamran University of Ahvaz, Iran for providing financial support for research and development in Faculty of Agriculture (Grant No. SHU/FAG/1394). The results are part of the Projects of “Identification of seed-specific genes in rice (Oryza sativa L.) using DDD, microarray, and RNASeq”.
References
- Esa NM, Ling TB, Peng LS. By-products of Rice processing: An overview of health benefits and applications. Journal of J Rice Res. 2013; 1-11.
- Equal I, Morris C. Identification of differentially expressed Unigens in developing wheat seed using Digital Differential Display. Journal of Cereal Science. 2009; 316-318.
- Audic S, Claverie JM. The significance of digital gene expression profiles. Genome Research. 1997; 7: 986-995.
- Ince AG, Karaca M, Bilgen M. Digital differential display tools for mining microsatellite containing organism, organ and tissue. Plant Cell Tissue Organ Cult. 2008; 94: 281-290.
- Venglat P, Xiang D, Qiu S, Stone SL, Tibiche C, Cram D, et al. Gene expression analysis of flax seed development. BMC Plant Biology. 2011; 11: 74.
- Pontius J, Wagner L, Schuler GD. UniGene, a unified view of the transcriptome In: The NCBI Handbook National Center for Biotechnology Information, Bethesda, MD, USA. 2002.
- Yang X, Xu H, Li W, Li L, Sun j, Li Y, et al. Screening and identification of seed- specific genes using digital differential display tools combined with microarray data from common wheat. Journal of BMC Genomics. 2011; 12: 513-525.
- Yin G, Xu H, Liu J, Gao C, Sun J, Yan Y, et al. Screening and identification of soybean seed- specific genes by using integrated bioinformatics of digital differential display, microarray, and RNA-seq data. Journal of Gene. 2014; 546: 177-186.