
Research Article
Ann Materials Sci Eng. 2015;2(2): 1022.
Comparative Nano-indentation Creep Study of Ductile Metal, Ductile Polymer and Polymer-fly Ash Composite
Cholake ST¹, Mada MR¹, Kumar R¹, Boughton P1,2 and Bandyopadhyay S¹*
¹School of Materials Science & Engineering, University of New South Wales, Australia
²Biomedical Engineering, AMME School, University of Sydney, Australia
*Corresponding author: Bandyopadhyay S, School of Materials Science & Engineering, University of New South Wales, Sydney, Australia
Received: April 15, 2015; Accepted: July 07, 2015; Published: July 10, 2015
Abstract
A new study is conducted under same experimental creep conditions to investigate and compare the response of dissimilar materials (metals, polymers and composites) in relation to properties such as hardness and (unloading) ‘reduced modulus’ on changing the nano-indentation test parameters. The research uses nano-indentation technique to determine the resistance to plastic deformation in these broadly different materials as a function of maximum load, holding time and loading rate. Wear rate and cutting efficiency of these materials are examined and it is found that only maximum load alters these properties in the three materials. Hardness and ‘reduced modulus’ are found to be directly affected by increase or decrease in maximum load, holding time and loading rate.
Keywords: Nano-indentation; Hardness; Effective modulus; Wear rate
Abbreviations
H: Hardness;Er: Effective Modulus; h: Indentation Depth; hmax: Maximum Indentation Depth at Maximum Load; hc: Indentation Depth in contact with Indenter; hp: Height of Sink-in/pile-up; he: Elastic Recovery Height after Unloading; hc/hmax: Degree of Sink-in/ pile-up; H/Er ²: Rate of wear or Resistance to Plastic Deformation; A: Area of Indentation; S: Stiffness; β: Correction Factor for Indentation Shape; n value: Work Hardening Coefficient Value
Introduction
A concept of determining the mechanical properties of material on nano scale has given rise to the development of a powerful depth sensing nano-indentation technique which is capable of studying the various material properties such as unloading ‘reduced’ modulus [1], hardness [2-4], creep properties [5-8], and fracture toughness [9,10]. Nano-indentation test procedure involves application of predetermined load in the range of μN to mN with the help of either spherical or pyramidal indenter in order to produce the indentation of the order of a few microns (measured in terms of nano-meters), followed by controlled unloading [11]. The contact area of indentation is used to calculate hardness (H) of the material and the slope of unloading curve on load-displacement can be used for determining the ‘effective’ modulus or ‘reduced’ modulus (Er). Later modification in the method was achieved by holding at maximum load constant for some time before unloading (creep) [12]. This modification was done in order to study the visco-elastic and visco-plastic behavior of the materials where conventional nano-indentation method was based on the assumption that material behave in an elastic-plastic manner [13].
The basic information that can be collected from nanoindentation test is the indentation depth parameters as shown in Figure 1. The depth attended by the indenter at maximum load during loading cycle is denoted by hmax which is a combination of contact depth (hc) and pile-up/sink-in height (hp) which are caused by the elastic property of the material. The hp can be positive in case of pile-up or negative in case of sink-in. Figure1 shows the example of sink-in as hp has negative value. Degree of pile-up or sink-in is measured by the ratio of hc/hmax[14]. Materials having low strain hardening exponent (n) shows elastic-perfectly plastic behaviour resulting into pile-up producing hc/hmax ratio greater than 1 [15,16]. On the other hand hc/hmax ratio is observed to be less than 1 for easily strain hardened material because of dominant elastic deformation during indentation [15]. In the final step i.e. unloading stage, the material loosens the indentation depth that eventually results into a permanent indentation depth, hf and loss in the depth is called as an elastic recovery represented by he in Figure 1.
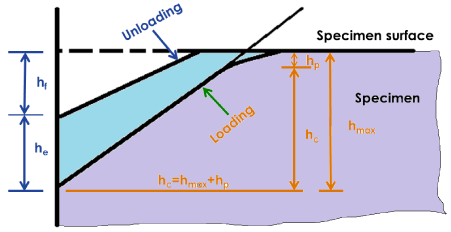
    Figure 1:  Specimen geometry of the nano-indentation test sample in loading
and unloading stage.
Metallic and non-metallic materials behave differently under indentation test. Various reports are available in literature studying mechanical properties of metals [13,15] and polymers [17,18]. In case of metals, there is no reported evidence of elastic modulus showing any apparent change due to strain hardening/work hardening. At the same time, a metal like copper would hardly show any viscoelasticity at room temperature. On the other hand, in polymeric materials complex viscoelastic–plastic behaviour is observed when micro and nano-indentations are produced. Also, a change in contact conditions such as maximum load, holding time and loading rate cause a change in H andErof metals as well as polymers [13,15,17,18]. Metals and ductile polymers have high strain and strain rate-dependent properties and show substantially different behaviours when the indentations are produced under differing contact conditions. So far, in literature, effect of test parameters on properties of metals and polymers have been studied separately under different conditions, hence correlating the response of these two different materials is usually not possible. Therefore, a new study was conducted in this work under same experimental conditions to investigate and compare the response of dissimilar materials (metals and polymers) in relation to properties such as H andEron changing nano-indentation test parameters.
Materials and Experiments
Three different materials, namely, copper (Cu), low density polyethylene (LDPE) and high density polyethylene reinforced with fly ash (HDPE + FA), were tested on Hysitron TI 900 nano-indentation in four different profiles as shown in Figure 2. All samples were polished using grade 1200 metallographic polishing paper, and each sample was tested under nano-indentation at 10 different locations under each set of conditions and average values were noted. Figure 2A shows a comparison at constant contact parameters whereas Figs. 2B, C and D show a comparison at varying maximum load, loading rate, and holding time respectively while keeping other parameters constant.
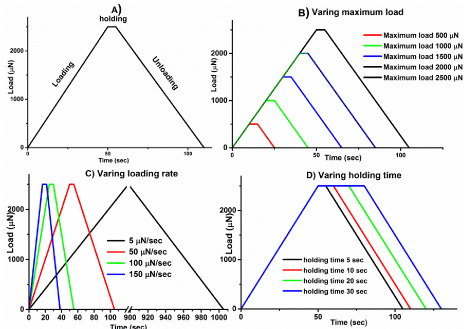
Figure 2: Nano-indentation test profiles for Cu, LDPE and HDPE + FA samples.
After loading-unloading cycle, test data was recorded to calculate H,Erand H/Er ² using equations 1 [19], 2 [19] and 3 [20] respectively:
In equations 1, 2 and 3, Pmax is maximum load and S is stiffness, measured as a slope of initial unloading curve which is normally considered as a perfect elastic event [21]. A is the contact area of the indentation and β is the correction factor for the indenter shape. For Berkovich indenter A=24. 5hc 2 [22] and β = 1.07 [3].
Analysis of Experimental Results and Discussion
Part A): Basic comparison
The three materials were subjected to preliminary nanoindentation test separately under maximum load of 2500 μN applied at the rate of 50 μN/sec and allowed to creep for 5 sec. All samples showed sink-in behaviour i.e. hc/hmax ratio was less than 1 and in accordance with the aforementioned fact [15,16], Cu which has low n value (i.e. work hardening coefficient value is 0.44) showed higher pile-up than the polymer and polymer composite samples for which n value is close to 1. Figure 3 shows pile-up values as a function of H/Er ² ratio (calculated from indentation heights from the same test result) which is the indication of materials’ resistance to plastic deformation [20]. It was observed that Cu falls relatively on the left side of H/Er2 axis showing highest pile-up/sink-in about 0.95, whereas, HDPE+FA falls on extreme right side on X axis, showing higher H/Er ² ratio with lower pile-up/sink-in value. LDPE is observed on X-axis between two samples but more close to HDPE+FA sample.
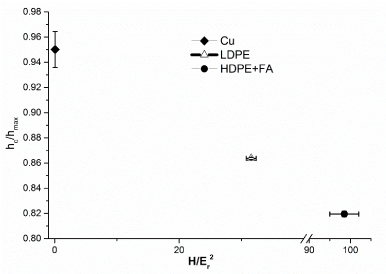
Figure 3: Normalised pile-up/sink-in height of Cu, LDPE and HDPE+FA.
Depending upon the fact that, material with high pile-up has smaller cutting efficiency [1] and low H/Er2 ratio has low wear rate (Q) [1], it can be stated that Cu, LDPE and HDPE+FA have wear rate and cutting efficiency in ascending and descending order respectively. In other words, Cu, LDPE and HDPE+FA represent hard, intermediate, and soft material respectively.
Part B): Varying maximum load
The behaviour of Cu, LDPE and HDPE+FA was studied at increasing load from 500 μN to 2500 μN keeping other parameters such as loading/unloading rate and holding time constant. The H/Er² and hc/hmax are plotted as a function of maximum load as shown in Figure 4. It was observed that with increasing maximum load, H andErwere decreased for all samples (Figure 5) resulting in changed H/Er ² ratio as shown in Figure 4A. Reduction in H andErwere also observed by Fang et al. for another ductile polymer polycarbonate [18]. But the change observed in this study in H/Er ² is not similar for all samples.
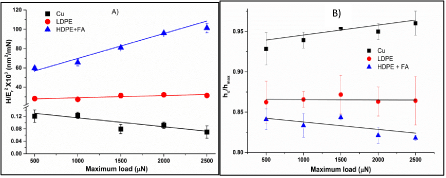
Figure 4: The effect of increasing maximum load on, A) rate of wear and B) hc/hmax ratio of Cu, LDPE and HDPE + Fly ash.
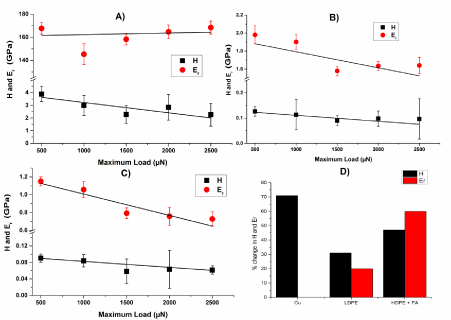
Figure 5: Behaviour of H and Er of A) Cu, B) LDPE and C) HDPE+FA; D) shows % change in H and Er of Cu, LDPE and HDPE+FA.
As the load was increased, wear rate decreased for Cu but increased for the HDPE+FA. Intermediate hard materials show a very small change in wear rate, this is probably because of the H andErchange independently as a function of maximum load (Figure 5), which creates a difference in the 3 materials based on their different individual modulus of elasticity (Cu having the highest and LDPE the lowest). In this study, for Cu, it was observed that, H was changing appreciably but notEr, which indicates a decrease in H/Er ² ratio. Same trend was observed in case of LDPE with very small/negligible change. On the other hand, rate of change ofErof HDPE+FA was higher than that of H resulting in lowered H/Er ² values due to increase in maximum load.
Figure 4B shows that increase in maximum applied load resulted in higher hc/hmax ratio for Cu whereas no appreciable change happened for LDPE whilst a decrease in hc/hmax for LDPE + FA was observed. This is attributed to the fact that, hc is a function of Young’s modulus (E) of the material [14] and hmax vitally depends on applied load. Hard materials with high Young’s modulus show high hc eventually resulting in high hc/hmax ratio at the same maximum load. Increase in maximum load resulted into higher indentation depth (both hc and hmax) in all the samples.
Due to increase in maximum load, the % increase observed in hc was higher than that of hmax in Cu, which results in increased hc/hmax ratio. On the other hand, for softer materials, (due to low Young’s modulus), increment in hc with respect to hmax is either nearly equal (for LDPE in the present case) or lower (for HDPE + FA) than that of hmax which ultimately gives constant or reduced hc/hmax respectively.
Part C): Influence of holding time
Figure 6 shows a comparative graph for creep values (creep value is measured as the distance travelled by the indenter during constant holding at maximum load) of three materials at different holding times at constant maximum load of 2500 μN and loading/unloading rate of 50 μN/sec. Hard material Cu, which shows low creep value is plotted on secondary Y axis in order to compare with high creep value materials LDPE and HDPE + FA on the same graph. As holding time was increased, creep values of all samples were increased. At the same time, it was observed that, over the same change in holding time, the material having lower work hardening exponent showed a lower increment in creep value as compared to that of having higher n value. After certain holding time Cu showed nearly constant creep value as hard materials get hardened at small holding time whereas HDPE + FA showed a gradual increase in creep value until it gets hardened (not observed in this study for 30 sec holding time). It is evident from Figure 6 that Cu reached its steady state at small holding time hence it shows nearly constant creep after 20 sec; on the other hand, LDPE and HDPE+fly ash do not achieve steady state in 20 sec and they show gradual increase in creep with time - in fact these two latter materials kept on showing creep even at 30 seconds - which presumably relates to their different morphology, crystalline structure and much lower modulus of elasticity as compared against copper’s.
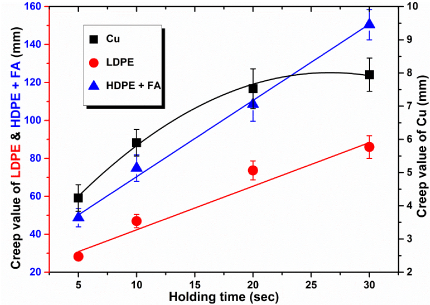
    Figure 6:  Comparison of creep values of Cu, LDPE and HDPE + FA over
different holding time.
Figures 7 and 8 show that although holding time affects creep value of the material, resistance to plastic deformation i.e. H/Er ² and cutting efficiency of the material i.e. hc/hmax[14] remain unchanged for all samples tested in this study. As can be seen in Figure 7A and Figure 8, H and Er of Cu were reduced when holding time was increased from 5 sec to 20 sec resulting into small jump in H/Er² at initial stage. This decrease in H and Er can be attributed to the increase in creep which ultimately results in high indentation depth. Above this holding time no appreciable change was observed in H and Er (also not in creep value in Figure 6) and Cu attained constant creep rate. This discussion supports the suggestion made by other researchers [13] to avoid the error in H and inErcalculations by selecting high holding time over short holding time.
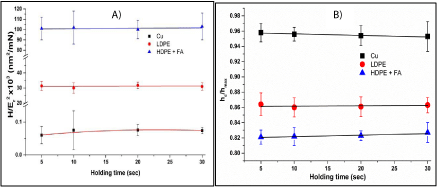
    Figure 7:  Effect of holding time on (A) H/Er
2 and (B) hc/hmax ratio.
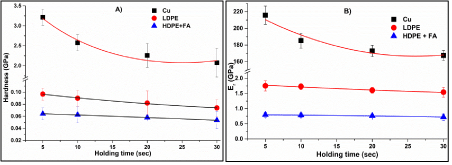
Figure 8: Change in (A) hardness (H) and (B) reduced modulus (Er) on varying holding time.
LDPE and HDPE+FA in this work having higher work hardening exponent showed linear (but negligible) change in H andEr(reducing) [1] resulting into constant creep rate and hc/hmax ratio, as observed by Mandal et al. [14].
Part D): Influence of loading rate
Figure 9 and 10 show test results at varying loading rate with constant maximum load (2500 μN) and holding time (5 sec). As shown in Figure 9A and 9B, loading rate also did not show any effect on wear rate and hc/hmax of all materials. However, a small change was observed in H andEras Fig. 10 indicates. Low loading rate allows more time for indenter to penetrate in the material surface resulting in higher indentation depth resulting in less H as well asEr. By contrast, increase in loading rate reduces the indentation time and produce higher hardness value. Another reason of high indentation depth at low loading rate as mentioned in the literature is a small amount of creep deformation that can be observed during loading period due to low strain rate and longer loading time to reach maximum load [23].
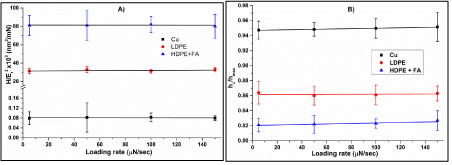
    Figure 9:  Effect of varying loading rate on (A) wear rate (H/Er
² and (B) hc/hmax of Cu, LDPE and HDPE+FA.
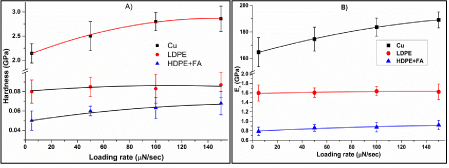
Figure 10: Effect of varying loading rate on (A) hardness and (B) reduced modulus of Cu, LDPE and HDPE+FA.
In addition to these fundamental determinations, different materials respond different ways depending upon the n value. In this study, the material Cu with low n value showed appreciable increase in H andEras loading rate increased but with no significant change in the creep rate, whilst materials with high n value (LDPE and HDPE+fly ash) showed slight increase in H andErwith constant creep rate. It is worth noting that in the literature similar behaviour was observed in other materials with similar or close n value, for example nickel surface with n = 0.38 [24] showed similar change in H andEr[13] as Cu (n= 0.44) [24]. Likewise polymer epoxy surface showed same behaviour as reported by Fu K, et al. [17] as observed in the present study for LDPE and HDPE + FA. Copper is a metal – it is strain-hard enable at strains above yield strain typically around 0.2 %. By contrast the yield strain of plastics are much higher, so it is believed the graphs in Figure 10 B are still in the pre-yielding region so the modulus is constant over that elastic deformation region.
Conclusion
The novelty of this project is as below: Copper is a metal believed to have small and equiaxed grains; LDPE is a combination of polymer crystals and amorphous region whereas the fly-ash-/HDPE composite is a new type of engineering bi-phase composite material. All the three materials are important from engineering application point of view and it is interesting they undergo different types of deformation under similar loading behavior.
The findings can be summarised as follows:
• Low work hardening exponent resulted in low wear rate and vice versa with respect to increasing maximum load. Other than maximum load, increase in holding time and loading rate did not affect the wear rate even though there was decrease in H and increase inErfor all materials.
• Cutting efficiency for all materials is affected by maximum load but not with any other test parameters. Further, it decreases for hard material (Cu) as hc/hmax increased and increased for soft materials (LDPE and HDPE+FA) as hc/hmax decreased.
• Creep values clearly increased with increased holding time. At the same holding time, material with low hardening exponent showed lower increment than the material with high hardening exponent.
Acknowledgement
The authors would like to thank the Head of School, UNSW Materials Science & Engineering for providing the nano-indentation testing facilities. Dr Ramakant Kumar thanks UNSW for granting him a visiting fellowship at UNSW SMSE.
References
- Pintaude G. Introduction of the Ratio of the Hardness to the Reduced Elastic Modulus for Abrasion. 2013.
- Oliver WC, Pharr GM. An improved technique for determining hardness and elastic modulus using load and displacement sensing indentation experiments. J Mater Res. 1992; 7: 1564-1583.
- Oliver WC, Pharr GM. Measurement of hardness and elastic modulus by instrumented indentation: Advances in understanding and refinements to methodology. J Mater Res. 2004; 19: 3-20.
- Saha DR, Mada MR, Datta A, Bandyopadhyay S, Chakravorty D. Nanoindentation measurements on nanostructured silver grown within a gel derived silica glass by electrodeposition. J Applied Physics. 2014. 115: 214308.
- Hajra P, Saha DR, Mada MR, Dutta S, Brahma P, Bandyopadhyay S, et al. High creep strain rates observed in nanocrystalline a-Fe2O3 particles by nanoindentation measurement. Mater Sci Engi A. 2014; 605: 1-7.
- Beake B. Modelling indentation creep of polymers: a phenomenological approach. J Physics D: Applied Physics. 2006; 39: 4478-4485.
- Fischer-Cripps AC. A simple phenomenological approach to nanoindentation creep. Mater Sci Engineering A. 2004; 385: 74-82.
- Ngan AHW, Tang B. Viscoelastic effects during unloading in depth-sensing indentation. J Mater Res. 2011; 17: 2604-2610.
- Marshall DB, Lawn BR, Evans AG. Elastic/Plastic Indentation Damage in Ceramics: The Lateral Crack System. J American Ceramic Society. 1982; 65: 561-566.
- Chen J. Indentation-based methods to assess fracture toughness for thin coatings. J Physics D: Applied Physics. 2012; 45: 203001.
- Fischer-Cripps AC. Nanoindentation Testing. 2011: 21-37.
- Fischer-Cripps AC. Time-dependent Nanoindentation. 2011: 125-145.
- Ma Z, Long S, Pan Y, Zhou Y. Creep behavior and its influence on the mechanics of electrodeposited nickel films. J Mater Sci Technol. 2009; 25: 90.
- Mandal S, Kose S, Frank A, Elmustafa AA. A numerical study on pile-up in nanoindentation creep. Int J Surface Sci Engineering. 2008; 2: 41.
- Kucharski S, Jarzabek D. Depth Dependence of Nanoindentation Pile-Up Patterns in Copper Single Crystals. Metallurgical and Materials Transactions A. 2014; 45: 4997-5008.
- Cheng YT, Cheng CM. Effects of 'sinking in' and 'piling up' on estimating the contact area under load in indentation. Philosophical Magazine Letters. 2010; 78: 115-120.
- Fu K, Chang Y, Tang Y, Zheng B. Effect of loading rate on the creep behaviour of epoxy resin insulators by nanoindentation. J Mate Sci: Mater Electron. 2014; 25: 3552-3558.
- Fang T-H, Chang W-J. Nanoindentation characteristics on polycarbonate polymer film. Microelectronics Journal. 2004; 35: 595-599.
- Mencík J. Determination of mechanical properties by instrumented indentation. Meccanica. 2006; 42: 19-29.
- Joslin DL, Oliver WC. A new method for analyzing data from continuous depth-sensing microindentation tests. J Mate Res. 2011; 5: 123-126.
- Bhushan B, Li X. Nanomechanical characterisation of solid surfaces and thin films. International Materials Reviews. 2003; 48: 125-164.
- Doerner MF, Nix WD. A method for interpreting the data from depth-sensing indentation instruments. J Mate Res. 1986; 1: 601-609.
- Yang S. Analysis of nanoindentation creep for polymeric materials. J Applied Physics. 2004; 95: 3655.
- Atlas of Stress-strain Curves. 2nd edn. ASM International. 2002.