
Research Article
Austin J Nanomed Nanotechnol. 2015; 3(1): 1041.
Carbon Based Coating on Steel with Improved Electrical Conductivity
Tong Y¹, Bohm S² and Song M¹*
¹Department of Materials, University of Loughborough, UK
²Tata Steel Research & Development, Surface Engineering Department, Advanced coating knowledge group, 9, Sir William Lyon Road, The University of Warwick Science Park, Coventry, CV4 7EZ, UK
*Corresponding author: Song M, Department of Materials, Loughborough University, Loughborough LE11 3TU, UK
Received: September 01, 2015; Accepted: October 29, 2015; Published: November 06, 2015
Abstract
Graphene and graphite were coated on steel plates by means of Electro Phoresis Deposition (EPD) for electrical conductivity improvement. Thermal treatment was used after EPD to improve the adhesion between the coating layer and the steel substrate. The highest value of the electrical conductivity achieved was 20 times higher than that of the steel substrate. The optimized EPD and thermal treatment conditions were identified. The coating-steel interface and surface structure suggested that good bonding between the coating and the steel substrate was achieved.
Keywords: Graphene; Nano-graphite; Conductive coating; Steel; EPD
Introduction
Steel, an alloy of iron and other elements, is a very important and widely applied material in industry. Various in composition and forms, steel have been applied in many different applications such as automotive shell, supporting column and tableware [1]. It is also an important material that is widely utilized in energy storage applications such as interconnect for Solid-Oxide Fuel Cells (SOFC) [2] and bipolar plate for proton exchange membrane fuel cells [3]. For energy storage applications, the electrical conductivity and corrosion resistance of the working environment of the major components are the essential properties. Although some types of steel have good electrical conductivity, their electrical conductivities are still not high enough and they do not possess excellent anti-corrosion properties for the long-term durability of the energy storage device. Hence, different coating systems have been adopted to improve the performance of the steel based components in energy storage applications. For example, polymer based coatings [4-7], multilayer coatings [8,9] and ceramic based coatings [2,10,11] were used as electrical conductivity and corrosion resistant enhancers on steel surface for energy storage applications. However, there is still a long way to go from small scale lab production to large scale commercialization although the improvement was promising. Therefore, seeking of new materials and new technologies are still crucial for the future development.
Graphene, a new era material, has many extraordinary properties such as high tensile strength [12], high electrical conductivity [12- 14] and barrier properties [15]. It is a very promising material to be utilized as coating to improve a wide range of properties no matter applied as composite or pristine form [16]. Electrophoresis Deposition (EPD) has been received increasing interest due to its simplicity and cost effectiveness. The graphene EPD based materials on steel have been adopted by researchers for various applications such as biocompatible materials [17] and transparent conductive materials [18]. Although all the reported results in the electrical conductivity were promising, only few papers mentioned the adhesion between graphene based materials and the substrates in the literature [19]. Pristine graphene is a pure carbon material and it does not form interactions with steel. Hence, the adhesion between steel and graphene is poor and the coated pristine graphene sheets on steel can be easily starched off after EPD. Without improved adhesion between pristine graphene and steel substrates, the graphene coating layer will not able to satisfy the requirements for long-term durable coating in energy storage applications.
In this paper, graphene and graphite were applied onto steel as conductive coating by means of Electrophoresis deposition (EPD). A simple method, thermal treatment was initially used to improve the adhesion between pristine graphene or graphite and steel substrates. The effects of EPD conditions and thermal treatment on the electrical conductivity were investigated. The composition and the morphology of the coating surface and the coating-steel interface were also assessed.
Experimental
Materials
Acetone (99.5% purity) and iodine were purchased from Sigma Aldrich. TIMREX PP10 natural graphite (PP10) was purchased from TIMCAL Ltd. Graphene was produced by mechanochemical method from expandable graphite in the lab [20]. The expandable graphite was purchased from China Qing Dao Graphite Company. The cold rolled steel ‘Black Plate’, which was used as substrates, was provided by TATA Steel R&D. The BP steel was a 0.2mm thick steel sheet initially and it was cut into 20mm by 50mm steel sheets.
Sample preparation
Expandable graphite was mixed with melamine in a volume ratio of 1:1. The mixture was dispensed into de-ionised water to make solution with a concentration of 1g/100ml. The solution was then heated up to and kept at 80oC for 1 hour with constant stirring, to allow the melamine to fully penetrate and expand the graphite layers. Thereafter, the solution was filtrated and dried at 80oC for 5 hours. The dried mixture then underwent ball-milling to exfoliate the graphite layers initially. The resulted mixture was dispersed in de-ionised water and ultrasonicated for further exfoliation for 1 hour (Fisher Scientific Sonic Dismembrator Model 500, 300 W). At last, hot water was used to repeatedly wash the mixture to remove the melamine. The obtained graphene was shown in Figures 1c & 1e.
Graphene or graphite was mixed with acetone to form a suspension. Iodine was then added into the suspension and stirred until fully dissolved. The resulted mixture was ultrasonicated for 30 minutes by using Fisher Scientific Sonic Dismembrator Model 500 at room temperature. The BP substrates were cleaned by acetone and then it was degreased in 5% alkaline solution at 70°C for 3 minutes. The distance between two electrodes was 10mm and a voltage of 40V was applied for 30 seconds initially. The DC source used in EPD was Consort EV265. EPD coated samples were thermal treated in a furnace (Carbolite RHF 16/8) with different temperatures for different length of times. Different EPD conditions were used as well to investigate the optimized EPD conditions for the best conductivity.
Characterizations
Carl Zeis (Leo) 1530VP Field Emission Gun Scanning Electron Microscope (FEG-SEM) and Thermo Scientific K-Alpha X-Ray Photoelectron Spectroscopy (XPS) were used to characterize the surface morphology and surface composition of the coated samples respectively. Transmission Electron Microscope (TEM), JEM- 2000FX electron microscopy manufactured by JEOL, was used to characterize the natural graphite PP10 and the graphene produced from expandable graphite. The graphite and graphene were ultrasonicated for 30 minutes in water before TEM characterization.
The electrical conductivity of the coated samples was measured by using a FLUKE PM6306 programmable automatic RCL meter with a four point probe. Relative electrical conductivity Cc/Cs was used show the electrical conductivity enhancement, where Cc represents the measured electrical conductivity of the coated samples and Cs represents the measured electrical conductivity of bare steel.
Results and Discussion
TEM images and diffraction pattern of PP10 graphite and the graphene fabricated from expandable Graphite (G) are shown in Figure 3.1. The sampling area of the x-ray diffraction of this TEM is in nano scale. Comparing Figures 3.1(a) and (c), PP10 has smaller amount of graphene sheets than G and the size of the graphene sheets are smaller as well. Figure 1(e) can further confirm that G has larger amount of graphene sheets with various layers and folding and their size are bigger. In addition, graphite nano flakes also present in the figure. In the literature, only electron diffraction patterns of graphene sheets with different layers were discussed [21,22]. However, x-ray diffraction pattern and electron diffraction pattern of a substance is similar. The schemes of the electron diffraction pattern of single layer and two layer graphene in literature were redrawn and shown in Figure 2. In a diffraction pattern, a triangle is formed around the centre bright spot. For the diffraction pattern of single layer graphene, the two spots in the middle of one side of the triangle have higher intensity than other two spots as indicated by the arrows in Figure 2a. For two layer graphene, the spots in the vertices of the triangle have higher intensity Figure 2b. The x-ray patterns shown in Figure 1 for single layer graphene are similar to the electron diffraction pattern in the literature. As a result, the existence of single layer graphene sheets in PP10 and G can be confirmed. Although G has more graphene sheets, the phenomenon of bigger graphene sheets cover smaller graphene sheets is more serious and this will lead to a ring x-ray diffraction pattern at the stacking site [21,22]. Figure 1f indicates that a couple of graphene sheets are stacking at the site. The x-ray pattern will start to grow to be a ring shape if more graphene sheets are stacking in an area.
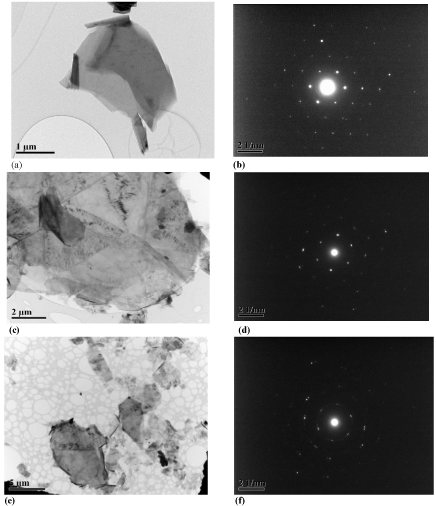
    Figure 1:  (a) TEM image of PP10; (b) X-ray diffraction pattern of the sheet in
(a); (c) TEM image of G; (d) X-ray diffraction pattern of the graphene sheet
in (c); (e) TEM image of G graphene with smaller magnification; (f) X-ray
diffraction of the stacking graphene sheets in (e).
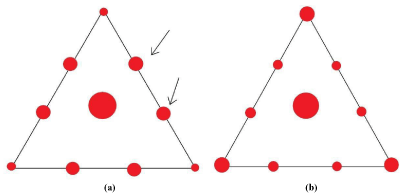
    Figure 2:  Schemes of nanoscale electron diffraction patterns of (a) a singlelayer
graphene membrane and (b) a two-layer membrane.
The SEM images of the samples after EPD are shown in Figure 3. From Figures 3a & 3b, there are pores in the coating layer between the graphite particles (red circle in Figures 3a & 3b and the pores are resulted from the escape of hydrogen gas. The particle movement carriers, hydrogen ions, are generated from the reaction between acetone and iodine. After moving the particles and let them deposited onto the substrate, the hydrogen ions recombined to form hydrogen gas and escaped from the system into the air. With lower voltage used, the particles in suspension moved slower and the EPD deposited layer was more porous because fewer particles deposited onto the steel surface in the same amount of time Figure 3b. When longer deposition time was adopted, a thick EPD deposited layer was produced and the whole steel surface was covered by the graphite particles. Comparing G coated Figure 3d and PP10 coated samples, their surface morphologies are distinctive and this is resulted from the morphologies of the two different particles used. The electrical conductivity of the EPD coated samples was difficult to measure because the coating layers were scratched off easily by the probe. Therefore, thermal treatment was carried out after EPD to improve the adhesion between the EPD coated layer and the steel substrate for electrical conductivity measurement.
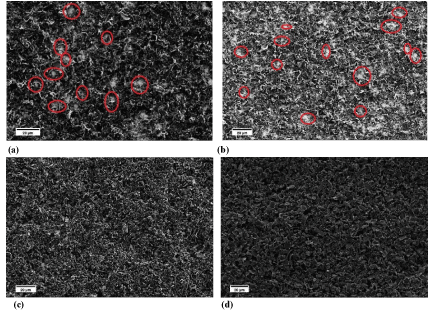
    Figure 3:  SEM images of the carbon based particles coated sample by
EPD; (a) The PP10 coated sample with initial EDP conditions; (b) The PP10
coated sample with lower voltage; (c) The PP 10 coated sample with longer
deposition time; (d) G coated sample with longer deposition time.
All the treated samples exhibit acceptable adhesion. The coating layer cannot be scratched off by tissue papers. The SEM images of some coated samples are shown in Figures 3 & 4 where black spots or areas represent the carbon based particles and the grey spots or areas represent the oxide scale layer. From Figure 4, the carbon based particles do not cover the whole surface of the steel substrate. There are two possible reasons for that. The first possible reason, as mentioned before, resulted from the diffusion of hydrogen gas out from the substrate surface to the air. Secondly, the oxide scale grew during thermal treatment process were around the carbon based particles and even fully buried the particles with small size (such as graphene and few layer graphene whose thicknesses are Nanoscale). Therefore, only large and thick particles can be seen in the SEM images. Comparing G coated and PP10 coated samples, their surface morphologies were quite similar. From Figures 4 (a-f), only a few carbon based particles could be bound if the thermal treatment temperature was low and most of the carbon based particles were buried by the thick oxide scale when high treatment temperature was used. The adhesion between carbon based particles and steel was improved after the thermal treatment because the iron oxides scale produced could lock the particles on the surface and the adhesion of the coating layer and the Steel/coating adhesion mainly depends on the adhesion between the oxide scale and the steel substrate. Figure 4g is the evidence for particles locked by iron oxides. In addition, from Figure 4g, the thickness of the oxide scale is not uniform and this might result from the thermal treatment process of the steel or the short treatment time did not allow the oxide scale layer to grow completely. The thickness of the oxide scale layer will be discussed later.
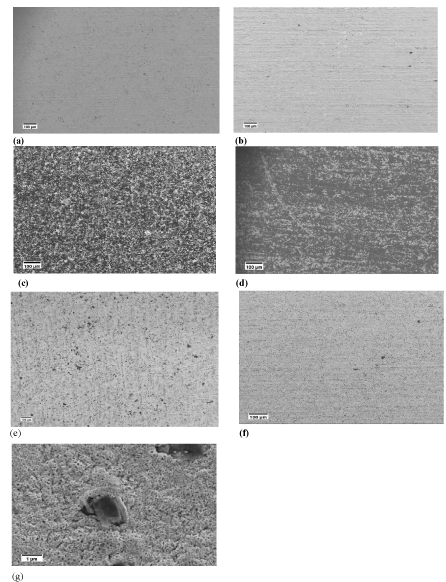
    Figure 4:  SEM image of the post heat treated samples (a) Graphene coated
540°C treated for 5 minutes (b) PP10 coated 540°C treated for 5 minutes (c)
Graphene coated 580°C treated for 5 minutes (d) PP10 coated 580°C treated
for 5 minutes (e) Graphene coated 600°C treated for 5 minutes (f) PP10
coated 600oC treated for 5 minutes (g) An iron oxide scale bound particle.
XPS results of graphite coated sample are shown in Figure 5 and Table 1. After comparing with the database, all existed compounds in the coating layer are identified. Comparing the binding energy values in Table 1 and the database, iron peak binding energy 711.99eV and 713.97eV represent the existence of hematite (Fe2O3) and iron peak binding energy 710.26 eV suggest the existence of magnetite (Fe3O4). For oxygen peak binding energy, 529.63 eV represents the existence of both hematite and magnetite and 531.63 eV peak binding energy represents the existence of hematite. As a result, iron oxides in the coating layer are identified as hematite and magnetite where hematite has much larger quantity. In terms of carbon peak binding energy, 284.7eV represents the carbon without reacting with other substances and 288.45eV may represent the existence of carbon compounds such as carbon dioxide or carbon monoxide. The existence of carbon compounds may result from environmental contamination and do not indicate that graphite was involved in any reactions during thermal treatment. The analysis depth of XPS is limited. The coating layer may consist of several layers that contain different iron oxides and XPS can only analyse the outermost surface. In Figure 6, the surface structure of the oxide scale is similar to the hematite structure shown in literature [23]. This can also be the evident of the existence of hematite in the surface of graphite coated samples and hematite is also the major component of the outermost oxide scale. In addition, the oxide scale layer is likely to be a thin hematite layer in the outermost surface with a magnetite layer underneath [24].
    Name
    Fe2p3    Scan A
    Fe2p3    Scan B
    Fe2p3    Scan C
    O1s Scan    A
    O1s Scan    B
    C1s Scan    A
    C1s Scan    B
    C1s Scan    C


    Peak    Binding Energy
    710.26
    711.99
    713.97
    529.83
    531.63
    285.27
    288.45
    284.7


    Atomic %
    4.52
    2.72
    1.3
    20.83
    9.59
    28.97
    3.34
    28.73
Table 1: XPS data of graphite coated sample treated at 580oC for 5 minutes.
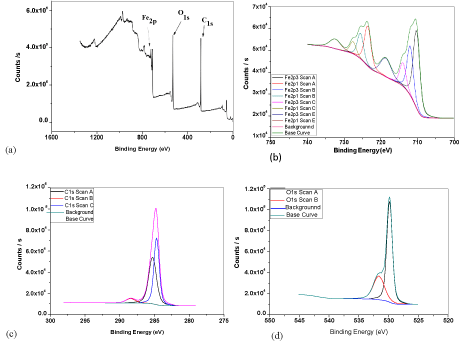
    Figure 5:  XPS spectrum of graphite coated sample treated at 580°C for 5
minutes (a) survey scan (b) Iron element high resolution scan (c) Carbon
element high resolution scan (d) Oxygen element high resolution scan.
The porosity formed in the oxides scale layer is mainly resulted from the growth stresses and resultant deformation and grain growth. The micro-voids are also formed within the oxide scale layer as a result of the inward diffusion of oxygen and outward diffusion of metal take place during oxidation [25]. In addition, with the contribution of hematite formation, a porous coating layer is highly possible to appear Figure 6.When hematite interacted with each other, it was easy to form porous coating layer. With the oxygen and metal took place, pores and micro-voids were formed in the oxide scale layer. The formation of micro-voids mainly took place in underneath magnetite layer. Magnetite layer consists of a fine-grain layer at the inner region and a coarser columnar-grain layer at the outer region. Voids are formed at the scale-iron interface and subsequent void migration takes place along grain boundaries. Therefore, voids appear in the coating layer and the porous structure is resulted [26,27].
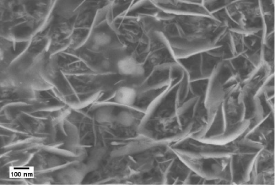
    Figure 6:  SEM image of graphite coated sample to review its surface
structure.
The structure of the interfaces of high temperature treated sample is clearer because the scale layer is thicker and more fully developed. The steel-coating interface was observed clearest in the graphite coated sample heat treated at 6300C for 5 minutes Figure 7. From Figure 7a, the scale layer has two layers and the top layer is porous, which is hematite layer. The two layers are separated by a red line. This is the same as the theory mentioned above that the scale layer has a hematite top layer followed by a continuous magnetite layer [24]. But the wustite layer could not be observed clearly. Additionally, large columnar grains can be observed in the scale interphase. Grain boundaries are also visualized in Figure 7a. Micro-voids were formed during the thermal treatment in the areas labelled by red circles in the figure. The actual carbon based particles binding layer is hematite layer because the generated magnetite layer is dense and is not able to bind any carbon based particles [28,29]. As a result, no matter how thick the EPD deposited layer is, only the innermost layer of EPD deposited carbon based particles can be bound during thermal treatment process. Figure 7b shows the steel-coating interphase of the graphene coated sample which was treated at same condition as the graphite coated sample. Their steel-coating interfaces are similar and this indicates that the presence of different carbon based particles do not have a fundamental effect on the oxidation process of steel.
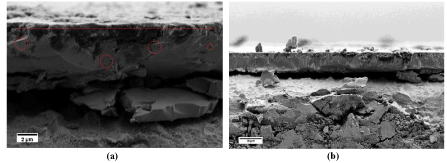
    Figure 7:  SEM image of the steel-coating interface of (a) graphite coated
sample treated at 630 for 5minutes (b) graphene coated sample treated at
630 for 5 minutes.
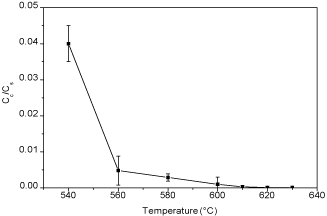
    Figure 8:  Plot of relative conductivity versus thermal treatment temperatures
of the oxide layers on BP steel.
After taking out the samples from the furnace, all the samples were cleaned by tissue papers to wipe out any particles that not adhere onto the steel substrates. Figure 8 shows the relative conductivity of BP steel treated in different temperatures for five minutes. After heat treatment, the conductivity of the steel surface was reduced significantly compared to bare steel substrate. Figures 9 & 10 show the trend of the electrical conductivity versus treatment temperature. If the value of relative conductivity equals to 1, this means that the conductivity of the coated samples is the same as the steel substrate. From Figure 9, the peak relative conductivity was achieved when the coating samples was thermal treated at 580°C. The relative conductivity of the coated samples does not change at 520°C and 540°C and, then, it begins to rise to its peak value at 580°C, after which it begin to fall. Another smaller peak value appears at 610°C. However, considering the standard deviation, the relative conductivity at 610°C may be an inaccurate value. If so, there is only one peak relative conductivity value which appears at 580°C. Compared to graphite coated samples, the graphene coated samples have less serious change of relative conductivity and their relative conductivity values do not have a very high value which range from 1 to 2.5. The relative conductivity drops significantly when thermal treatment temperature is higher than 610°C. Again, when considering the standard deviation, the relative conductivity values from 520°C to 610°C may only vary a little and this can indicates that a more stable conductivity value is exhibited with the presence of graphene. 580°C seems to be the best treatment temperature for both graphite coated samples and graphene coated samples. Compared to the relative conductivity of Figures 8-10, the presence of carbon based particles can improve the conductivity of oxide layer on steel substrate.
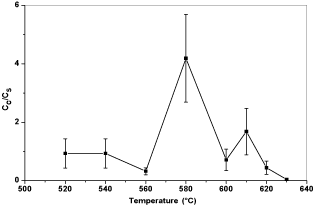
    Figure 9:  Plot of relative conductivity versus thermal treatment temperatures
of graphite coated samples.
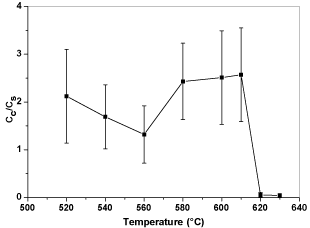
    Figure 10:  Plot of relative conductivity versus thermal treatment temperatures
of graphene coated samples.
The resistance of the coating layer is mainly contributed from the tunneling resistance between particles and the contact resistance between the probe and the coating when current pass through. The tunneling resistant is much greater than contact resistant [30]. With higher thermal treatment temperature was used, the hematite layer grew thicker and buried more thin and small particles. Hence, large and thick particles contributed more as the electrical conducted component. When the oxide scale buried more particles, the tunneling resistant increased when current passed through the coating layer during four point probe test and, therefore, electrical conductivity of the coating layer was reduced. In the case of graphene coated samples, from the SEM images, the residual graphite and exfoliated graphite were the major electrical conducted component. Although the graphene has more few layers graphene sheets and single layer graphene sheets than PP10, the contact resistant generated between carbon-carbon contact and carbon-iron oxides contact in the graphene coated sample is much greater than PP10 coated sample. In PP10 coated samples, the presence of few layers graphene can act as a bridge to fill the gap between two large particles so as to reduce the tunneling resistance [31].
Figure 11 shows the trend of relative conductivity varies with prolonged treatment time. The relative conductivity values of the graphite coated samples drop significantly with prolonged thermal treatment time. As the samples were treated in the furnace longer, the tunneling resistant increased significantly and led to reduced electrical conductivity. However, under a certain temperature, carbon based particle cannot be bound onto the steel substrate with inadequate time. For example, if the sample is treated at 520°C, the thermal treatment time should be longer than 5 minutes to bind the carbon based particles.
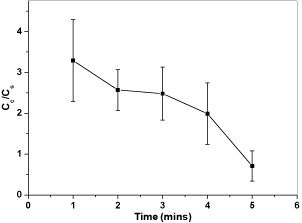
    Figure 11:  Plot of relative conductivity versus thermal treatment times of
graphite coated samples at 600°C.
Figure 12 shows the plots of the relative conductivity versus iodine concentration in acetone. The electrical conductivity of coated samples decreases with higher iodine concentration. Iodine concentration in suspension relates to the deposition speed of particle directly and it can affect the packing behaviour of the coating layer. When the same voltage is applied, higher iodine concentration means high as-generated current. Higher current may cause turbulent in the suspension and the coating layer may be disturbed during its deposition. Hence, lower iodine concentration is beneficial to produce a coating layer with good quality. The thickness of as-deposited coating layer also increases with the increase of iodine concentration in suspension. However, if the iodine concentration is too low, the particles movement in the suspension cannot be activated and a coating layer is not able to be formed from the particles.
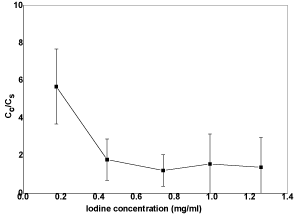
Figure 12: Plot of electrical conductivity ratios versus iodine concentrations.
As shown in Figure 13, 1 minute deposition time seems to be the best deposition time for the system to achieve a coating layer with good conductivity. With prolonged deposition time, the thickness of EPD coating layer increases. The deposition rate will be decreased with prolonged deposition time because the coating layer generated may act as insulating layer, especially for ceramic particles. The particles in the suspension need enough deposition time to cover the whole area of the steel substrate and the deposited mass on a substrate has a linear relationship with deposition time [32]. The variation in the electrical conductivity of the coated samples may relate to the deposition pattern of the carbon based particle on the steel substrate. As the hydrogen ions escaped in the form of hydrogen gas, prolonged deposition time may lead to increased porosity of the EPD coating layer. Therefore, the tunneling resistant of the coating layer is increased.
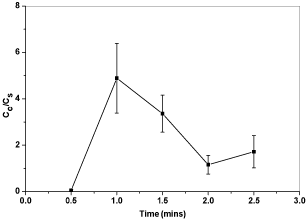
Figure 13: Plot of electrical conductivity ratios versus deposition times.
From the results of electrical conductivity ratios versus voltages in Figure 14, a conclusion can be drawn that 20V and 40 V both can produce coated samples with higher electrical conductivity. High voltage may cause turbulence that affects the morphology of the coating layer. However, from the result of voltage variation, the influence of turbulent raised by high voltage might be overcame if the particles can deposit onto the substrate fast enough because particles under high voltage also move faster than low voltage. Another possible reason is that, due to the turbulence caused by high voltage, the quality of the coating is irregular and cannot be controlled.
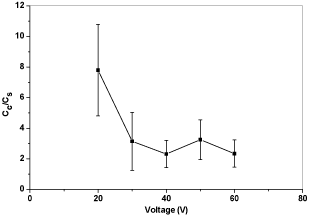
Figure 14: Plot of electrical conductivity ratios versus voltages.
The change of the electrical conductivity of the coating layer mainly contributes to the change of tunneling resistant and contact resistance between electrical conducted components (carbon based particles). The tunneling resistance will be reduced significantly if more graphite or graphene particles cover the surface and they are near each other. As a result, a fine control of oxide scale layer growth and EPD process to produce a surface fully covered by graphite or graphene particles is important to the electrical conductivity of the coated samples.
Conclusion
EPD deposited PP10 and the graphene were successfully bound onto ‘Black Plate’ steel with the aid of thermal treatment. The electrical conductivity of the steel was improved significantly with improved EPD and thermal treatment conditions. The best electrical conductivity of the coated steel is 10 times higher than that of the steel substrate. The best thermal temperature is about 580°C and the best thermal treatment time is about five minutes. The optimum EPD conditions are 0.175 mg/ml iodine concentration, 20 or 40V EPD voltage and 1 minute deposition time. During the thermal treatment at this temperature and time, a thin oxide scale consists of a hematite thin layer and a continuous magnetite thick layer was formed. The hematite layer was the layer that bound the carbon based particles onto steel substrate. Although the electrical conductivity of the coating is good, the porosity of the coating layer is not evitable as a result from the thermal treatment process.
Acknowledgement
We thank TATA Steel R&D and the PhD scholarship of Loughborough University for providing funding for this work.
References
- Honeycombe RWK, Bhadeshia HKDH. Steels?: microstructure and properties. 2nd edn. London? Edward Arnold. 1995.
- Chevalier S, Caboche G, Przybylski K, Brylewski T. Effect of nano-layered ceramic coatings on the electrical conductivity of oxide scale grown on ferritic steels. J Appl Electrochem. 2008; 39: 529-534.
- Zhang D, Duan L, Guo L, Tuan WH. Corrosion behavior of TiN-coated stainless steel as bipolar plate for proton exchange membrane fuel cell. Int J Hydrogen Energy. 2010; 35: 3721-3726.
- Bonastre J, Garcés P, Galván JC, Cases F. Characterisation and corrosion studies of steel electrodes covered by polypyrrole/phosphotungstate using Electrochemical Impedance Spectroscopy. Prog Org Coatings. 2009; 66: 235-241.
- Show Y, Nakashima T, Fukami Y. Anticorrosion Coating of Carbon Nanotube / Polytetrafluoroethylene Composite Film on the Stainless Steel Bipolar Plate for Proton Exchange Membrane Fuel Cells. J Nanomater. 2013; 1-7.
- Lee YB, Lim DS. Electrical and corrosion properties of stainless steel bipolar plates coated with a conduction polymer composite. Curr Appl Phys. 2010; 10: 18-21.
- Wang Y, Northwood DO. An investigation into polypyrrole-coated 316L stainless steel as a bipolar plate material for PEM fuel cells. J Power Sources. 2006; 163: 500-508.
- Gannon PE, Tripp CT, Knospe AK, Ramana CV, Deibert M, Smith RJ, et al. High-temperature oxidation resistance and surface electrical conductivity of stainless steels with filtered arc Cr–Al–N multilayer and/or superlattice coatings. Surf Coatings Technol. 2004; 188: 55-61.
- Ho WY, Pan H, Chang CL, Wang DY, Hwang JJ. Corrosion and electrical properties of multi-layered coatings on stainless steel for PEMFC bipolar plate applications. Surf Coatings Technol. 2007; 202: 1297-1301.
- Wei P, Deng X, Bateni MR, Petric A. Oxidation Behaviour and Conductivity of UNS 430 Stainless Steel and Crofer 22 APU with Spinel Coatings. ECS Trans. 2007; 7: 2135-2143.
- Rashtchi H, Sani MAF, Dayaghi AM. Effect of Sr and Ca dopants on oxidation and electrical properties of lanthanum chromite-coated AISI 430 stainless steel for solid oxide fuel cell interconnect application. Ceram Int. 2013; 39: 8123-8131.
- Singh V, Joung D, Zhai L, Das S, Khondaker SI, Seal S. Graphene based materials: Past, present and future. Prog Mater Sci. 2011; 56: 1178-1271.
- Lee C, Wei X, Kysar JW, Hone J. Measurement of the elastic properties and intrinsic strength of monolayer graphene. Science. 2008; 321: 385-388.
- Lee C, Wei X, Li Q, Carpick R, Kysar JW, Hone J. Elastic and frictional properties of graphene. Phys Status Solidi. 2009; 246: 2562-2567.
- Kirkland NT, Schiller T, Medhekar N, Birbilis N. Exploring graphene as a corrosion protection barrier. Corros Sci. 2012; 56: 1-4.
- Ferrari AC, Bonaccorso F, Fal’ko V, Novoselov KS, Roche S, Bøggild P, et al. Science and technology roadmap for graphene, related two-dimensional crystals, and hybrid systems. Nanoscale. 2015; 7: 4598-4810.
- Akhavan O, Ghaderi E. Toxicity of graphene and graphene oxide nanowalls against bacteria. ACS Nano. 2010; 4: 5731-5736.
- Ishikawa R, Ko PJ, Kurokawa Y, Konagai M, Sandhu A. Electrophoretic deposition of high quality transparent conductive graphene films on insulating glass substrates. J Phys Conf Ser. 2012; 352: 012003.
- Chavez-Valdez A, Shaffer MS, Boccaccini AR. Applications of graphene electrophoretic deposition. A review. J Phys Chem B. 2013; 117: 1502-1515.
- Zhao W, Fang M, Wu F, Wu H, Wang L, Chen G. Preparation of graphene by exfoliation of graphite using wet ball milling. J Mater Chem. 2010; 20: 5817-5819.
- Meyer JC, Geim AK, Katsnelson MI, Novoselov KS, Obergfell D, Roth S, et al. On the roughness of single- and bi-layer graphene membranes. Solid State Commun. 2007; 143: 101-109.
- Meyer JC, Geim AK, Katsnelson MI, Novoselov KS, Booth TJ, Roth S. The structure of suspended graphene sheets. Nature. 2007; 446: 60-63.
- Definition: Hematite. Webster’s Online Dict. 2013.
- Leslie WC. The Physical Metallurgy of Steels. Hemisphere Publ. Washington. 1981.
- Kofstad P. On the formation of porosity and micro channels in growing scales. Oxid Met. 1985; 24: 265-276.
- Atkinson A. Transport processes during the growth of oxide films at elevated temperature. Rev Mod Phys. 1985; 57: 437-470.
- Tylecote RF, Mitchell TE. Marker movements in the oxidation of iron and some other metals. J Iron Steel Inst. 1960; 196: 445-453.
- Qiu H, Hu X, Chen S, Fang F. Study on Growth of Oxide Scale on High Carbon Steel at High Temperature. Appl Mech Mater. 2012; 149: 34-37.
- Chen RY, Yuen WYD. Review of the High-Temperature Oxidation of Iron and Carbon Steels in Air or Oxygen. Oxid Met. 2003; 59: 433-468.
- Sun X, Song M. Highly Conductive Carbon Nanotube/Polymer Nanocomposites Achievable? Macromol Theory Simulations. 2009; 18: 155- 161.
- Jin J, Lin Y, Song M, Gui C, Leesirisan S. Enhancing the electrical conductivity of polymer composites. Eur Polym J. 2013; 49: 1066-1072.
- Besra L, Liu M. A review on fundamentals and applications of electrophoretic deposition (EPD). Prog Mater Sci. 2007; 52: 1-61.