
Research Article
Austin J Nephrol Hypertens. 2015; 2(5): 1050.
Assessment of Interferon Gamma and Interleukin-10 m-RNA Expression in Peripheral Blood From Renal Transplanted Patients with Chronic Allograft Nephropathy by Real Time Polymerase Chain Reaction
Attia FM¹*, Kheder E², Khalil KA³, Tawfik GA², Omar W² and Anani M¹
¹Department of Clinical Pathology, Suez Canal University, Egypt
²Department of Clinical Nephrology, Suez Canal University, Egypt
³Department of Clinical Internal Medicine, Suez Canal University, Egypt
*Corresponding author: Fadia M Attia, Department of Clinical Pathology, Suez Canal University, Egypt
Received: July 08, 2015; Accepted: November 10, 2015; Published: November 15, 2015
Abstract
Background: The current study was performed to investigate the potential biomarkers of IFN-γ and IL-10 that can be used to detect Chronic Allograft Nephropathy.
Methods: Among 52 patients with End-Stage Renal Disease (ESRD) who had renal transplantation and were followed up in Ismailia University Hospital. Twenty six patients with Chronic Allograft Nephropathy and 26 (non-rejector) patients were recruited into the study. Serum gamma interferon and interleukin -10 were measured in all patients with the calculation of interferon gamma / interleukin-10 ratios. We used multivariate analysis, regression analysis and the Receiver Operating Characteristic (ROC) curve in our statistics.
Results: According to ROC curve analysis of the RT-PCR of IFN-γ and IL- 10; we were able to distinguish non-rejection and Chronic Allograft Nephropathy with optimal cutoff point of IFN-γ (=6.9) and a specificity of 96.2%. The optimal cutoff point of IL-10 was (=0.4) with a specificity of 92.3. Our investigation further revealed that IL-10 and IFN-γ were significantly elevated in patients with Chronic Allograft Nephropathy with high AUC values compared to non- rejectors.
Conclusion: In conclusion we found that IFN-γ, IL-10 and IFN-γ/IL-10 ratio might provide useful surrogate markers for renal transplant outcome. In kidney transplant patients with renal rejection, the presence of cytokines reflects renal damage and could be a useful method in the diagnosis of renal rejection.
Keywords: IFN-γ; IL-10; Renal transplantation; Chronic Allograft Nephropathy (CAN)
Introduction
Kidney transplantation offers an improved quality of life and overall survival rates to patients with stage 5 chronic kidney disease and ESRD, offering improved quality of life and overall survival rates [1]. Despite advances in immunosuppressant techniques, mechanisms of late graft injury are incompletely understood. Identifying biomarkers capable of defining patients into those at high versus low risk for developing late kidney allograft failure is becoming an important issue [2]. Interleukin10 (IL10) is an anti-inflammatory cytokine and an immunosuppressor cytokine, it inhibits the tumor necrosis factor-alpha (TNF-a) [3]. The interferon gamma (IFN-γ) has been associated with human immunological diseases, such as kidney transplant rejection [4].
In renal transplantation, the use of immunosuppressive drugs is associated with nephrotoxicity, infections, cardiovascular problems and malignancies. The possibility to use in vitro tools to predict which renal transplant patients are at risk for rejection and whom are predisposed to tolerance is becoming an important issue [5]. Antibodies play an important role in hyper acute rejection and in chronic rejection [6], Donor reactive T cells are the central mediators of both acute and chronic rejection [7]. IFN-γ was related to acute and chronic rejection and graft failure [8]. In lung transplant patients, IL-10 producing CD4+ cells was higher in patients with stable graft conditions than in healthy controls and the number of IL-10 producing cells was significantly lower in lung transplant patients with bronchiolitis obliterans syndrome than in stable patients [9]. Rejection can be classified according to duration: hyper acute occurring within minutes, acute occurring within days to weeks, and late acute occurring after 3 months and chronic occurring months to years after transplantation [10]. Chronic rejection which is characterized by a slow loss of function with proteinuria and hypertension is considered the most prevalent cause of renal transplant failure [10]. Slow and variable decline in renal function after three months post-transplant, often in combination with proteinuria and aggravation or appearance of hypertension is characteristic of chronic allograft nephropathy [11].
In this study, we determined if levels of IFN-γ, IL-10 mRNA transcripts expression in peripheral blood leukocytes” and IFN-γ/IL- 10 mRNA transcripts ratio, can be used as non-invasive test in renal transplanted patients with Chronic allograft nephropathy versus patients with stable graft.
Patients and Methods
This study was a cross sectional study in Ismailia region. Patients were selected according to the following inclusion criteria: all patients with ESRD who have been transplanted in the previous 10 years and are followed up in Ismailia region.
Twenty six patients with chronic allograft nephropathy and 26 patients without rejection (stable graft) were recruited into the study from Nephrology Unit of Kaser-Ainy, Naser Academy and Health Insurance Hospitals. All patients were subjected to full medical history including: demographic data: sex, age, occupation, (smoking history), full history of transplantation procedure, abdominal ultra sonography, sonography of the transplanted kidneys, doppler of the renal arteries of the transplanted kidneys to measure the Resistive index, other indices and laboratory investigations including the following; Kidney function tests; creatinine and BUN; complete blood Picture; IL10 and interferon gamma mRNA transcripts expression by real time PCR using Taqman technique were measured. First of all RNA was extracted from peripheral blood leucocytes of EDTA anticoagulated blood using commercially available Spin-column technique Kit for RNA extraction (QI amp RNA Blood Mini Kit, Qigong, Germany). CtDNA was obtained by using Quantities Reverse Transcription Kit, Qigong, Germany. Amplification of interferon gamma and IL10 were done by using Taqman technique. The realtime PCR reaction was carried out according to the manufacturer’s protocol. The threshold cycles (CT), at which an increase in reporter fluorescence above the baseline signal was first detected. GAPDH was used as endogenous control and for normalization (ΔCT) of the mRNA levels for interferon gamma and /or IL-10 assay. GAPDH was subtracted from respective either interferon gamma or IL-10 giving the ΔCT as a relative mRNA expression of IL10 or interferon gamma. The calculations of relative IL10 and /or interferon gamma expression were done using the formula 2-ΔΔCT.
Results
This study was designed to determine the ratio IFN-γ and IL- 10 mRNA transcripts levels as non-invasive diagnostic tool in renal transplanted patients with chronic allograft nephropathy versus patients with no rejection. Twenty six patients with chronic allograft nephropathy and 26 patients’ non-rejectors were recruited into the study (Table 1). The mean age of the rejector group was 38.6±12.4 years, while the mean age of the non-rejector group was 38.4±8.1 years. The frequency of males in the rejector group was significantly higher than the non-rejector group. There were insignificant differences between both groups regarding duration of grafting and type of graft donor (p>0.05) (Table 1). There were no significant differences between both groups regarding frequency of previous CMV infection, mean serum creatinine and mean serum albumin. All rejector patients had proteinuria (100%) (Table 2). (Table 3) and (Figure 1) shows the renal artery duplex characteristics of the studied groups. There was significantly higher mean values of resistive index in patients with rejection compared with non-rejectors (p <0.0001). (Table 4) and (Figure 2) show the results of biomarkers of the studied groups. The IFN-γ mRNA transcripts levels were significantly higher in patients with rejection than in patients with non-rejection (p <0.0001). The IL-10 mRNA transcripts were significantly higher in patients with chronic rejection than in non-rejector patients (p <0.0001) (Figure 2) and (Figure 3). There was significantly higher ratio of IFN-γ/IL-10 in patients with rejection compared with patients with non-rejection (p<0.05). The significant predictors of Chronic allograft nephropathy were male gender (OR=4.4, p= 0.024), IFN-γ (>6.9) (OR=21.4, p= 0.001), IL-10 (=0.4) (OR=19.2, p= 0.0002), IFN-γ/IL-10 ratio (>7.5) (OR=3.6, p= 0.027) (Table 5). The bivariate analysis model of the correlation between Chronic allograft nephropathy and IFN-γ, IL- 10 and IFN-γ/IL-10 ratio showed significant correlations between Chronic allograft nephropathy and higher IFN-γ, higher IL-10 and higher IFN-γ/IL-10 ratio (p-value<0.05) (Table 6). (Table 7) shows the multivariate step-wise backward regression analysis model for best fitting significant predictors of Chronic allograft nephropathy. The best fitting significant predictors were gender, resistive index and IFN- γ (p <0.01). (Figure 4) shows the (ROC) curve for the detection of chronic allograft nephropathy using IFN-γ/IL-10 ratio. Cutoff values and coordinates of the (ROC) curve for the detection of chronic allograft nephropathy using IFN-γ/IL-10ratio are shown in (Table 8). (Figure 5) and (Figure 6) shows the (ROC) curve for the detection of Chronic allograft nephropathy using IFN-γ and IL-10 respectively.
    Variables
    Non-rejectors (n=26)
    Rejectors (n=26)
    Used test
    P-value


    Age (years):


    Mean ±SD
    38.4±8.1
    38.6±12.4
    t=0.07
    0.95


    Range
    25-54
    22-68


    Gender:


    Male
    11 (42.3%)
    20 (76.9%)
    ?2Y=5.1
    0.024*


    Female
    15 (57.7%)
    6 (23.1%)


    Transplantation year
    2002-2010
    2001-2010
    -
    -


    Duration (years):


    Mean ±SD
    5.54±1.94
    5.92±2.42
    t=0.01
    0.99


    Range
    3-10
    2-11


    Donor:


    LURD
    22 (84.6%)
    23 (88.5%)
    Fisher exact
    0.99


    LRD
    4 (15.4%)
    3 (11.5%)


    Biopsy:


    CAN
    2 (84.6%)
    26 (100.0%)
    ?2Y=40.9
    <0.0001**


    Normal
    24 (15.4%)
    0 (0.0%)


    *Significant    p-value <0.05, **highly significant p-value <0.01, living    un-related-donor (LURD), living related-donor (LRD), unpaired t-test (t), Chronic    Allograft Nephropathy (CAN) chi-square with    Yates correction (?2Y).
Table 1: Baseline characteristics of the studied groups.
    7
    Non-rejectors (n=26)
    Rejectors(n=26)
    Used test
    P-value


    CMV previous infection:


    Negative
    10 (38.5%)
    9 (34.6%)
    ?2P=0.08
    0.78


    Positive
    16 (61.5%)
    17 (65.4%)


    Serum creatinine (mg/dl)


    Mean ±SD
    0.94±0.17
    3.04±1.4
    t=0.01
    0.99


    Serum albumin (mg/dl)


    Mean ±SD
    3.8±0.23
    2.8±0.25
    t=0.01
    0.99


      Protein in urine:


    Negative
    26 (100.0%)
    0 (0.0%)
    ?2Y=48.1
    <0.0001*


    Positive
    0 (0.0%)
    26 (100.0%)


    *Significant    p-value <0.05, **highly significant p-value <0.01,    Cytomegalovirus (CMV), unpaired t-test (t), Pearson chi-square test (?2P), chi-square with Yates correction (?2Y).
Table 2: Laboratory characteristics of the studied groups.
    Variables
    Non-rejectors (n=26)
    Rejectors (n=26)
    Used test
    P-value


    Resistive index


    Mean ±SD
    0.62±0.079
    0.85±0.016
    t=14.5
    <0.0001**


    Range
    0.53-0.76
    0.80-0.87


    *Significant    p-value <0.05, **highly significant p-value <0.01, unpaired    t-test (t).
Table 3: Renal artery duplex characteristics of the studied groups.
    Variables
    Non-rejectors (n=26)
    Rejectors (n=26)
    Used test
    P-value


    IFN-γ mRNA transcripts


      Mean ±SD
    4.2±1.9
    24.4±13.2
    t=7.7
    <0.0001**


    Range
    1.2-9.2
    2.8-70.6


    IL-10 mRNA transcripts


    Mean ±SD
    0.55±0.43
    4.4±3.31
    t=8.0
    <0.0001**


    Range
    0.2-1.8
    0.2-35


    IFN-γ/IL-10 ratio


    Mean ±SD
    11.3±8.2
    15±2.9
    t=2.2
    0.035*


    Range
    1.7-38.5
    0.1-100


    *Significant    p-value <0.05, **highly significant p-value <0.01, unpaired    t-test (t).
Table 4: Results of biomarkers of the studied groups.
    Variables
    Non-rejectors (n=26)
    Rejectors (n=26)
    OR
    95% CI
    p-value


    Male gender
    11 (42.3%)
    20 (76.9%)
    4.4
    1.4-15.1
    0.024*


    LURD
    22 (84.6%)
    23 (88.5%)
    1.4
    0.28-6.95
    0.99


    Positive CMV infection
    10 (38.5%)
    9 (34.6%)
    0.85
    0.27-2.6
    0.79


    IFN-γ mRNA transcripts(>6.9)
    1 (3.8%)
    12 (46.2%)
    21.4
    2.5-182.7
    0.001**


    IL-10 mRNA transcripts(=0.4)
    2 (7.7%)
    16 (61.5%)
    19.2
    3.7-99.4
    0.0002**


    IFN-γ/IL-10ratio (>7.5)
    9 (34.6%)
    17 (65.4%)
    3.6
    1.1-11.1
    0.027*


    **Highly    significant p-value <0.01, odds ratio (OR), confidence interval (CI),    R2 = 0.971 (Adjusted R2 = 0.963).
Table 5:  Univariate analysis model for significant predictors of chronic allograft
nephropathy.
    Variables
    Correlation coefficient (r-value)
    p-value (2-tailed)


    IFN-γmRNA    transcripts
    0.488
    <0.0001**


    IL-10mRNA    transcripts
    0.357
    0.009**


    IFN-γ/IL-10ratio
    0.205
    0.017*


    *Correlation    is significant at the 0.05 level (2-tailed), **correlation is    significant at the 0.01 level (2-tailed).
Table 6:  Bivariate analysis model of the correlation between chronic allograft
nephropathy and IFN-γ, IL-10 mRNA transcripts and IFN-γ/IL-10 ratio.
    Un-standardized B Coefficients
    Standardized beta Coefficients
    T
    p-value


    (Constant)
    2.493

    9.268
    0.0001**


    Gender
    -0.138
    -0.135
    -2.58
    0.013*


    Resistive index
    2.714
    0.688
    6.71
    <0.0001**


    IFN- γmRNA transcripts
    0.004
    0.144
    2.625
    0.012*


    *Significant    p-value <0.05, **highly significant p-value <0.01.
Table 7:  Multivariate step-wise backward regression analysis model for
significant predictors of chronic allograft nephropathy.
    Cutoff
    Sensitivity
    Specificity
    PPV
    NPV
    AUC
    95% CI


    >6.7
    46.15
    88.46
    80.0
    62.2
    0.717
    0.58-0.83


    >6.9 *
    46.15
    96.15
    92.3
    64.1


    >7.2
    42.31
    96.15
    91.7
    62.5


    Area Under Curve (AUC), Confidence Interval    (CI), Positive Predictive Value (PPV), Negative Predictive Value (NPV).
Table 8:  Cutoff values and coordinates of the Receiver Operating Characteristic
(ROC) curve for the detection of chronic allograft nephropathy using IFN-γ/IL-10
ratio.
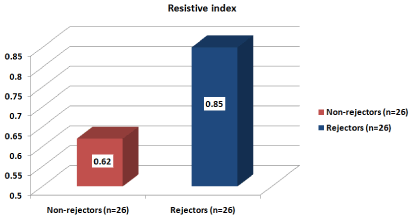
    Figure 1:  There was significantly higher mean values of resistive index
in patients with rejection compared with patients with stable kidney graft
(p<0.0001).
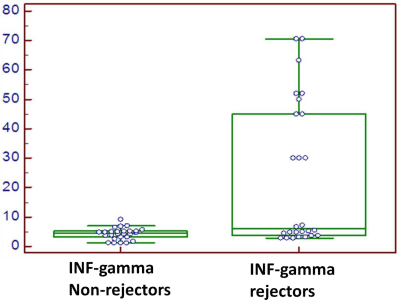
    Figure 2:  The IFN-γ mRNA transcripts were significantly higher in rejector
patients than in non-rejector patients (p<0.0001).
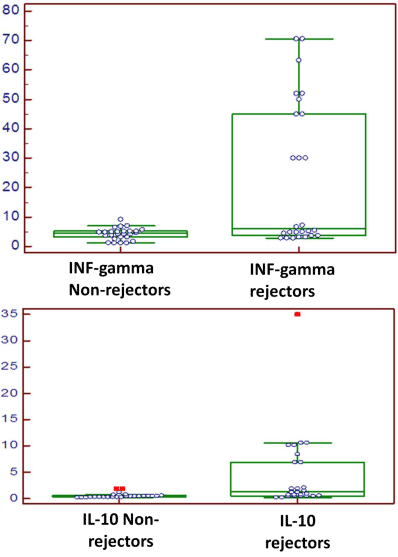
    Figure 3:  The IL-10 mRNA transcripts were significantly higher in rejector
patients than in non-rejector patients (p<0.0001).
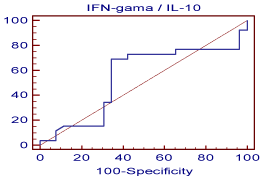
    Figure 4:  Shows the cutoff values and coordinates of the ROC curve for
the detection of chronic allograft nephropathy using IFN-γ/IL-10ratio.
This is a graphical plot of the sensitivity, or true positive rate, versus false
positive rate (1 - specificity or 1 - true negative rate). The optimal cutoff point
of IFN-γ/IL-10 ratio to predict chronic rejection was measured (=7.5) with a
sensitivity of 70%, a specificity of 65.4%, a PPV of 67% and a NPV of 68%.
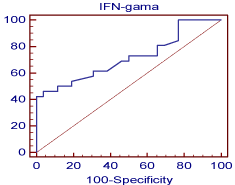
    Figure 5:  Shows the cutoff values and coordinates of the ROC curve for
the detection of chronic rejection using IFN-γ. This is a graphical plot of
the sensitivity, or true positive rate, versus false positive rate (1 - specificity
or 1 - true negative rate). The optimal cutoff point of IFN-γ to predict chronic
rejection was measured (=6.9) with a specificity of 96.2%, a PPV of 92.3%
and a NPV of 64.1%. IFN-γ was significant (p<0.0028) predictor of chronic
rejection with high AUC (0.717).
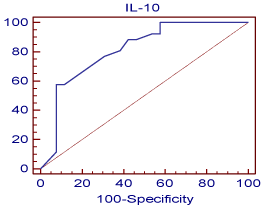
    Figure 6:  shows the cutoff values and coordinates of the ROC curve for
the detection of chronic rejection using IL-10.This is a graphical plot of
the sensitivity, or true positive rate, versus false positive rate (1 - specificity
or 1 - true negative rate). The optimal cutoff point of IL-10 to predict chronic
allograft nephropathy was measured (=0.4) with a specificity of 92.3%, a PPV
of 88.2% and a NPV of 69%. IL-10 was significant (p<0.0001) predictor of
chronic rejection with very high AUC (0.811).
Discussion
In order to provide information regarding the strength of the all immune response, we tried to determine the levels of IFN-γ and IL-10 mRNA transcripts. This new tool can be used for clinical risk assessment for a large scale clinical application.
Immune reactivity is suggested to decrease as patient’s age and there is a lower incidence of acute rejection in older transplant recipients [12]. In our study the mean age of the rejector group was 38.6±12.4 years, while the mean age of the non-rejector group was 38.4±8.1 years. Young groups of our study might provide equality of immune activity and equal risk of rejection.
Our study showed that the levels of IFN-γ mRNA transcripts were significantly higher in patients with rejection than in patients with stable graft function (p <0.0001). There were significant correlations between Chronic allograft nephropathy and higher IFN-γ (p-value <0.0001). Similar studies showed that Th1 cytokine IFN-γ is associated with acute and chronic rejection and graft failure [9].
In a study done by Bendjelloul et al. [2004] [8], they studied the in vitro all responses to non-specific donors in order to identify patients with heightened all immunity. they measured IFN-γ produced by primed all activated peripheral blood lymphocytes (p-allo-PBL) against third party stimulator PBLs in four groups using the enzyme linked immune spot assay (Elispot): 16 with excellent renal transplant function (group 1); nine with chronic rejection (group 2); 11 allosensitized by graft loss on dialysis (group 3) and 36 normal controls (group 4), they concluded that Significant variation in IFN-γ spots may be useful to choose less allergenic donors. Diminished all response to stimulators may decide which patients can benefit from lesser immunosuppressive drugs [13].
The levels of IL-10 mRNA transcripts were significantly higher in patients with Chronic Allograft Nephropathy than in non-rejector patients (p <0.0001). There were significant correlations between chronic rejection and higher IL-10 (p-value <0.009). In contrast to our results Suthanthiran, 1998 [14] showed that intracranial IL10 mRNA expression was correlated with the histological confirmed acute rejection of human renal allograft.
In our study there was significantly higher ratio of IFN-γ/IL-10 in patients with rejection compared with patients with stable graft (p <0.05).
The cutoff point of IFN-γ/IL-10 ratio to predict Chronic Allograft Nephropathy was =7.5 with a sensitivity of 70%, a specificity of 65.4%, a PPV of 67% and a NPV of 68%. This indicates that the IFN-γ/ IL-10 ratio can’t be considered a predictor for Chronic Allograft Nephropathy.
The cutoff point of IFN-γ to predict chronic rejection was =6.9 with a specificity of 96.2%, a PPV of 92.3%, a NPV of 64.1% and a sensitivity of 46.2%. The cutoff point of IL-10 to predict chronic rejection was measured =0.4 with a specificity of 92.3%, a PPV of 88.2%, a NPV of 69% and a sensitivity of 58%. The high sensitivity and particularly high negative predictive value of the IFN-γ and IL-10 mRNA transcripts is of great relevance due to its capacity to rule out the possibility of Chronic Allograft Nephropathy.
Similarly, Bendjelloul et al., (2004) [15] identified patients with transplant rejection by IFN-γ that has positive and negative predictive values of 58% and 95%, respectively, sensitivity of 94% and specificity.
Our results suggest that IFN-γ and IL-10 ratio might provide useful surrogate markers for renal transplant outcome. In kidney transplant patients with renal rejection, the presence of cytokines reflects renal damage and could be an alternative guide for drug therapy at early, preclinical stages of graft rejection, help to optimize the besides evaluating tolerance-inducing protocols.
Further studies that analyze larger numbers of patients with post-transplantation follow-up and different immunosuppressant protocols will be required to make definitive conclusions regarding these hypotheses.
References
- Santos RBD, Gmurczyk A, Jagdeep S. Obhrai JS, Watnick SG. Cardiac Evaluation prior to Kidney Transplantation. Semen Dial. 2010; 23: 324–329.
- Mehrotra A, Heeger PS. B cells and kidney transplantation: beyond antibodies. J Am SocNephrol. 2014; 25: 1373-1374.
- Fiorentino DF, Zlotnik A, Mosmann TR, Howard M, O’Garra A. IL-10 inhibits cytokine production by activated macrophages. J Immunol. 1991; 147: 3815-3822.
- Asderakis A, Sankaran D, Pravica V. High producer interferon gamma (IFNg) and interleukin 10 (IL-10) genotype is associated with increased frequency of acute rejection episodes in kidney transplant recipients. British Transplantation Society 1st Annual Congress. 1998.
- Boogaardt DEV, van Miert PP, de Vaal YJ, de Fijter JW, Claas FH, Roelen DL. The ratio of IFN-γ and IL-10 producing donor-specific cells as an in vitro monitoring tool for renal transplant patients. Transplantation. 2006; 82: 844-848.
- Terasaki PI, Cai J. Humoral theory of transplantation: further evidence. Curr Opin Immunol. 2005; 17: 541.
- Suthanthiran M, Strom TB. Renal transplantation. N Engl J Med. 1994; 331: 365.
- Bendjelloul F, Desin TS, Shoker AS. Donor non-specific IFN-gamma production by primed all reactive cells as a potential screening test to predict the all immune response. Transpl Immunol. 2004; 12: 167.
- Bianco AM, Solari N, Miserere S, Pellegrini C, Vitulo P, Pozzi E, et al. The frequency of interleukin-10-and interleukin-5-secreting CD4 (+) T cells correlates to tolerance of transplanted lung. Transplant Proc. 2005; 37: 2255-2256.
- Joosten SA, Sijpkens YWJ, Kooten CV, Paul LC. Chronic renal allograft rejection: Pathophysiologic considerations. Kidney International. 2005; 68: 1–13.
- Paul LC, Häyry P, Foegh M, Dennis MJ, Mihatsch MJ, Larsson E, et al. Diagnostic criteria for chronic rejection/accelerated graft atherosclerosis in heart and kidney transplants: Joint proposal from the Fourth Alexis Carrel Conference on Chronic Rejection and Accelerated Arteriosclerosis in Transplanted Organs. Transplant Proc. 1993; 25: 2022-2023.
- Friedman AL, Goker O, Kalish MA, Basadonna GP, Kliger AS, Bia MJ, Lorber MI. Renal transplant recipients over aged 60 have diminished immune activity and a low risk of rejection. Int Urol Nephrol. 2004; 36: 451-456.
- Hricik DE, Rodriguez V, Riley J, Bryan K, Tary-Lehmann M, Greenspan N, et al. Enzyme Linked Immunosorbent Spot (ELISPOT) assay for interferon-gamma independently predicts renal function in kidney transplant recipients. Am J Transpl. 2003; 3: 878-884.
- Suthanthiran M. Human renal allograft rejection: molecular characterization. Nephrol Dial Transplant. 1998; 13: 21-24.
- Bendjelloul F, Desin TS, Shoker AS. Donor non-specific IFN-gamma production by primed all reactive cells as a potential screening test to predict the all immune response. Transpl Immunol. 2004; 12: 167-176.
Citation: Attia FM, Kheder E, Khalil KA, Tawfik GA, Omar W and Anani M. Assessment of Interferon Gamma and Interleukin-10 m-RNA Expression in Peripheral Blood From Renal Transplanted Patients with Chronic Allograft Nephropathy by Real Time Polymerase Chain Reaction. Austin J Nephrol Hypertens. 2015; 2(5): 1050. ISSN : 2381-8964