
Editorial
Austin J Pathol Lab Med. 2016; 3(1): 1016.
Applications of Ultrastructural Morphometry in Diagnostic Pathology
Rayat CS*
Department of Histopathology, Postgraduate Institute of Medical Education & Research, India
*Corresponding author: Charan Singh Rayat, Department of Histopathology, Postgraduate Institute of Medical Education & Research, Chandigarh-160012, India
Received: October 14, 2016; Accepted: November 16, 2016; Published: November 17, 2016
Editorial
Quantitative ultrastructural cytopathology, hematopathology and histopathology have been playing a vital role in understanding of cellular, subcellular and extracellular components. Role of various cellular and tissue structures, taking part in physiology and pathophysiology of diseases could be better understood through quantitative evaluation. Optical microscopy still remains a valid tool in diagnostic hematopathology, cytopathology and histopathology, but has its own limitations in terms of resolution. Majority of the pathologists never go beyond 40x objective lens that could give a resolving power of 385 nm only. Deeper exploration at ultrastructural level complemented with Ultrastructural Morphometry (UM) has been found to be of great help in resolving the diagnostic issues in a variety of pathological conditions like: renal disorders, myopathies, neuropathies, carcinomas, liver disorders, viral lesions etc. Image analysis provides systematic means of quantitative measurements. Statistical analysis of quantitative parameters could be used to evaluate the correlation between survival and mortality due to a pathological malady.
Digital imaging technology and use of image analysis software at Transmission Electron Microscopes (TEM) have given quantitative flip to our diagnostic capabilities. Optimal applications of ultrastructural morphometry on the acquired images would provide us a wealth of quantitative data for diagnostic and research pursuits. Manual Morphometry for computing the ultrastructural size using ‘Slide Guide’ ultrastructural size calculator (Dunn & Reidman, Calif, USA), supplied by M/s Taab Laboratories, Berkshire, UK, still remains a valid method on accurately enlarged electron micrographs. Rayat validated a new method for ultrastructural morphometry using ‘dual axes tangential scale’ [1]. Measurement of ‘Glomerular Basement Membrane Thickness’ (GBMT) is must for an accurate diagnosis of ‘Thin Basement Membrane Disease’ (TBMD). Rayat et al. exhibited the role of ultrastructural morphometry in ascertaining a cut-off value of GBMT in Indian adults [2] following the footsteps of Steffes et al. [3] and Jensen et al. [4].
Ultrathin (60nm thick) sections are cut from tissues processed and embedded in epoxy resin for ultrastructural study and morphometry. Ultrathin sections taken on nickel grids are double stained with uranyl acetate and lead citrate. Transmission electron microscopy is done on an electron microscope equipped with digital imaging system loaded with image analysis software. At our TEM Facility Centre, we used Zeiss EM-906 (Carl Zeiss, Oberkochen, Germany) equipped with XR-41, side-mount camera (Advanced Microscopy Techniques Corp. Woburn, USA) having ‘AMT Image Capture Engine’ with modified and well configured Image-J software (Advanced Microscopy Techniques Corp. Woburn, USA). Rayat et al. published an extensive study on glomerular morphometry at optical and ultrastructural level in some renal disorders [5]. One can follow the systematic interactive procedure for exploring the ultrastructural morphometric parameters using acquired electron micrographs in TIFF format at the display of ‘Personal Computer’ (PC). Graphical User Interface (GUI) of an ‘Image Capture Engine’ could be used conveniently for measuring GBMT, diameter of cells, nuclei, nuclear contours, size of mitochondria, granules, viruses, thickness of muscle fibres, fibrils and other tissue components. Some observations are being illustrated here for the initialization of the readers to the marvellous applications of ultrastructural morphometry. For a diagnosis of TBMD 50 measurements of GBMT are taken at a displayed magnification of 20,000x or more and a mean thickness is computed in nm. Measurements of GBMT across the orthogonal intercepts of Glomerular Basement Membrane (GBM) from a case of TBMD have been exhibited in Figure 1. A mean GBM thickness below 265 nm in adults would be treated as the diagnostic feature of TBMD [2]. Location and size of viral bodies in an infected cell gives ultrastructural inference of type of virus. Measurements of diameters of viruses in the nucleus of a hepatocyte have been illustrated in Figure 2 to demonstrate such applications.
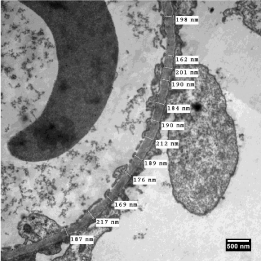
    Figure 1:  Electron micrograph through a portion of renal glomerulus of a
case diagnosed as ‘thin basement membrane disease’ depicting twelve
measurements of orthogonal intercepts across the ‘glomerular basement
membrane’. Staining: Uranyl acetate and lead citrate.
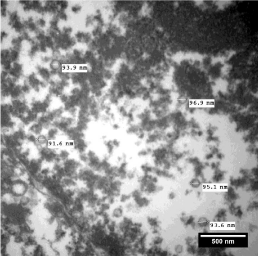
    Figure 2:  Electron micrograph through a portion of nucleus of hepatocyte
showing measurements of diameters of four viral particles. Staining: Uranyl
acetate and lead citrate.
A variety of muscle abnormalities can be evaluated with electron microscopic study of skeletal muscle biopsies. A diagnosis of myopathy would need descriptive features of muscle fibres, mitochondria and glycogen along with mitochondrial inclusions if any, but a quantitative evaluation of fibre size infer information about the extent of atrophy. Atrophy of muscle fibres along with aggregates of mitochondria in myofibrillar spaces is a unique feature of neurogenic myopathy as depicted in Figure 3. Normal muscle fibres, almost of equal size have been illustrated in Figure 4 for a comparative view.
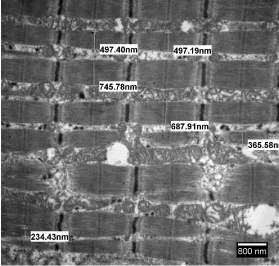
    Figure 3:  Electron micrograph through a portion of skeletal muscle biopsy
exhibiting measurements of diameters of muscle fibers and aggregates of
mitochondria in inter-fibrillar spaces. Staining: Uranyl acetate and lead citrate.
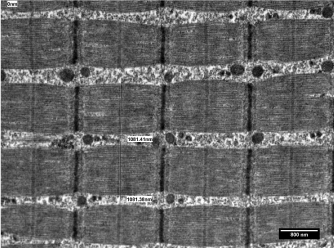
    Figure 4:  Electron micrograph through a portion of skeletal muscle biopsy
exhibiting measurements of diameters of muscle fibers in a case having
normal muscle histology. Staining: Uranyl acetate and lead citrate.
Using Image-J software configured with the Image Capture Engine, large number of quantitative ultrastructural parameters can be explored for diagnostic applications. Percentage of effacement of foot processes of podocytes could be determined through UM for more authentic presentation in cases of ‘Focal Segmental Glomerular Sclerosis’ (FSGS). Figure 5 exhibits the value in μm of the perimeter of a glomerular capillary loop and Figure 6 depicts the measurement of length of podocyte’s foot processes’ effacement zone, which comes out to be 10% of the perimeter. Ultrastructural evaluation of tumors coupled with quantitative measurements of cytoplasm to nuclear ratios, nuclear perimeter and circularity would provide us more authentic statistical inference for diagnostic and research quests. Measurements of area, perimeter and circularity of a nucleus have been depicted in Figure 7 as an illustration of application. Quantitative ultrastructural study of axonal collapse and diameter of nerves in neuropathies would provide an edge over mere descriptive studies in ultrastructural pathology.
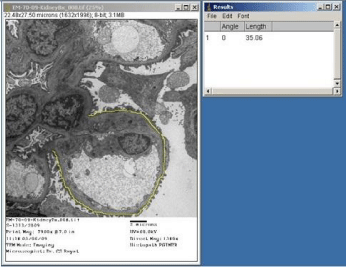
    Figure 5:  Electron micrograph through a portion of renal glomerulus of a case
diagnosed as ‘focal segmental glomerular sclerosis’, depicting measurement
of perimeter of a glomerular capillary loop. Staining: Uranyl acetate and lead
citrate.
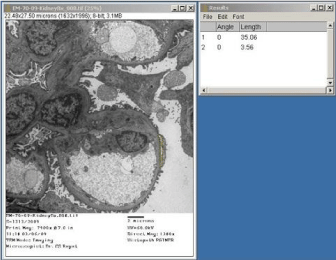
    Figure 6:  Electron micrograph through a portion of renal glomerulus of a case
diagnosed as ‘focal segmental glomerular sclerosis’, depicting measurement
of surface of glomerular capillary loop having effacement of foot processes of
podocyte. Staining: Uranyl acetate and lead citrate.
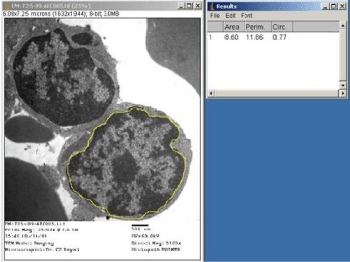
    Figure 7:  Electron micrograph of tumor cells depicting nuclear perimeter,
area and circularity of a nucleus. Staining: Uranyl acetate and lead citrate.
References
- Rayat CS. Ultrastructural morphometry using dual axes tangential scale: a technical revelation. Indian J Pathol Microbiol. 2005; 48: 194-196.
- Rayat CS, Joshi K, Sakhuja V, Datta U. Glomerular basement membrane thickness in normal adults and its application to the diagnosis of thin basement membrane disease: an Indian study. Indian J Pathol Microbiol. 2005; 48: 453-458.
- Steffes MW, Barbosa J, Basgen JM, Sutherland DE, Najarian JS, Mauer SM. Quantitative glomerular morphology of the normal human kidney. Lab Invest. 1983; 49: 82-86.
- Jensen EB, Gundersen HJ, Osterby R. Determination of membrane thickness from orthogonal intercepts. J Microsc. 1979; 115: 19-33.
- Rayat CS, Joshi K, Dey P, Sakhuja V, Minz RW, Datta U. Glomerular morphometry in biopsy evaluation of minimal change disease, membranous glomerulonephritis, thin basement membrane disease and Alport’s syndrome. Analyt Quant Cytol Histol. 2007; 29: 173-182.