
Research Article
Austin J Pathol Lab Med. 2021; 8(1): 1030.
A Prediction Model of Mortality in COVID-19 Pneumonia Based on CT Score and Lymphocyte Count
Xie Y¹#, Dong H²#, Liao Y²#, Zhang J¹, Lv H¹, Teng X¹, Wang T¹, Zhang X¹, Xu Y¹, Wu S¹, Yang L²*, He Z¹* and Wang R¹*
¹Shanghai Jiao Tong University School of Medicine, Shanghai General Hospital, China
²Wuhan University, Wuhan Third Hospital, China #Contributed Equally
*Corresponding author: Ruilan Wang, Department of Critical Care Medicine, Shanghai General Hospital, Shanghai Jiao Tong University School of Medicine, 650 New Songjiang Road, Songjiang, Shanghai 201600, P.R. China
Zhiyan He, Department of Critical Care Medicine, Shanghai General Hospital, Shanghai Jiao Tong University School of Medicine, 650 New Songjiang Road, Songjiang, Shanghai 201600, P.R. China
Luyu Yang, Intensive Care Unit, Wuhan Third Hospital, Wuhan University, China
Received: February 04, 2021; Accepted: February 26, 2021; Published: March 05, 2021
Abstract
Background: COVID-19 nucleic acid swab tests have a high false positive rate; therefore, diagnosing COVID-19 pneumonia and predicting prognosis by CT scan are very important.
Methods: In this retrospective single-centre study, we included consecutive suspected critical COVID-19 pneumonia cases in the intensive care unit of Wuhan Third Hospital from January 31, 2020, to March 16, 2020. 204 cases were confirmed by real-time RT-PCR, and all patients were evaluated with CT, cut-off values were obtained according to the Youden index and were divided into a high CT score group and a low CT score group. Epidemiological, demographic, clinical, and laboratory data were collected. Finally, Through multi-factor logistic regression model, a prediction model based on multiple prediction indicators was formed, and new joint predictive factors were calculated. The prediction model of mortality in COVID-19 pneumonia based on CT score and lymphocyte count was constructed through data processing analysis.
Results: The major imaging feature of COVID-19 pneumonia is Ground Glass Opacities (GGOs). Multivariate regression analysis found that the CT score and absolute lymphocyte count were independent risk factors for death and that the CT score predicted mortality (AUC-ROC =0.7, cut-off=1.45). When the absolute lymphocyte count was lower, the patient’s CT score was also lower. Based on this, a prediction model was established. The prediction model was: In [P/(1-P)]=0.667*gender+0.057*age-0.086CT score-0.831 lymphocyte count-3.91, the goodness of fit test of the model was P=0.041, and the area under the curve of the ROC curve of the model was 0.779.
Conclusion: CT score and absolute lymphocyte count are independent risk factors for mortality, and patients with a high CT score may have a worse prognosis. A lower absolute lymphocyte count may indicate that the patient’s CT score is also reduced. The model established by combining CT scores and lymphocyte count showed a good degree of calibration and differentiation.
Keywords: Corona virus disease; CT score; Lymphocyte count
Introduction
In December 2019, pneumonia associated with the 2019 novel coronavirus (COVID-19) was reported in Wuhan, China. Now COVID-19 has become a global problem. Between 4% and 11% of patients with COVID-19 pneumonia rapidly develop Acute Respiratory Distress Syndrome (ARDS), acute respiratory failure, and other serious complications within a short period of time and eventually deteriorate and die from multiple organ failure [1, 2].
Computed Tomography (CT) examinations, which are reproducible and objective, are used clinically to determine the severity of pneumonia and constitute an effective tool for accurately defining the management strategy. Several studies have reported a relationship between high-resolution CT and the prognosis of pulmonary fibrosis and have found that radiographic fibrosis scores based on HRCT scan reticulation and honeycomb degree predict mortality [3-5]. However, the relationship between CT and the prognosis of COVID-19 pneumonia remains unknown.
While COVID-19 nucleic acid swab tests have a false positive rate as high as 41%; lung CT abnormalities have been detected in 74% of COVID-19 cases [6]. In this study, we retrospectively analysed patients with suspected COVID-19 pneumonia to assess whether CT scores were useful predictors of mortality. We established a prediction model of mortality in COVID-19 pneumonia based on CT score and lymphocyte count.
Methods
Study design and participants
For this retrospective single-centre study, we collected consecutive patients with suspected COVID-19 pneumonia in the intensive care unit of Wuhan Third Hospital, China, from January 31, 2020, to March 16, 2020. The study was approved by the ethics committee and exempted from written informed consent.
Inclusion criteria: All patients were suspected of infection with SARS-CoV-2.
Exclusion criteria: Patients with missing data were excluded.
Collected data
We obtained epidemiological, demographic, clinical, laboratory, management and outcome data from the patient records. Clinical results were followed up until March 16, 2020.
Swabs of the upper respiratory tract from all patients at admission were kept in viral transport media. Real-time RT-PCR was used to detect for SARS-CoV-2. All patients underwent chest CT examinations.
All of the patients’ radiographs included Ground Glass Opacities (GGOs), consolidation, pleural effusion, seepage, and number of involved layers. According to the acute exacerbation of idiopathic pulmonary fibrosis score (AE - IPF), each patient underwent chest CT [3]. Two physicians analysed the chest CT images of each patient and calculated the CT score for each layer as follows: CT score = normal lung tissue (%) ×1+GGO (%) ×2+ consolidation (%) ×3. Finally, the scores of all levels were averaged to obtain the final score, and the higher score from the two physicians was used. The physicians were blinded to the clinical profile and outcome of the patient during the scoring process.
Our treatment plan was as follows: the antiviral drug administered was Arbidol, the initial antibiotic administered was moxifloxacin, and the antibiotic was adjusted according to the culture results. Anticoagulant therapy was employed according to the condition of the patient. When the absolute lymphocyte count was <0.5*109/L, intravenous immunoglobulin was given for 5 days, and supplemental albumin was provided. If after 5 days the absolute lymphocyte number was still low, thymosin was added to enhance the immune function. Small doses of hormone (1-2 mg/kg) were administered for 3-5 days depending on the patient’s level of exudation. The rest of the treatment was based on the guidelines of the WHO [7].
Outcome
The primary outcome was the 28-day mortality. We also described the demographics, physical signs on admission, laboratory results, chest CT scores, and clinical outcomes.
Statistical analysis
If data were normally distributed, we represent the continuous measurements as the mean (SD); otherwise, they are represented as the median (IQR). The classification variables are represented as counts (%). With regard to the laboratory results, we also evaluated whether the measurements were outside the normal ranges. Logistic regression analysis was used to evaluate the outcomes based on the risk factors selected through univariate analysis. The diagnostic value of the CT score for predicting mortality was evaluated by calculating the Area Under the Receiver Operating Characteristic curve (AUC ROC). AUC ROC analysis was performed by comparing survivors with nonsurvivors. The optimal cut-off value was determined by the highest value of the Youden index, maximizing the specificity and sensitivity, as shown in the AUC ROC analysis. We used SPSS (version 26.0) for analyses.
Through multi-factor logistic regression model, a prediction model based on multiple prediction indicators was formed, and new joint predictive factors were calculated. With 28-day mortality or not as the outcome, the area under the receiver operating characteristic curve Area Under the ROC curve (AUROC) of the combined predictors and each original index was compared to determine the optimal critical value, calculate the operating performance parameters such as sensitivity, specificity and accuracy of prediction, and finally carry out individual prediction by substituting individual values. Stata 10.0 software was used for statistical analysis and mapping, and Stata 10.0 command statement, operation process and result output.
Results
The study included 39 patients with suspected COVID-19. All patients tested positive for SARS-CoV-2 nucleic acid. Of these, 24 (61.5%) patients were male, with an average age of 60 years (51-66) (Table 1). At admission, 14 (35.9%) of the patients had tachypnoea. The platelet counts were lower than normal in 2 patients (5.13%) and higher than normal in 1 patient (2.56%). Three patients (7.69%) had abnormal liver function. Four (10.25%) patients had abnormal renal function. Three patients (7.69%) had an abnormal myocardial enzyme spectrum. In most patients, D-dimer levels were greater than 35 mg/L during the course of the disease.
![]()
    All patients n=39
    High-CT score n=25
    Low-CT score n=14
    P value


    Age, years
    60 (51-66)
    60(51-64)
    62.5(40.25-78.75)
    0.768


    Sex


    Men
    24 (61.5)
    16 (64)
    8 (57.1)
    0.74


    Women
    15 (38.5)
    9 (36)
    6 (42.9)
    0.74


    Symptoms


    Fever%
    36 (92.3)
    24 (96)
    12 (85.7)
    0.289


    Respiratory rate
    26 (22-40)
    35 (23.5-44)
    24 (19.75-26)
    0.007*


    >24 breaths per min
    14 (35.9)
    11 (44)
    3 (21.4)
    0.187


    Systolia pressure, mmHg
    130 (130-147)
    135.5 (123.5-147)
    124 (116-148)
    0.308


    SpO2, %
    93 (84-97)
    91 (81.75-95.75)
    93 (85-97.75)
    0.947


    Heart rate
    95 (86-100)
    95 (86-100)
    94 (92.25-113.75)
    0.467


    Laboratory test


    White blood cell count, ×109/L
    8.6 (5.12-10.8)
    8.6 (5.275-11.7)
    8.35 (3.2-9.975)
    0.247


    Neutrophil %
    88.9 (81.2-91.7)
    88.85 (82.92-91.925)
    895 (77.4-91.6)
    0.26


    Lymphocyte count, ×109/L
    0.48 (0.33-0.685)
    0.45 (0.285-0.685)
    0.58 (0.43-0.75)
    0.715


    Lymphocyte %
    6.36 (4.1-11.82)
    5.52 (3.31-9.83)
    8.43 (5.03-17.45)
    0.747


    Platelet <100×109/L, %
    2 (5.13)
    1 (4)
    1 (14.3)
    1


    D-dimer, mg/L
    5.93 (2.49-25.83)
    6.41 (2.725-33.75)
    5.16 (1.59-6.46)
    0.261


    Albumin, g/L
    28.05 (25.55-30.1)
    25.6 (22.65-28.42)
    28.8 (25.3-34.6)
    0.751


    Potassium, mmol/L
    3.77 (3.36-4.24)
    3.78 (3.4-4.22)
    3.7 (3.2-4.36)
    0.662


    Calcium, mmol/L
    1.21 (1.15-1.92)
    1.87 (1.15-1.92)
    1.19 (1.14-1.9)
    0.431


    Sodium, mmol/L
    142 (141-145)
    142 (140-144)
    142.5 (141-144.5)
    0.971


    Procalcitonin, ug/L
    0.19 (0.085-0.382)
    0.335 (0.11-0.74)
    0.14 (0.07-0.287)
    0.08


    C-reactive protein, mg/
    59 (21.39-143.79)
    81.5 (22.12-188.9)
    58.69 (15.81-70.88)
    0.152


    ph
    7.41 (7.375-7.438)
    7.42 (7.39-7.48)
    7.4 (7.33-7.41)
    0.069


    PaO2, mmHg
    58 (49-150.5)
    55.5 (48.5-60.5)
    151 (56-234.25)
    0.034


    PaCO2, mmHg
    39.5 (36.05-47.02)
    38 (31.85-46.05)
    43.55 (38.85-48.425)
    0.338


    Lac, mmol/L
    2.23 (1.137-3.68)
    3.39 (1.42-4.26)
    2.2 (0.75-2.432)
    0.03


    HCO3 -
    25.4 (23.7-28.55)
    25.7 (23.55-28.62)
    25.4 (23.6-28.7)
    0.952


    Acute myocardial injury
    4 (10.25)
    3 (12)
    1 (7.1)
    1


    %


    Acute liver injury %
    3 (7.69)
    2 (8)
    1 (14.3)
    1


    Acute kidney injury %
    4 (10.25)
    2 (8)
    2 (14.3)
    1


    GGO in the limbic region of the lung
    39 (100)
    25 (100%)
    14 (100%)
    -


    GGO expands to the central area of the lung
    25 (64.1)
    25 (100%)
    0
    -


    Consolidation
    16 (41.0)
    10 (40%)
    6 (42.8%)
    1


    Time of GGO became pulmonary consolidation
    10 (25.6)
    5 (4.75-6)
    5 (4.5-6.5)
    0.86


    28 day mortality %
    11 (28.2)
    11 (44)
    0
    0.003*


    *p<0.05
Table 1: Demographic characteristics, baseline characteristics, and clinical outcomes of patients with suspected novel coronavirus infected.
Figure 1A shows the CT of a patient with COVID-19 pneumonia. This 84-year-old patient was male, and he presented with a cough and fever for more than 10 days. His CT score was 1.10. At 28 days, the patients was alive. (Figure 1B) shows the CT of a 62-year-old male patient who presented with a cough and a fever for more than 7 days. His CT score was 1.55, and he was alive 28 days after admission. (Figure 1C) shows the CT of a 63-year-old female patient who presented with a cough and a fever for 7 days. She had a CT score of 1.7, and she did not survive. (Figure 1D) shows the CT of a 52-yearold female patient who presented with a cough and a fever for 10 days. She had experienced shortness of breath for 5 days. Her CT score was 1.95, and she did not survive.
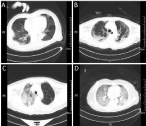
    Figure 1: CT of COVID-19 pneumonia. (A: Man, 84 years old, cough and
fever for more than 10 days, he survived; B: Man, 62 years old, cough and
fever for more than 7 days, he survived; C: Woman, 63 years old, cough and
fever for 7 days, she died; D: Woman, 52 years old, cough and fever for 10
days, shortness of breath for 5 days, she died).
Our study found that GGO was the main manifestation of COVID-19 pneumonia. The intense immune response of the body could quickly drive progression and the development of pulmonary consolidation, but pleural effusion was less frequent. Lymph node enlargement was also absent or insignificant, and cavities were relatively uncommon.
When an elderly individual is weak or suffers from other basic diseases, such as diabetes and immunodeficiency, multiple pulmonary infections can occur. The CT findings are complex, and multiple signs may appear. Severe pneumonia progresses rapidly and can result in diffuse bilateral lung consolidation (so-called “white lung”), accompanied by a small amount of pleural effusion. In this case, the diseased lungs cannot perform gas exchange adequately, causing respiratory distress syndrome and suffocation.
It takes only 1 to 2 days to develop from involvement of the peripheral lung zone to the diffuse distribution of GGOs in the central lung region. Three days after the onset of COVID-19, the disease had developed rapidly: GGOs and lung consolidation were no longer limited to the peripheral lung zone, and lesions were also apparent in the central lung region, with a bilateral diffuse distribution in the shape of a butterfly wing. Fourteen days after the onset of symptoms, in addition to GGOs, pulmonary consolidation, and signs of impaired gas exchange, pulmonary interstitial fibrotic changes in the filaments and cords began to appear.
Mortality on day 28 was taken as the output item for binary logistic regression analysis, and the P values of the above three variables were all less than 0.25, which led to their inclusion in multivariate binary logistic regression analysis. The OR value of the CT score was 10, and the P value was 0.003 (Table 2).
![]()
    OR
    CI (95%)
    P-value


    Age
    2.358
    0.346-16.07
    0.381


    Male
    2
    0.436 -9.176
    0.373


    CT score
    10
    1.125-88.91
    0.003*


    Lymphocyte count, ×109/L
    0.795
    0.426-1.481
    0.002*


    *p<0.05
Table 2: Multivariate analysis of mortality risk (n=39).
The distribution of the CT scores of the 39 cases was normal, and the P value obtained through Pearson correlation analysis was 0.003<0.05, showing a linear correlation. The AUC-ROC was 0.7 (Figure 2), the standard error was 0.082, and the 95% Confidence Interval (95% CI) was 0.539~0.860. According to the results, the case fatality rate increased when the CT score was greater than 1.45.

Figure 2: ROC analysis of mortality based on CT score.
According to whether the CT score was greater than 1.45, the patients were divided into a high CT score group and a low CT score group. In terms of symptoms, the incidence of shortness of breath in the high CT score group was significantly higher than that in the low CT score group. With regard to the laboratory results, the PaO2 was lower in the high CT score group, while the serum lactic acid level was higher in the high CT score group. There was no significant difference in the other laboratory results, but the 28-day mortality rate of the high CT score group was significantly higher than that of the low CT score group (Table 1).
The imaging features of COVID-19 cases are shown in (Table 3). The CT images showed GGOs distributed in the marginal areas of the lung in 14 cases, the central area of the lung in 25 cases, and complicated with consolidation in 16 cases. Because the follow-up time was short, no significant fibrosis was observed. The early stage was characterized by GGOs, and pulmonary consolidation began at a median of 5 days, with no statistically significant difference between the two groups.
![]()
    High CT score n=25
    Low CT score n=14
    P-value


    GGO in the limbic region of the lung
    25 (100%)
    14 (100%)
    -


    GGO expands to the central area of the lung
    25 (100%)
    0
    -


    Consolidation
    10 (40%)
    6 (42.8%)
    1


    Time of GGO became pulmonary consolidation
    5 (4.75-6)
    5 (4.5-6.5)
    0.86
Table 3: Imaging Features of 2019 Novel Coronavirus.
In our study, as the absolute lymphocyte counts decreased, the CT score also deteriorated. (Figure 3) shows the absolute lymphocyte count and CT score of a patient who did not survive. He had the following characteristics: 51 years old, presented with a cough and a fever for more than 10 days, positive nucleic acid test, progressive reduction in the absolute lymphocyte count, concomitant reduction in the CT score, and death by the 7th day after admission. (Figure 4) shows the absolute lymphocyte count and CT score of a surviving patient. A 49-year-old woman presented with a cough and a fever for 6 days, was positive for SARS-CoV-2 nucleic acid, and had gradual increases in her absolute lymphocyte count and CT score.
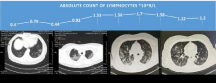
Figure 3: Absolute lymphocyte count and CT image of a nonsurviving patient.

Figure 4: Absolute lymphocyte count and CT image of a surviving patient.
Formulation and evaluation of the prediction model: Based on CT score, lymphocyte count, gender and age, a prediction model was established. Formulation and evaluation of the prediction model: Witch values (day 1) were used for the prediction model. The prediction model was: I In [P/(1-P)]=0.667*gender+0.057*age- 0.086CT score-0.831 lymphocyte count-3.91, the goodness of fit test of the model was P=0.041, and the area under the curve of the ROC curve of the model was 0.779 (Figure 5). The model showed a good degree of calibration and differentiation.

    Figure 5: ROC cure of the prediction model of mortality in COVID-19
pneumonia based on CT score and lymphocyte count.
Discussion
This is an observational descriptive study of patients with suspected COVID-19 pneumonia, including data from 39 patients from the ICU of Wuhan Third Hospital from January 31 to March16, 2020. It describes the CT characteristics of patients with COVID-19 pneumonia, and the CT score was used to quantify the imaging findings. Based on CT score, lymphocyte count, gender and age, a prediction model of mortality in COVID-19 pneumonia was established.
Most COVID-19 pneumonitis is mild, similar to common viral pneumonia. The symptoms, if present, may be very mild, but the CT scan can still show mild abnormalities, beginning mainly with bilateral small subpleural GGO with patches of shadow in a unilateral lung field. When the symptoms and signs indicated an average case, the CT characteristics were similar to those of a mild case but quickly progressed to GGOs extending into the central lung region, followed by consolidation (small flake and chamber nodules), with time delay and pulmonary interstitial changes, such as septal thickening, thickening of the alveolar interval (pavement), involvement of the lobar core, and a large an increase in the number of bronchi with thickened walls, and pleural thickening [8,9]. The clinical symptoms of severe viral pneumonia progressed rapidly. CT showed that GGOs gradually evolved from flaky lung consolidation to a wide range of lesions, accompanied by the bronchial gas phase, increased blurring of the lung texture, and a small amount of pleural effusion. Pulmonary cavity formation was rare, and mediastinal lymph node enlargement was rare. A very small number of people may become critically ill with diffuse lesions in both lungs and even uniform extensive consolidation (“white lung”). A combination of multiple infections can lead to more severe manifestations [10-13]. In our study, CT images showed GGOs distributed in the marginal areas of the lung in 14 cases (low CT score group), in the central area of the lung in 25 cases (high CT score), and complicated with consolidation in 16 cases. As the follow-up time was short, no significant fibrosis was observed. The early stage was characterized by the presence of GGOs, and pulmonary consolidation began at a median of 5 days.
We found that CT could somewhat display subpleural GGO in most patients within approximately a week of onset, even in some patients with previous CT scans negative for interstitial thickening due to GGOs. However, this kind of GGO appeared a relatively long time after the development of symptoms and later became severe in the hospital. The combined number of mild and average cases is relatively large. It is possible that, like the common cold, even when the pharyngeal swab was positive for SARS-CoV-2 nucleic acid, some patients had self-limiting infections of the upper respiratory tract, and only a few developed pulmonary infections that later became severe cases of COVID-19. Beginning with an upper respiratory tract infection, progression occurs when a large number of virus particles are breathed into the pulmonary gas exchange region, causing peripheral pulmonary and alveolar mucosa inflammation after the adsorption of the particles mainly in the alveolar walls. This leads to the development of GGOs. Despite the activation of an increasing number of immune mechanisms, viral replication continues, and inflammation increases. At this stage, it is not just liquid leakage; rather, fibrous hyperplasia of the seepage and the crazy paving pattern develop, followed by consolidation of the lung and late pulmonary fibrosis. In some patients, lung pathological changes are very apparent but the upper respiratory tract infection has abated. A dry cough does not produce phlegm for testing, and the pharynx swab nucleic acid tests can be false negatives.
The CT score was obtained by visually measuring each layer of the CT images with pathological changes. This scoring method has been used to evaluate the prognosis of idiopathic pulmonary fibrosis. There is no report of the use of this CT score to assess the prognosis of COVID-19. Some studies have found a similar area-based grading method to explore the relationship of viral pneumonia with viral load [14]. In our study, patients generally experienced onset the disease 7 to 10 days prior to admission to the hospital, and there were no significant differences in comorbidities and laboratory results, except for PaO2 and Lac in the blood gas analysis. There was no significant difference between the high CT score and low CT score groups at baseline. Our study showed a higher 7-day mortality rate in the high CT score group than in the low CT score group, indicating that the disease became more serious in the later stages when the CT score was high. At present, many cases of COVID-19 have occult onset, with one or even multiple negative nucleic acid tests and no clinical symptoms. However, the CT images are positive. These patients may cause familial aggregates of infection [9], which further spreads the epidemic [15]. Therefore, it is necessary to diagnose COVID-19 in pneumonia patients with obvious abnormalities on CT. Of course, Guan et al. found that there might be normal radiological manifestations in some infected patients, and the accuracy rate of diagnosing COVID-19 by CT alone was 76.4% [6]. We need to combine clinical manifestations with laboratory results.
We also observed a correlation between absolute lymphocyte counts and CT changes; the absolute lymphocyte count progressively decreased, and CT score also deteriorated as the disease progressed. Most studies [1,2,6] found a decrease over time in the absolute lymphocyte count of COVID-19 patients. A low absolute lymphocyte count may indicate that the patient is more severely ill and may have a higher risk of mortality. In our study, one nonsurviving patient’s absolute lymphocyte count was close to zero.
This study has several limitations. First, this study is a singlecentre retrospective study. The number of patients is relatively small, and the next step is to include as many cases as possible from multiple centres to gain a more complete understanding of COVID-19. Second, more information, especially about the clinical outcomes, was not available for analysis. We suggest observing whether there is a relationship between the speed of the conversion of large GGOs to pulmonary consolidation and the later conversion to pulmonary fibrosis. However, the data in this study provides an early assessment of CT findings pertaining to COVID-19 pneumonia in Wuhan, China.
Conclusion
In summary, in patients suspected of having COVID-19, higher CT scores may indicate that the patient is more likely to develop severe disease and may have a higher risk of mortality. When the absolute lymphocyte count decreases, the patient’s CT score also deteriorates. The model established by combining CT scores and lymphocyte count showed a good degree of calibration and differentiation. Therefore, we need to pay close attention to both clinical manifestations and laboratory results.
Acknowledgement
We thank the hospital staff for their efforts in recruiting patients.
Ethical Approval and Consent to participate
Ethics approval from Shanghai General Hospital Institutional Review Board: reference number (2020 [11]), Written informed consent was waived due to the rapid emergence of this infectious disease.
Consent for publication
All the authors have approved the manuscript and agree with publication.
Registration details
Trial registration: NCT04284046, ClinicalTrials.gov.
Availability of supporting data
After publication, the data will be made available to others on reasonable requests to the corresponding author.
Authors’ Contributions
YX, HD, LYX, JXZ, HL, XLT, TW, XYZ, LYY and RLW contributed to the study conception and design, analysis and interpretation of data; drafting of the article and critical revision for important intellectual content. All the authors have read and approved the final manuscript.
References
- Chen N, Zhou M, Dong X, Qu J, Gong F, Han Y, et al. Epidemiological and clinical characteristics of 99 cases of 2019 novel coronavirus pneumonia in Wuhan, China: a descriptive study. Lancet. 2020.
- Wang D, Hu B, Hu C, Zhu F, Liu X, Zhang J, et al. Clinical Characteristics of 138 Hospitalized Patients With 2019 Novel Coronavirus-Infected Pneumonia in Wuhan, China. JAMA. 2020.
- Fujimoto K, Taniguchi H, Johkoh T, Kondoh Y, Ichikado K, Sumikawa H, et al. Acute exacerbation of idiopathic pulmonary fibrosis: high-resolution CT scores predict mortality. European Radiology. 2012; 22: 83-92.
- Mooney JJ, Elicker BM, Urbania TH, Agarwal MR, Ryerson CJ, Nguyen MLT, et al. Radiographic Fibrosis Score Predicts Survival in Hypersensitivity Pneumonitis. Chest. 2013; 144: 586-592.
- Takei R, Arita M, Kumagai S. Radiographic fibrosis score predicts survival in systemic sclerosis-associated interstitial lung disease. Respirology. 2017.
- Guan W, Ni Z, Hu Y, Liang W, Ou C, He J, et al. Clinical characteristics of 2019 novel coronavirus infection in China. medRxiv. 2020.
- WHO. Clinical management of severe acute respiratory infection when Novel coronavirus (nCoV) infection is suspected: interim guidance. 2020.
- Lei J, Li J, Li X, Qi X. CT Imaging of the 2019 Novel Coronavirus (COVID-19) Pneumonia. Radiology. 2020.
- Chan JF, Yuan S, Kok KH, To KKW, Chu X, Yang J, et al. A familial cluster of pneumonia associated with the 2019 novel coronavirus indicating person-toperson transmission: a study of a family cluster. Lancet. 2020.
- Chung M, Bernheim A, Mei X, Zhang N, Huang M, Zeng X, et al. CT Imaging Features of 2019 Novel Coronavirus (COVID-19). Radiology. 2020.
- Kanne JP. Chest CT Findings in 2019 Novel Coronavirus (COVID-19) Infections from Wuhan, China: Key Points for the Radiologist. Radiology. 2020.
- Fang Y, Zhang H, Xu Y, Xie J, Pang P, Ji W, et al. CT Manifestations of Two Cases of 2019 Novel Coronavirus (COVID-19) Pneumonia. Radiology. 2020.
- Shi H, Han X, Zheng C. Evolution of CT Manifestations in a Patient Recovered from 2019 Novel Coronavirus (COVID-19) Pneumonia in Wuhan, China. Radiology. 2020.
- Deng YY, Lu PX, Yang GL. Correlative study of semi-quantitative score of chest CT findings and viral load in novel influenza A (H1N1) virus infection. Radiol Practice, 2010; 25: 965-968.
- Liao X, Wang B, Kang Y. Novel coronavirus infection during the 2019-2020 epidemic: preparing intensive care units-the experience in Sichuan Province, China. Intensive Care Med. 2020.