
Research Article
Austin J Pharmacol Ther. 2024; 12(2): 1190.
Hepatitis C Virus NS3, NS5A and NS5B Proteins as Drug Targets, Characterization and Their Over-Expression
Izzah Mudassar1; Hafiz Muhammad Aun Javed1; Rana Muhammad Sohail Afzal Khan1; Shahzad Abid1; Muhammad Aetesam Nasir1; Hafiz Muhammad Awais Qarni2; Rubace Fatima Mirza3; Syeda Zuha Naqvi4; Muhammad Waqar Mazhar5*
1Department of Medicine and Surgery, Hitec-Institute of Medical Sciences Taxila Cantt, Pakistan
2Department of Medicine and Surgery Quaid e Azam Medical College BWP, Pakistan
3Department of Medicine and Surgery, Wah Medical College, Wah Cantt, Pakistan
4Department of Medicine and Surgery, Frontiers Medical College, Abbottabad, Pakistan
5Department of Bioinformatics and Biotechnology, Government College University, Faisalabad, Pakistan
*Corresponding author: Muhammad Waqar Mazhar Department of Bioinformatics and Biotechnology, Government College University, Faisalabad, Pakistan. Tel: +923012222861 Email: waqarmazhar63@gmail.com
Received: March 06, 2024 Accepted: April 23, 2024 Published: April 30, 2024
Abstract
As a result of this issue, researchers are working to develop medicines that target HCV non-structural proteins like NS5B, NS3, and NS5A. Moreover, the majority of the research so far has centered on HCV genotype 1 proteins. HCV 3a genotype spread globally in underdeveloped countries. As a first approach toward the study’s goal, we investigated the distribution of HCV in Lahore, Pakistan which indicated that 4.9% of the city’s population contain active HCV infections, and the middle age (20-39 years) population has higher risk.
According to these investigations, the tested inhibitors NS5B was found to interact with RNA when analyzed using SPR and the compounds filibuvir and lomibuvir also have some interference with this interaction.
Finally, we improved conditions for HCV genotype 3a over-expression of NS3 and NS5A. The upregulated NS3 and NS5A were achieved t 25oC and doses were 0.25and 1 millimolar. The yield of pure NS3 protein produced is four times greater than previously reported. The purified NS3 quantity along with its catalytic efficiency indicated that the optimal temperature for over-expression is 25 °C. At different temperatures NS3 expressed and was found to be unrelated to changes in the protein’s global structural characteristics using Circular Dichroism spectroscopy. Furthermore, Fourier Transform Infrared Spectroscopy research reveals that both NS3 and NS5A contain alpha-helical and beta sheet structures, with the proportion of alpha-helical and beta sheet structures in NS5A being about equal. The ability to characterize NS3 and NS5A Will aid in the development of new ways to combat HCV infection.
Keywords: HCV; NS3; NS5B; CD spectrophotometry; FTIR spectrophotometry; Genotypes
Introduction
Liver inflammation caused by a viral infection known as hepatitis. This disease can also occur due to drugs, chemicals, autoimmune diseases, and alcohol. Hepatitis A, B, C, D, E, and G are six different kinds of viral hepatitis [23]. These viruses belong to entirely different families except HCV and HGV [26]. Hepatitis A and E are primarily caused by water but the Hepatitis B, C, and D are mainly transmitted by fluid transfusion like blood or blood products [22]. HCV is a member of the Flaviviridae family and the genus Hepacivirus. At present HCV is thought to infect between 130 and 200 million individuals worldwide, with over 350,000 people dying each year from HCV-related diseases [19]. Egypt has the highest proportion of HCV infection in the world, with at least 14% of the population infected [4]. According to WHO, Hepatitis C affected 170 million people around the world. and about 4-10% population in Pakistan is supposed to have this disease [15]. HCV infection and related pathologies lead to an estimated 250,000 deaths a year worldwide. The transmission of HCV can be occurred through various routes as in past it can be recovered from the saliva of an infected patient [13]. Currently, the common route of transmission is reported via blood transfusion. Sexual transmission is also reported for HCV but is not very common and transmission rarely occurs from exposure to other body fluids [28]. The HCV epidemiological linked ailments such as chronic hepatitis, hepatocellular carcinoma, and end stage liver disease have been found to be responsible of high impact on world health system [15].
The Hepatitis C Virus has single standard RNA, belongs to Flaviviridae family, encapsulated by a core and envelope glycoproteins [10].
Virus binding to cell surface receptor leads to endocytosis of the particle and release of the RNA. RNA is translated and processed into polyprotein. New viral RNA is synthesized. This new RNA is packaged assembly of RNA into new viruses, maturation and release from cell. (Moradpour et al. 2007). Nonstructural protein 3 (NS3) is a large 69 kDa protein, having multifunction’s and mainly accountable for maturation of all the non-structural proteins [18]. It is consisted of two important domains, an N-terminal spanning of 180 amino acids work as a C-terminal RNA helicase/NTPase and serine protease domain [12]. The activity of enzyme of both domains is required for replication of Hepatitis C virus. Nonstructural protein 5B (NS5B) is an RNA dependent RNA Polymerase (RdRp) and associated in viral genome replication [14]. It consists of about 590 amino acids and just like the other polymerases, its structure also resembles right hand containing fingers, thumb and palm.
The NS3 viral protease with a functional catalytic triad (His51, Asp75, Ser135) is absolutely essential for viral replication and is itself automatically cleaved from the polypeptide precursor. The presence of a small activating protein or cofactor is a prerequisite for optimal catalytic activity of the flaviviral NS3 proteases with natural polyprotein substrates and this requirement of the small protein cofactor is not reported in the nonflavivirus proteases so far.
The structure of the WNV NS3 protease is unknown, the crystal structures of the dengue NS3 protease, the dengue NS3 protease complexed with peptide inhibitor and the HCV NS3 protease complexed with cofactor NS4A15 have been reported. On the basis of the template structures and their highly correlated structural homology, we modeled a series of structures: WNV-NS3, WNV-NS3-NS2B, and WNV-NS3-NS2B-substrate. NS5B can be inhibited either directly on the active site or indirectly targeting the allosteric sites. Two types of inhibitors are in clinical stages against NS5B include, Nucleoside Analogues (NAs) and Non-Nucleoside Analogues (NNAs) [3].
The data related to binding of inhibitors against genotype 1a and 1b is available (Winquist et al. 2013) but there is little information available that either these inhibitors are effective against genotype 3a which is a major genotype of third world countries including Pakistan. Getting enough of the target protein is the first step in designing efficient inhibitors. Extensive functional and structural analyses will enable by such quantities, required for the rational design of inhibitors. To our knowledge, no systematic research has been done to overexpress and purify HCV genotype 3a's NS3 and NS5A. We have effectively developed over-expression and purification techniques to produce the relevant proteins in adequate numbers for functional and structural research with and without inhibitors, taking into account the significance of NS3 and NS5A as antiviral therapeutic targets. Additionally, structural and functional characteristics of the isolated proteins were determined.
Material and Methods
Sampling
781HCV positive blood samples were gathered from a variety of hospitals that were previously engaged in HCV diagnostic work (PINUM, Liver center Faisalabad and Lahore). To separate plasma, these were agitated at 4000 rpm for 5 mins. The plasma was kept at -20°C for further DNA extraction and synthesis of complementary DNA (cDNA).
RNA Extraction
Total RNA extraction was done by the Qiamp Viral RNA extraction kit (Qiagen, USA) from these HCV strain 3a-infected samples in accordance with the instructions. The Revertaid H-Minus First strand cDNA synthesis kit (Fermentas) was utilised to make cDNA from the isolated RNA according to the instructions. The samples of cDNA were incubated for 5 minsat 25°C, then incubated for 1 hour at 42°C before being kept at -20°C until used for amplification.
PCR Amplification
The synthesized cDNA from the samples of different patients were amplified and Table1 lists the PCR conditions that were applied. Made the volume 50 μL of volume was made by adding sterile distilled water in 0.20 mL PCR tubes. The reaction mixture was incubated in thermal cycler (Biorad)
    Name of Gene

    Initial    Denaturation at 95 C

    Denaturation 95    C

    Annealing

    Extension 72 C

    Final Extension    72 C

    No. of cycles


    NS3A

    6 min

    1 min

    55-61 C for 1 min

    6 min

    30 min

    35


    NS4A

    3 min

    30 sec

    53-61C for 30 sec

    1 min & 30 sec

    4 min

    31


    NS5A & NS5A-T

    5 min

    1 min

    55-61C for 1 min

    5 min

    20 min

    35


    NS5B-T

    5 min

    1 min

    53-61C for 30 sec

    5 min

    25 min

    35
Table 1: PCR conditions for target sequence amplification.
Restriction, Purification and Cloning of the Amplified Genes
The amplified PCR products (1893bp; 162bp; 1356bp; 1263bp and 1710bp) were extracted either by using the PCR purification kit (Qiagen) or firstly run on the gel and then purified by Gel Extration Kit (Qiagen). After the purification of the PCR products, these were digested with the respective restriction enzymes (NdeI, BamH1, HindIII used in this study) and cloned into the pET 11a vector which was already restricted and dephosphorylated with the alkaline phosphatase (Roche). The QIA quick gel extraction kit (Qiagen, inc. USA) was utilized to purify restricted items using the gel extraction method.
The Recombinant plasmids constructs were given the name pET11a-His6NS3; pET11a-His6-NS4A; pET11a-His6-NS5A-T; pET11a-NS5A-His6 and pET11aNS5B-His6.
Competent Cells Preparation
Competent cells (XL1 Blue and BL21 DE3) were prepared according to the Promega application guidelines. E. coli BL21 (DE3) competent cells were modified with the cloned recombinant plasmids.
Purification of Proteins
Various chromatography techniques were used to extract the proteins expressed in E. coli including the Ni-NTA chromatography, ion Exchange chromatography, Poly U chromatography, and size exclusion chromatography (gel filtration chromatography). At 4°C, all purification processes were carried out using the ÄKTA explorer platform (GE Healthcare).
SDS-PAGE
Protein purity was evaluated by SDS PAGE using the X-Cell Surelock Minihttp://www.invitrogen.com/site/us/en/home/Products-and-Services/Applications/Protein-Expression-and-Analysis/Protein-Gel-Electrophoresis/Electrophoresis-Instruments-Power-Supplies-Accessories/Protein-Gel-Electrophoresis-Chamber-Systems/Xcell-Surelock-Mini-Vertical-Electrophoresis-Chamber.htmlcell electrophoresis system from Invitrogen NuPAGE 4-12% Bis-Tris 10 well gel (Invitrogen) was utilized for running the samples. Electrophoresis was performed at constant voltage of 200 V using MOPS SDS running buffer (Invitrogen) until the dye front touched the gel's bottom (~ 60 min). Bands of protein were observed by staining with coomassie brilliant blue or PageBlueTM Protein Staining Solution (Thermo Scientific).
Statistical Analysis
Minitab version 16.2 for Windows was used to statistically analyse all of the PCR-based HCV qualitative data. Binary Logistic regression was used to investigate the prevalence of HCV associated with age and sex. Based on Wald statistics, the Odds Ratios (OR) or regression estimations were statistically tested. The logistic regression model appeared to fit the data satisfactorily based on the Hosmer–Lemeshow statistic, and 95% confidence intervals for odd ratios were computed. A p-value
Results
PCR Product Analysis
The products of PCR of all the genes NS3 and NS5B-T having size of 1893bp and 1710bp, respectively, were obtained by the PCR amplification using specific primers and experimental conditions as stated in the Materials & Methods. The PCR products after the amplification were ligated into the expression vector pET 11a. After ligation of these products into expression vector, E. coli XL1 blue cells were modified with these recombinant plasmids. The transformants were isolated and confirmed by restriction digestion analysis. The DNA fragments isolated after restriction of these plasmids were analyzed on 1% agarose gel. The result for NS3 PCR amplification, restriction digestion and cloning are shown in Figure 1.
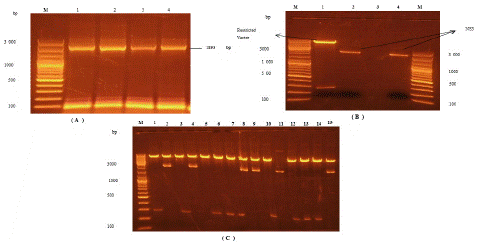
    Figure 1: Analysis of PCR products and generated restriction DNA fragments.

(A) Amplified PCR product of NS3, (B) Restricted pET11a

vector and restricted NS3 and (C) Confirmation of ligated product through restriction digestion. M is for DNA marker of size 100 bp and 1 Kb. Number of samples represented with 1,2,3.
Analysis of DNA Cloned
The samples were sent to Uppsala Genome Centre for sequence analysis and the chromatograms obtained were analyzed using the Sequencher program. After combining the reverse and forward sequences, the DNA sequences were compared with the gene sequences from Gene bank. The acquired sequences were deferred to the NCBI database with AC numbers of JQ676838 and JQ676842 for NS3 and NS5B-T, respectively. The sequences when blasted using the NCBI BLAST tools, showed a high similarity with genotype 3a sequences, already available in the gene bank. All the sequences of the cloned genes were translated into amino acids using the bioinformatics software such as Expasy server https://www.expasy.org/.
Purification of NS3
The expression of NS3 was performed at 12-15°C for 22 hours with 1 mM IPTG concentration and purified by Ni-NTA and Poly-U chromatography. Purity of protein was analyzed on SDS gel (Figure 2). The gel analysis showed a purity of more than 95% and the yield was approximately 4 mg/liter of culture. Small aliquots of the protein were stored at -80°C.
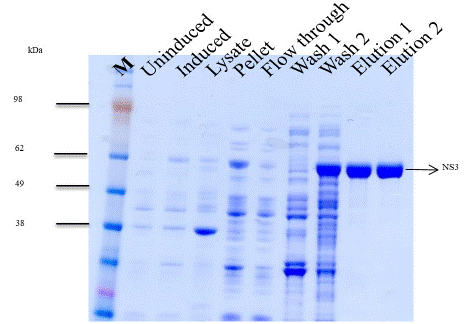
Figure 2: SDS-polyacrylamide gel of NS3.
Commassie brilliant blue staining showed different purified protein fractions. Elution 1 showed Ni-NTA purification using 250 mM imidazole and elution 2 of Poly-U chromatography. The mobilities of (M) marker proteins with known molecular masses are shown on the gel's left side.
Activity Measurements of NS3
For activity measurement, NS3 protein was stored in a concentration of 86 nm in liquid nitrogen container. In both the optimised and reference buffers, the catalytic parameters (kcat, Km, and kcat/Km) for the NS3 were calculated (Table 2). The optimised buffer had a slightly greater catalytic efficiency (kcat/Km). Km values in case of both optimized and reference buffer have been shown by graphs (Figure 3).
    Enzyme

    K cat (S-1)

    Km (μM)

    kcat/Km (µM-1·s-1)


    NS3/3a

    RB

    OB

    RB

    OB

    RB

    OB


    0.78 0.06

    1.05 0.02

    0.09 0.006

    0.10 0.007

    8.66

    10.5


    RB: Reference Buffer; OB: Optimized Buffer
Table 2: Kinetic values for NS3 genotype 3a.
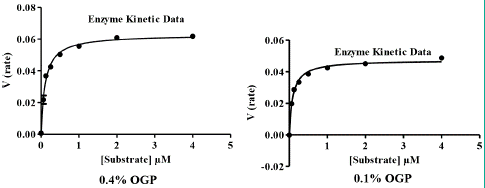
Figure 3: Graphs used to calculate Km values at different OPG concentrations.
Inhibition Measurements of NS3
Using the optimized buffer conditions, the inhibition constants (Ki) of the four inhibitors were obtained (Table 3). The Ki value was almost stayed unaffected in both buffer conditions (Figure 4). The kinetic values determined for NS3A inhibitors were found to be less in case of genotype 3a when compared with other genotypes. Among the tested inhibitors, it was found that N-1725 is about 40 times less active against genotype 3a than genotype 1a and 1b. BILN-2061 and ITMN-191 were found to be 300 times less active while VX-950 was least active against genotype 3a NS3 protease. By comparing all these inhibitors efficiencies against NS3 protease from genotype 3a, ITMN-191 and BILN-2061 were proved more potent.
Enzyme
Ki (nM)
N-1725
BILN-2061
ITMN-191
VX-950*
RB
OB
RB
OB
RB
OB
RB
OB
NS3/3a
34.0 7.17
39.1 4.43
15.8 3.71
29.2 3.27
24.2 5.91
32.9 2.90
82.9 8.20
102
4.2*Apparent Ki value due to mechanism-based inhibition RB: Reference Buffer; OB: Optimized Buffer
Table 3: Ki values of different inhibitors against NS3 genotype 3a.
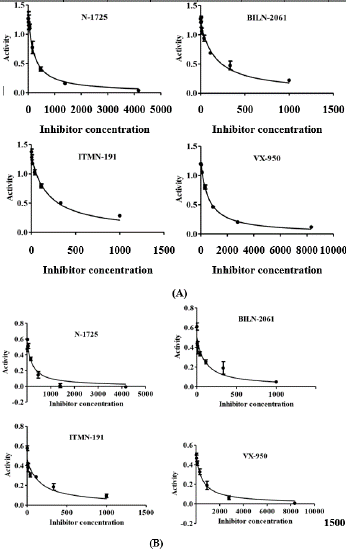
    Figure 4: Showing inhibition pattern of NS3 by different inhibitors (A) optimized buffer (B) reference buffer. N-1725 is about 40 times less active against genotype 3a than genotype 1a and 1b.

BILN-2061 and ITMN-191 were found to be 300 times less active while VX-950 was least active against genotype 3a NS3 protease.
Purification of NSB5-T
The fraction collected during different purification steps of NS5B-T were analyzed on SDS PAGE (Figure 5). The protein band was obtained at 64.7 kDa.
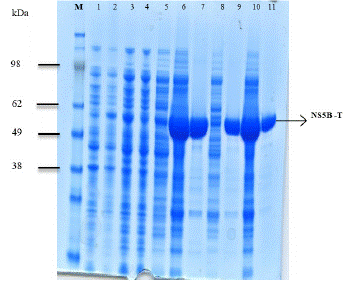
Figure 5: SDS PAGE of NS5B-T.
M: Protein molecular weight standard; lane 1: Non-expressed; lane 2: Expressed; lane 3: Lysate; lane 4: Flowthrough; lane 5; 40 mM imidazole wash; lane 6: 250 mM imidazole elution; lane 7: Dialyzed fraction; lane 8: SP-sepharose flow through; lane 9: SPsepharose elution; lane 10: Concentrated protein after vivaspin; lane 11: Gel filtered pure protein.
Thermal stability of NS5B
Thermal stability of the inhibitors with protein NS5B-T genotype 3a was assessed by DSF, which provides information about the inhibitor whether these bind to protein or not. From genotype 3a, a small variation in the melting Temperature (Tm) of NS5B was noticed. (Figure 6). In case of filibuvir binding, the melting point shift was 1°C and 0.5°C for lomibuvir binding. The data suggests the weaker binding of NS5B genotype 3a with both compounds when compared with the thermal stability of NS5B from genotype 1b. The melting points of the NS5B polymerase from genotype 3a and 1b were also assessed in the presence of inhibitors and in the absence of inhibitors (Table 4). While in case of tegobuvir, no change in melting temperature was observed.
NS5B-3a
(Tm, °C)NS5B-1b Con1
(Tm, °C)NS5B-1b BK
(Tm, °C)DMSO
46.5
46
48
filibivur
47.5
49
50.5
lomibuvir
47
49.5
51
Table 4: DSF results of NS5B-T from genotype 3a and 1b with and without inhibitors.
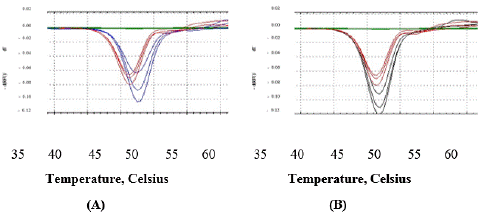
Figure 6: Comparison of thermal melting point (Tm) of NS5B-T from genotype 3a. Absence (red) and presence of inhibitor (A) filibuvir (blue); (B) lomibuvir (black).
In Vitro Inhibition of NS5B Polymerase Activity by Filibuvir and Lomibuvir
The catalytic activities and inhibition of NS5B 3a was determined by in vitro polymerase assay. Activity was also compared with the NS5B of genotype 1b. Results indicate that NS5B polymerase from both genotypes, 3a possess lesser activity as compared to genotype 1b (Figure 7). During in vitro activity in hibition assay, NS5B 3a displayed a weak inhibition by filibuvir with about 40% inhibition at 100 μM and no inhibition by lomibuvir with up to 100 μM of inhibitor concentration (Figure 8). Thus, the half maximal Inhibitory Concentration (IC50) for NS5B 3a could not be determined in case of both compounds. This directs that the compounds were not able to suppress the catalytic activity of NS5B polymerase from genotype 3a. As anticipated, both compounds displayed a good inhibitory potency against the NS5B polymerase from genotype 1b with IC50 values for filibuvir at 0.19 μM and 0.007 μM for lomibuvir (Winquist et al. 2013).
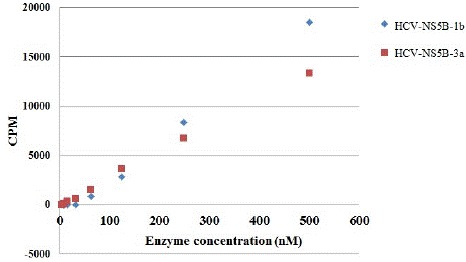
Figure 7: Catalytic activity comparison of NS5B-T. Genotype 3a (Red) and genotype 1b (Blue).
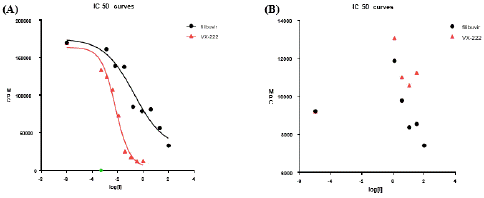
Figure 8: Inhibition of NS5B-T activity by inhibitors. (A)NS5B of genotype 1b (B) NS5B of genotype 3a; filibuvir (black circles) and lomibuvir (red triangles).
Characterization of Inhibitors Interaction with NS5B-T using SPR
SPR biosensor technology was utilized to determine the affinities and kinetic factors of filibuvir and lomibuvir interaction with NS5B polymerase of genotype 3a. These interaction activities were also compared with NS5B-T from genotype 1b. Using a conventional amine coupling process, NS5B-T was immobilized on the chip surface at a response unit level of 5000 (RU).
NS5B-T 3a showed rapid interaction kinetics with both filibuvir and lomibuvir and the interaction also reached a steady state. The data were fitted to 1:1 Langmuir interaction model with filibuvir for better description; however, a two-state reaction model was used to fit the interactions with lomibuvir, termed as induced fit (Figure 9).
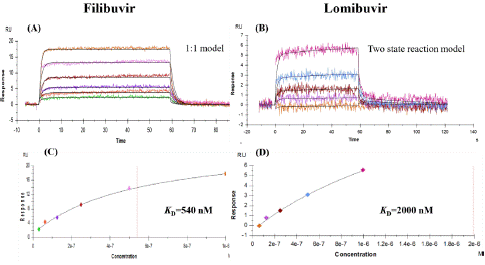
Figure 9: Sensorgrams representing interaction of NS5B-T 3a with inhibitors. (A) Filibuvir interaction with NS5B-T (B) Lomibuvir interaction with NS5B-T; C (filibuvir) and D (lomibuvir) displaying the KD values of these interactions deliberated by global non-linear regression analysis from the sensor grams.
Filibuvir's affinity for NS5B-T from genotype 3a was almost ten times lower than that of NS5B from genotype 1b. Similarly, lomibuvir has a much-reduced affinity for the NS5B-T 3a protein. The calculated interaction kinetic parameters are summed up in Table 5. The kinetic rate constants and steady state analyses were used to calculate the KD value. using Biacore T200 evaluation software. No interaction could be seen with tegobuvir.
    Filibuvir

    Lomibuvir


    1b Con1

    3a

    1b Con1

    3a


    IC50 [µM]

    0.19 µM

    >100 µM

    0.007 µM

    >100 µM


    Model

    1:1 Langmuir

    Two-step    (induced fit)


    KD [nM]a

    47 (35)

    540 (740)

    43 (25)

    >2000 (5000)


    ka [M-1s-1]

    1.833·106

    7.227·105

    2.922·106

    1.014·105


    kd [s-1]

    0.06355

    0.5352

    0.074

    0.665


    acalculated    using kinetic data in parenthesis and evaluated from steady state analysis.
Table 5: Kinetic parameters and IC50 values of filibuvir and lomibuvir binding with NS5B-T genotype 3a and 1b (subtype con 1).
Binding of NS5B with RNA and Effect of Inhibitors
Surface Plasmon Resonance (SPR) technology has been used for characterization of the interplay between RNA and NS5B-T 3a polymerase. The results of this experiment revealed that NS5B 3a has a saturation binding to biotinylated RNA, with an association rate of 8.4 105 M-1 s-1 and a dissociation rate of 0.225 s-1, resulting in a 26 nM affinity (Figure 10). The effect of inhibitor’s interference with this complex was also analyzed by mixing filibuvir and lomibuvir with NS5B-T 3a. The compound and protein mixture were injected over immobilized biotinylated RNA surface. Both compounds have been found to slightly effect the binding of NS5B 3a to biotinylated RNA, which can be observed by lowering in signal level as can be seen in Figure 11. In comparison to lomibuvir, filibuvir displayed a slightly larger effect, increasing the interaction's association rate is approximately 8-fold, while its dissociation rate is around 4-fold (Table 6). Lomibuvir has not shown to affect the NS5B 3a/RNA interaction kinetic parameters.
    NS5B-T 3a

    NS5B-T 3a + Filibuvir

    NS5B-T 3a + Lomibuvir


    Model

    1:1 Langmuir


    KD [nM]

    26

    32

    30


    ka [M-1s-1]

    8.42·105

    1.7·105

    6.25·105


    kd [s-1]

    0.225

    0.055

    0.182
Table 6: Summary of the NS5B-T 3a/RNA interaction parameters with and without compounds (filibuvir and lomibuvir).
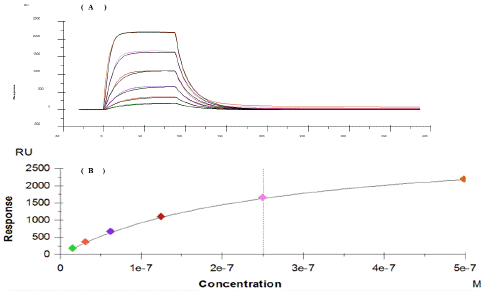
Figure 10: Sensorgram and concentration depended signals of RNA interaction with NS5B-T. (A) Blank and reference surface subtracted sensorgram for NS5B-T interaction with RNA (B) Concentration depended signals of NS5B-T with RNA.
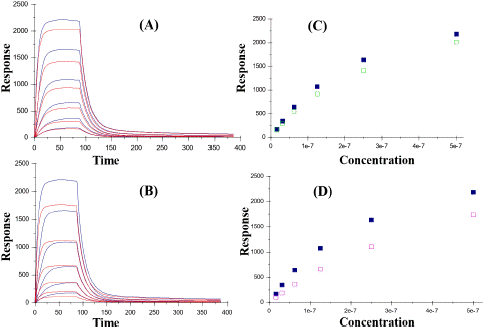
Figure 11: Aligned sensorgrams and concentration depended signals of RNA interaction with NS5B-T in absence and presence of inhibitors. (A) and (B) sensorgrams showing the relationship between NS5B-T 3a and RNA in presence of lomibuvir and filibuvir respectively. (C) and (D) concentration depended signals of NS5B-T 3a polymerase (Filled squares) and in complex with inhibitors (blank squares).
Amplification of Genes and Sequence Similarity
HCV genotype 3a strain was obtained from a Pakistani patient's blood sample synthesized viral cDNA. By using the isolated cDNA as a template, the nucleotide sequences coding was amplified for NS3 and NS5A proteins. In GenBank NCBI, the Nucleotide sequences of NS3 were deposited under accession numbers JQ676838 and NS5A were deposited under JQ676840. These sequences served as the base for the construction of the phylogenetic tree., with other genotypes of HCV and found a significant difference between sequences.
The ClustalX, version 1.83 was used for phylogenetic tree and identity were obtained from alignments of amino acid NS3 and NS5A proteins. The TreeView program used to draw the tree of protein. [A] The phylogenetic tree includes: NS3/3b (BAA08372; Amino acids 1035-1665), NS3/3a [NCBI GenBank acc. no. AFJ79449), NS3/1b (BAC54896; Amino acid 10271657), NS3/2a (BAB32872.1; Amino acid 1031-1661), NS3/2b (BAB08107; Amino acid 1031-1661)], NS3/1a (AAB66324; Amino acid 1027-1657). [B] The phylogenetic tree includes: NS5A/3b (BAA08372; Amino acid 1981-2432) NS5A/2a (AAF01178; Amino acid 1977-2442), NS5A/3a (AFJ79451),) NS5A/1a (AAB66324; Amino acid 1973-2420), NS5A/1b (AAC15725; Amino acid 1973-2419), NS5A/2b (AAF59945; Amino acid 1977-2442).
NS3, NS5A and NS5A-T Expression
His6-NS5A-T and His6-NS3, NS5A-His6intial expression in E. coli strain BL21(DE3) carried at 37OC using 1mm IPTG concentration mentioned in above methodology section. The effect of31 amino acids of the N-terminal domain on protein synthesis was also evaluated using a truncated form of NS5A-T (32-452 amino acids) (Penin et al. 2004; Moradpour et al. 2005). Significant the expression level of His6-NS5AT and His6-NS3 were obtained, low expression of NS5A-His6 was detected by SDS-polyacrylamide gel coomassie blue stainin (data not shown).
In this study the IPTG concentration ranging from 0.1-1mM. For both proteins, His6-NS5A-T and His6-NS3 bands migrating at ~46.5 and ~ 68.3kDa for respectivel. At all concentration of IPTG protein expression as soluble.
Temperature Optimization and Purification of NS3 and NS5A-T
Both NS3 and NS5A-T were purified at different temperatures in order to find out the best suitable temperature for both proteins. Both proteins show expression at all tested temperatures and the protein purified by Ni-NTA affinity chromatography by Coomassie blue staining. Homogenous and mono-disperse protein produce by gel filtration and polishing of His6-NS5A-T. At both 14°C and 25°C, greater purification yields. The His6-NS5A-T and His6-NS3 of 4.0 and 1.0 mg per litre of culture volume were achieved respectively. The purified NS5A-T and NS3 confirmed by peptide mass finger printing based mass-spectrometry method.
Activity Measurements of NS3 Produced at Various Temperatures
At different temperatures, Octyl-β-D-Glucopyranoside; OGP), His6-NS3 expressed and had identical Km A FRET-based assay was utilized to assess the activity of pure His6-NS3 generated at 14°C, 25°C, and 32°C as stated in the techniques section. When evaluated at a single detergent concentration (0.1 or 0.4% n-values. Both at OGP concentrations applied in the test buffer, at 32°C the enzyme expression had a higher specificity constant (kcat/Km) and maximum turnover number (kcat) and (Table 7). However, at various temperatures, considered the purifying yield of His6-NS3 expression, 25°C temperature appears to be the optimum for producing the most quantity of enzyme with catalytic efficiency suitable for carrying out experiments for intense inhibitor search (Table 7).
Protein
Temperature
kcat (s-1)
kcat/Km
(µM-1·s-1)kcat/Km (µM-1·s-1)
Purification yield (mg/L1)NS3 (0.1% OPG))
32 C
3.17
2.38
5.94
25 C
2.27
1.78
7.13
14 C
1.836
1.55
6.12
NS3 (0.4% OPG)
32 C
1.84
5.86
14.66
25 C
1.485
4.16
16.62
14 C
1.176
3.27
13.1
Milligrams per litre of purified protein production was calculated. (Expression medium)
Table 7: NS3 Catalytic efficiency at different temperatures.
There was a little variance in the activity of proteins produced at different temperatures, thus CD spectroscopy was used to look for any structural reforms in the protein. The CD spectra of expression NS3 proteins at various temperature were nearly comparable in the 200–240 nm wavelength range.
Structural Examination of NS3 and NS5A-T
The structure of NS5A-T and NS3 were estimated using FT-IR spectroscopy which indicates that these proteins have mixed secondary structural constituents including the alpha helical and beta sheets. The quantitative analyses of secondary structures were performed by measuring amide I region of the spectrum. NS3 structure was also built using the X-ray crystal structure of genotype 1a, as a template. In case of NS3, ~20% alpha-helix and ~ 30% beta-sheet structures were predicted which was almost similar to the homology model prediction (Table 8). In case of NS5A around ~ 30% alpha-helix and ~ 30% beta-sheet were found (Table 8). No homology model was constructed for NS5A-T due to unavailability of crystal structure for NS5A.
    Protein

    Method

    a-helix    (%)

    β-sheet (%)


    NS3

    FT-IRa

    20

    33


    Homology modelb

    25

    30


    NS5A-T

    FT-IRa

    30.5

    30
Table 8: NS5A-T-His6 and His6-NS3 by FT-IR and homology modeling for secondary structure analysis.
Discussion
HCV only infects humans and chimpanzees and due to the lack of any animal model early anti-HCV drug discovery suffered massively due to the unavailability of any system through which anti-viral compounds can be screened. This issue was partly addressed by the development of sub-genomic HCV replicons, which can yield enough viral titre in human hepatoma cell lines to evaluate the antiviral compounds [2]. A significant progress in this area has been made after getting the full length HCV virus replication in cell cultures [31]. This success has revolutionized the anti-HCV drug discovery efforts [17]. However, the replicon assays have some limitations, such as the development of complex scientific infrastructure, as well as the non-availability of truly representative replicons of various genotypes [29]. This issue has been partly addressed after getting the recombinant HCV proteins from specific genotypes, followed their activities against artificial substrates [5]. Through which various inhibitors can be screened against the activity of these proteins. This approach has been particularly proved beneficial for the early screening of compounds against HCV NS3 protease and has led the development of new anti-HCV drugs recently [17].
In a prime optimization process, an early screening of compounds is therefore preferably achieved with simple experimental systems, which are easy to handle and interpret. The choice of protein source, constructs and methods for protein production are initial considerations when establishing experimental procedures for identification and evaluation of lead compounds. For HCV protease inhibitor discovery, truncated forms of the NS3 proteins have been commonly studied, with genotype 1b being more frequently used because of its higher prevalence and drug discovery significance. However, NS3 protease of HCV genotype 3a has been far less studied or pursued as drug target [7]
This line of work was performed to discover the best available inhibitors against NS3 and NS5B proteins of genotype 3a. For this purpose, HCV RNA was separated from the blood of a patient who had genotype 3a HCV infection, cloned and expressed in bacterial expression system and purified [21]. The kinetic constants for full length NS3 were determined by FRET assay. The substrate used for this assay basically mimic the natural cleavage site of HCV polyprotein at NS4A / 4B linkage [21].
The kinetic values determined for NS3/4A inhibitors were found to be less in case of genotype 3a when compared with other genotypes (Ehrenberg et al, submitted manuscript). Among the tested inhibitors, it was found that N-1725 is about 40 times less active against genotype 3a than genotype 1a and 1b. BILN-2061 and ITMN-191 were found to be 300 times less active while VX-950 was least active against genotype 3a NS3 protease. By comparing all these inhibitors efficiencies against NS3 protease from genotype 3a, ITMN-191 and BILN-2061 were proved more potent
But question arises, why these inhibitors are less active against NS3/4A protease from HCV genotype 3a? One of the possible reasons, is the occurrence of specific mutations in NS3 genotype 3a, such as D168Q, which is caused by the substitution of aspartic acid (D168) by glutamine (Q168). It has been determined that the later amino acid unable to make salt bridging with the arginine (R155), consequently exerting the unfavorable conformational changes in the 3 dimensional protein structure, which can nullify the inhibitor binding capability with the NS3 protein of genotype 3a [11,21].
NS5B is most likely the interesting target, as it can be inhibited both at the active site as well as the allosteric sites. For studying the NS5B interaction with the inhibitors, it was expressed, purified and subsequently analyzed its binding activity with inhibitors. As expected, both compounds (lomibuvir and filibuvir) were efficacious against NS5B 1b Con 1 polymerase. However, these inhibitors were not able to produce any sort of IC50 values against NS5B 3a. This suggests that these inhibitors have no or very weak binding activity against RNA dependent RNA polymerase belonging to genotype 3a. Filibuvir's IC50 value against NS5B 3a was originally reported to be 70 times higher than that of NS5B 1b Con1 [25].
NS5B 3a's RNA-binding capacity (synthesized in vitro) in the absence as well as in the presence of inhibitors were also studied. Filibuvir has exerted significantly higher RNA binding inhibition activities of NS5B-T from genotype 1b as compared to genotype 3a. These findings are in accordance with earlier research [25].
The crystal structure of NS5B genotype 1b with bound filibuvir displayed that the inhibitor is interacting with hydrophobic residues in the thumb pocket II L419, S473 and I482 but these sites are mutated in case of genotype 3a, when we compared sequence with the genotype 1b.
SPR interaction experiments showed low binding affinity of the compounds to NS5B-T 3a. The same trend was observed in DSF experiments, showing only a minor shift of the NS5B-T 3a polymerase thermal melting point in the presence of inhibitors, suggesting their weak binding capacity (Figure 11). Notably, I482L and L419M have been reported as resistance mutations of NS5B 1b polymerase, which can cause filibuvir binding to be disrupted in SPR and replicon assays Replicon containing I482L mutation displayed 100-fold less activity of lomibuvir observed in replicon assay [30]. Therefore, we can suggest that these aforementioned mutations in NS5B/3a sequence might have significant impact on the low activity of these compounds.
By this study, it can be concluded that genotype 3a proteins NS3 and NS5B were not effectively inhibited by the tested compounds (BILN-2061, ITMN-191, N-1725 and VX-950 against NS3; filibuvir and lomibuvir against NS5B-T). The findings of this study might help to formulate new strategies for discovery and occurrence of new potent direct acting antiviral compounds which can be pursued as drug against HCV genotype 3a.
The concentration of the inducer 'IPTG' was tuned to improve the solubility and expression level of His6-NS3 and His6-NS5AT/HCV genotype 3a. For His6-NS3 and His6NS5A-T, high expression levels were reached at 1 mM and 0.5 mM IPTG concentrations, respectively. Previous research has found that utilizing pET or pBAD vector systems, appearance of NS3/HCV genotype 1a/2b/3a may be produced at 1mM IPTG or 0.002 percent L-arabinose [5,21,27], whereas NS5A/HCV genotype 1a/1b is constructed using 0.2-1mM IPTG [6,8,9,24]. In our study, both proteins expressed at different IPTG doses (0.1 to 1mM) but there is no discernible change in the levels of proteins. Although equivalent Km values for His6-NS3 were found at different temperatures, the kcat/Km constants varying to some extent. CD analysis was used to see if these discrepancies were related to alterations in the protein's general structural properties. The general structural characteristics of His6NS3 expressed at various temperatures remain intact, according to CD analysis, and the protein's cleavage efficiency is unrelated to any global structural alterations.
In the protein data bank, neither the full length NS5A of any genotype found nor the HCV NS3 genotype 3a have three-dimensional structures. Both proteins fold into components of a variety of secondary structures, as demonstrated by FT-IR analysis. The existence of 20% alpha-helix and 30% beta-sheet structures was anticipated using quantitative analysis of the NS3 spectrum. X-ray crystal structure of the genotype 1a served as a template to construct the homology model of HCV NS3 genotype 3a, yielded similar ratios [1,20]. Alpha helix and beta sheet secondary structures were found to make up about 30% of NS5A's secondary structures.
The method used to manufacture milligram amounts of pure NS3 and NS5A presented here should enable for thorough biochemical and biophysical characterization as well as the testing of HCV infection-fighting inhibitors, particularly genotype 3a.
Conclusion
In this study, we improved conditions for HCV genotype 3a over-expression of NS3 and NS5A. The upregulated NS3 and NS5A were achieved t 25oC and doses were 0.25 and 1 millimolar. The yield of pure NS3 protein produced is four times greater than previously reported. The purified NS3 quantity along with its catalytic efficiency indicated that the optimal temperature for over-expression is 25°C. At different temperatures NS3 expressed and was found to be unrelated to changes in the protein's global structural characteristics using Circular Dichroism spectroscopy. Furthermore, Fourier Transform Infrared Spectroscopy research reveals that both NS3 and NS5A contain alpha-helical and beta sheet structures, with the proportion of alpha-helical and beta sheet structures in NS5A being about equal. The ability to characterize NS3 and NS5A Will aid in the development of new ways to combat HCV infection.
Author Statements
Availability of Data and Materials
Availability of data and materials on request by corresponding author.
Competing Interests
The authors have no competing interest.
Author’s Contribution
All authors contribute equally in his manuscript.
References
- Appleby TC, Anderson R, Fedorova O, Pyle AM, Wang R, Liu X, et al. Visualizing ATP-dependent RNA translocation by the NS3 helicase from HCV. Journal of molecular biology. 2011; 405: 1139–53.
- Bartenschlager R. Hepatitis C virus replicons: potential role for drug development. Nature Reviews Drug Discovery. 2002; 1: 911–6.
- Dahl G. Kinetic studies of NS3 and NS5B from Hepatitis C virus: Implications and applications for drug discovery. Acta Universitatis Upsaliensis. 2009.
- Deuffic-Burban S, Mohamed MK, Larouze B, Carrat F, Valleron A-J. Expected increase in hepatitis C-related mortality in Egypt due to pre-2000 infections. Journal of hepatology. 2006; 44: 455–61.
- Fatima K, Tahir M, Qadri I. Development of robust in vitro serine protease assay based on recombinant Pakistani HCV NS3–4A protease. Virus research. 2011; 160: 230–7.
- Foster TL, Belyaeva T, Stonehouse NJ, Pearson AR, Harris M. All three domains of the hepatitis C virus nonstructural NS5A protein contribute to RNA binding. Journal of virology. 2010; 84: 9267–77.
- Geitmann M, Dahl G, Danielson UH. Mechanistic and kinetic characterization of hepatitis C virus NS3 protein interactions with NS4A and protease inhibitors. Journal of Molecular Recognition. 2011; 24: 60–70.
- Huang L, Sineva EV, Hargittai MR, Sharma SD, Suthar M, Raney KD, et al. Purification and characterization of hepatitis C virus non-structural protein 5A expressed in Escherichia coli. Protein expression and purification. 2004; 37: 144–53.
- Ivanov AV, Korovina AN, Tunitskaya VL, Kostyuk DA, Rechinsky VO, Kukhanova MK, et al. Development of the system ensuring a high-level expression of hepatitis C virus nonstructural NS5B and NS5A proteins. Protein expression and purification. 2006; 48: 14–23.
- Khan M, Rauf W, Habib F, Rahman M, Iqbal S, Shehzad A, et al. Hesperidin identified from Citrus extracts potently inhibits HCV genotype 3a NS3 protease. BMC complementary medicine and therapies. 2022; 22: 1–18.
- Lenz O, Verbinnen T, Lin T-I, Vijgen L, Cummings MD, Lindberg J, et al. In vitro resistance profile of the hepatitis C virus NS3/4A protease inhibitor TMC435. Antimicrobial agents and chemotherapy. 2010; 54: 1878–87.
- Lescar J, Luo D, Xu T, Sampath A, Lim SP, Canard B, et al. Towards the design of antiviral inhibitors against flaviviruses: the case for the multifunctional NS3 protein from Dengue virus as a target. Antiviral research. 2008; 80: 94–101.
- Liguori G, Gallé F, Marinelli P. Epidemiology of hepatitis C virus infection in the world, Europe, Italy and Campania: an overview. Italian Journal of Public Health. 2012; 1.
- Lohmann V, Körner F, Herian U, Bartenschlager R. Biochemical properties of hepatitis C virus NS5B RNA-dependent RNA polymerase and identification of amino acid sequence motifs essential for enzymatic activity. Journal of virology. 1997; 71: 8416–28.
- Mazhar F, Saif S, Mazhar M, Tahir H, Raza A, Ijaz A, et al. Role of Alpha Fetoprotein in hepatocellular carcinoma. 2022.
- Mazhar MW. Antioxidant and protective effect of andldquo; Artemesia absinthiumandrdquo; and andldquo; Nigella sativa andrdquo; on Albino mice mode of hepatic injury. Journal of Basic and Clinical Pharmacy. 2022; 13: 618582.
- Mullard A. 2011 FDA drug approvals: the US FDA approved 30 new therapeutics last year, including 11 first-in-class agents. Nature Reviews Drug Discovery. 2012; 11: 91–6.
- Natarajan S. NS3 protease from flavivirus as a target for designing antiviral inhibitors against dengue virus. Genetics and molecular biology. 2010; 33: 214–9.
- Papatheodoridis G, Hatzakis A. Public health issues of hepatitis C virus infection. Best practice & research Clinical gastroenterology. 2012; 26: 371–80.
- Ploss A, Evans MJ. Hepatitis C virus host cell entry. Current opinion in virology. 2012; 2: 14–9.
- Poliakov A, Hubatsch I, Shuman CF, Stenberg G, Danielson UH. Expression and purification of recombinant full-length NS3 protease–helicase from a new variant of Hepatitis C virus. Protein expression and purification. 2002; 25: 363–71.
- Raza A, Mazhar MW, Saif S, Noor S, Sikandar M, Shahzadi I, et al. Prevalence of hepatitis B virus infection among persons with hepatitis D virus and diabetes mellitus in Pakistan, 2019-2021. Archives of Hepatitis Research. 2022; 8: 001–4.
- Razavi H. Global epidemiology of viral hepatitis. Gastroenterology Clinics. 2020; 49: 179–89.
- Shelton H, Harris M. Hepatitis C virus NS5A protein binds the SH3 domain of the Fyn tyrosine kinase with high affinity: mutagenic analysis of residues within the SH3 domain that contribute to the interaction. Virology Journal. 2008; 5: 1–9.
- Shi ST, Herlihy KJ, Graham JP, Nonomiya J, Rahavendran SV, Skor H, et al. Preclinical characterization of PF-00868554, a potent nonnucleoside inhibitor of the hepatitis C virus RNA-dependent RNA polymerase. Antimicrobial agents and chemotherapy. 2009; 53: 2544–52.
- Simmonds P, Tuplin A, Evans DJ. Detection of genome-scale ordered RNA structure (GORS) in genomes of positive-stranded RNA viruses: Implications for virus evolution and host persistence. Rna. 2004; 10: 1337–51.
- Thibeault D, Bousquet C, Gingras R, Lagacé L, Maurice R, White PW, et al. Sensitivity of NS3 serine proteases from hepatitis C virus genotypes 2 and 3 to the inhibitor BILN 2061. Journal of virology. 2004; 78: 7352–9.
- Thursz M, Fontanet A. HCV transmission in industrialized countries and resource-constrained areas. Nature reviews Gastroenterology & hepatology. 2014; 11: 28–35.
- Woerz I, Lohmann V, Bartenschlager R. Hepatitis C virus replicons: dinosaurs still in business? Journal of viral hepatitis. 2009; 16: 1–9.
- Yi G, Deval J, Fan B, Cai H, Soulard C, Ranjith-Kumar C, et al. Biochemical study of the comparative inhibition of hepatitis C virus RNA polymerase by VX-222 and filibuvir. Antimicrobial agents and chemotherapy. 2012; 56: 830–7.
- Zhang Y, Weady P, Duggal R, Hao W. Novel chimeric genotype 1b/2a hepatitis C virus suitable for high-throughput screening. Antimicrobial agents and chemotherapy. 2008; 52: 666–74.