Research Article
Austin J Pharmacol Ther. 2014; 2 (2). 1013
Improving the Efficacy of Cisplatin in Colon Cancer HT– 29 Cells via Combination Therapy with Selenium
Stockert A1*, Kinder D1, Christ M2, Amend K3, Aulthouse A4
1Department of Pharmaceutical and Biomedical Sciences, Raabe College of Pharmacy, Ohio Northern University, Ada, OH
2Mount Carmel Health System, Columbus, OH
3Physicians Assistant Program, University of Saint Francis, Fort Wayne, IN
4Department of Biological Sciences and Allied Health, Getty College of Arts and Sciences, Ohio Northern University, Ada, OH
*Corresponding author: : Amy Stockert, Department of Pharmaceutical and Biomedical Sciences, Raabe College of Pharmacy, Ohio Northern University, Ada, OH
Received: February 03, 2014; Accepted: February 10, 2014; Published: February 13, 2014
Abstract
Cis–platinum is generally not effective against slow growing colon cancer. Glutathione peroxidase is a seleno–enzyme that inactivates reactive oxygen species (ROS). Research suggests that high levels of ROS may alter cisplatinum efficacy. The effect of selenite supplementation during cis–platinum treatment in HT–29 colon cancer cells was explored. Agarose culture allowed cells to grow in 3D, form colonies, as well as allow independent analysis of mitosis, cell viability, and ROS breakdown. Single cells were suspended in agarose and grown 7 days. Cultures were un– or pre– treated with selenite at day 0. On day 4, cultures were treated with cis–platinum alone or in conjunction with selenite. At 7 days, cell viability and mitotic activity were evaluated. ROS breakdown was quantified using an assay of glutathione peroxidase activity. Selenite at low doses did not affect cell viability or mitosis. Cultures treated with the selenite ⁄ cis–platinum combination exhibited higher ROS breakdown and increased cis–platinum efficacy. Where colonies are already formed, cisplatinum alone was not as effective as the cis–platinum ⁄ selenite combination. Additionally, ROS breakdown was increased in cells treated with the cisplatinum ⁄ selenite combination suggesting a link between ROS levels and cisplatinum efficacy.
Introduction
The debate regarding selenium and cancer has remained unresolved [1,2]. Research has been completed examining the cancer preventative affects of selenium and have suggested a preventative role for selenium while others concluded that there is no preventative effect [3–7]. In addition to these differences, clinical evidence demonstrates that some cancers are more resistant to traditional therapies such as cis–platin (cis–pt), thus necessitating improved therapeutic options either through combination therapy. Slow growing coloncancer cell lines are among those that have greater tendencies to develop resistance and are less susceptible to cis–pt and other metalcoordination therapies [8–10]. Strong evidence suggests that selenium supplementation with chemotherapeutic agents can decrease the nephrotoxicity from these drugs [11–14]. Similarly, selenium seems to play some role in decreasing the development of resistant cell lines [15–18].
Selenium is linked to a decrease in oxidative damage due to its role in the selenoenzyme glutathione peroxidase. Glutathione peroxidase (GPox) is responsible for the breakdown of hydrogen peroxide into water via the oxidation of reduced glutathione. A flavin dependent enzyme, glutathione reductase is responsible for regenerating the reduced form of glutathione using NADPH as an electron donor. It is expected that selenite supplementation would increase the availability of glutathione peroxidase among other selenium dependent enzymes [19,20].
The majority of the studies thus far have focused on how to either increase reactive oxygen species (ROS) selectively in cancer cells or manage ROS in normal cells thereby protecting them from damage [21–24]. Here we present data suggesting that controlling the amount of ROS in cancer cells may improve the efficacy of cis–pt in colon cancer cell line HT–29. We examined the effects of selenite on the colon cancer cell line HT–29 pre–treated with selenite (sodium selenite) and co–treated with selenite (sodium selenite) and cis–pt. Although it has been demonstrated by this study that cis–pt is capable of blocking proliferation when administered at plating, we were able to show that cis–pt is not as effective when given after colonies have had the opportunity to form. Unfortunately, this loss in effectiveness observed once colonies have formed is the situation that is most physiologically significant. Chemotherapeutics would only be administered after cancerous polyps has developed. Our study demonstrates that combination therapy of cis–pt and selenite increases the number of dead cells found in colonies even when administered after colonies have had the chance to form, making cis–pt a potentially viable option for colon cancer patients despite previous studies suggesting it is not an appropriate first line treatment. Although we hypothesized that pre–treatment with selenite would have this effect, and this was not observed in our study to the extent that co–treatment was effective, co–treatment of se with cis–pt is the clinically relevant treatment regimen.
Materials and Methods
Monolayer culture
HT–29 colon adenocarcinoma cell line was purchased from American Tissue Culture Collection (ATCC). Cells were grown with standard monolayer culture techniques at 37° C in a humidified CO2 incubator. The media consisted of Dulbecco’s modified Eagle’s media (DMEM) with 4.5 gm⁄l glucose containing 10% fetal calf serum and 0.1% penicillin–streptomycin. Monolayer culture was used to establish IC50, to give a starting dose for agarose experimentation, and to expand the cell line.
XTT assay for determining IC50 values
Studies to determine the IC50 values of cis–pt in the HT–29 cell lines were conducted using the XTT assay according to manufacturer’s specification (Sigma–Aldrich). Na2SeO4 and cis–pt were purchased from Sigma–Aldrich. All treatment compounds were dissolved in dimethylsulfoxide (DMSO) and mixed with media prior to adding to cell cultures. DMSO concentration in cell culture did not exceed 0.1%. The XTT assay, which measures mitochondrial activity, was used to determine IC50 values for the cis–pt. The assay was conducted according to manufacturer’s directions, and results are reported as percent of control.
Agarose Cell Culture Methods
HT29 cells were grown in monolayer and then suspended inagarose. Details of this agarose method are described in Kinder andAulthouse 2004 [25]. In brief, 10µl of single cell suspension (5x10⁵ cells in 1ml of 0.5% low temperature agarose) were plated on 35 mm tissue culture dishes which were previously coated with high temperature agarose. The cell⁄agarose suspension was allowed to gel and were grown for 7 days. The cultures were fed⁄treated at plating (day 0) and at day 4 with complete media change. Cultures fed DMEM only served as controls and cultures treated with dimethylsulfoxide (DMSO) served as vehicle controls. Final DMSO concentration was 0.1% in all cultures. The cultures were treated with Na2SeO4 or cis–pt (prepared as for monolayer above). The media consisted of Dulbecco’s modified Eagle’s media (DMEM) with 4.5 gm⁄l glucose containing 10% fetal calf serum and 0.1% penicillin–streptomycin.
Rationale for using the agarose cell culture method
The use of the agarose cell culture provides several advantages over monolayer culture. Long term experiments, up to two weeks, can be conducted. Plating of single cells suspended in agarose allows analysis of both cytotoxicity (trypan blue exclusion) and mitotic activity (number and size of cell clusters). In addition, this culture method is amiable to determine enzyme function.
Control (DMEM only) and vehicle control (VC, DMSO) cultures were established for each experiment and for all treatment groups (n=6 for each treatment group). All cultures were analyzed for viability using the trypan blue exclusion assay and for mitotic activity by counting both single cells and cell colonies (clusters of 2 or more cells) using an Olympus IM inverted microscope. Cultures were examined on day 4 and day 7. For analysis on day 7, the cultures were first centered at 4x and then counted at 10x to prevent bias. Approximately 30% of the cell culture was evaluated. The amount of single cells and cell colonies alive and dead, between treatment groups were analyzed using a t–test and controlled for overall error using a modified Bonferroni.
Reactive oxygen species breakdown assa
ROS breakdown was determined using the Total ROS detection kit available from Enzo. Cells were collected from agarose culture by homogenizing the agarose cell mixture in lysis buffer supplied by the assay kit. Correlation from absorbance values to ROS breakdown was determined as specified by the manufacturer.
Results
In order to estimate appropriate cis–pt concentrations for experiments, the IC 50 for cis–pt was determined in the HT–29 cell line. Using the XTT assay in monolayer culture we estimated an IC50 of 70µM. The XTT assay can be used as an indication of cell growth inhibition, but does not answer the question of cytotoxicity. HT–29 cells grown in monolayer were treated with selenite (as Na2SeO4) at increasing concentrations. Selenite is not considered a cytotoxic agent, but has an LD50 in rats of 1.6 mg⁄kg. At 29 µg⁄ml, the number of cells present had dropped to 80% compared to control. The results of the monolayer studies suggest there is a cytostatic or a cytotoxic component to selenite at higher concentrations.
Supplementation with selenite: cell growth inhibition and cell death in agarose
In order to determine the minimum concentration of selenite that was required to observe an effect, but not high enough to contribute to cell death, we completed a dose response in agarose culture. This was a necessary step since values estimated in monolayer are often not representative of those observed in agarose culture. The dose response of the HT–29 cells to selenite was completed by treating cells continuously for 7 days with selenite concentrations of 0.75, 1.5, 3, 6, 11, 23, and 45 µg⁄ml (data not shown). Based on this data we determined that the original concentration of selenite was high enough at all doses tested to result in increased cell death. We repeated the experiment at lower concentrations.
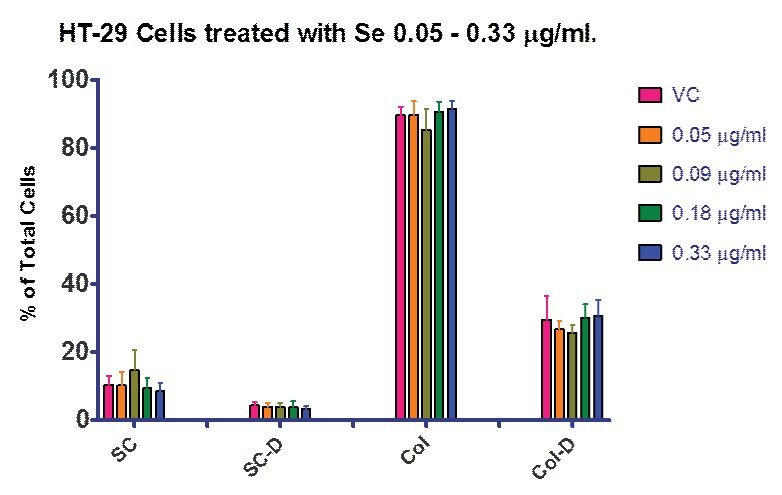
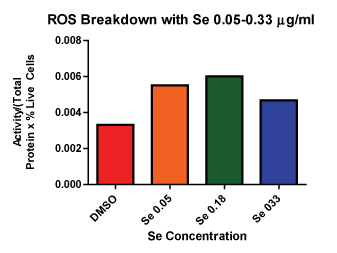
Figure 1 shows the results for the lower dose response with selenite including 0.05, 0.09, 0.18 and 0.33 µg⁄ml. This data allowed us to determine the highest dose tested that did not show significant cell death from selenite alone. Although it was possible that we could have increased the selenite dose beyond 0.33 µg⁄ml and still not have contributed to cell death, our data examining ROS breakdown indicated that a dose of 0.05 µg⁄ml was sufficient to increase selenite enzyme function over control (Figure 2). Based on this data we progressed forward with 0.33 µg⁄ml selenite in the combination experiments, since it was enough to increase GPox activity and still not contribute to cell death.
Figure 1: Dietary Supplementation with selenite. Treatment of HT–29 cells with selenite from 0.05 – 0.33 µg⁄ml (0.29–1.9 µM). There were no statistically significant differences noted between treatment groups. VC = vehicle control; SC = single cells; SC-D = single dead cells; Col = cell colony; Col–D = colonies containing dead cells. Data is presented as a percentage of total cells.
Figure 2: ROS Breakdown with Se Se 0.05 and 0.18 µg⁄ml shows more ROS breakdown compared to control.
Treatment with cis–pt
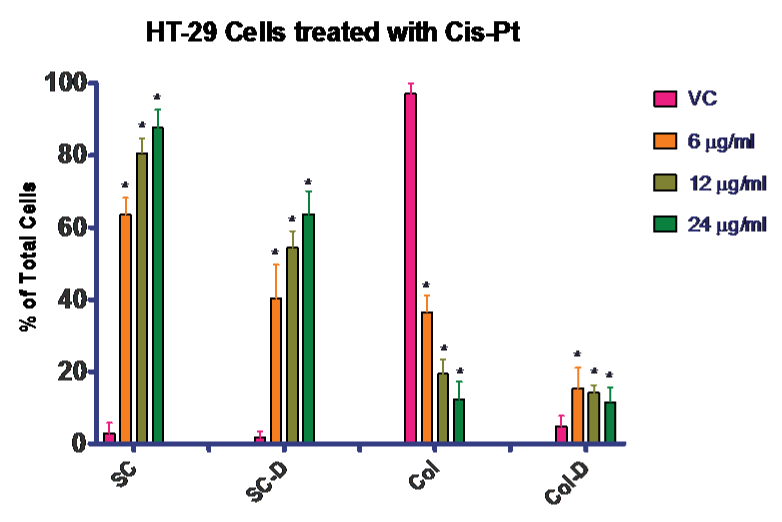
Next we completed a dose response for the HT–29 cells with cis–pt in agarose culture. Again it was necessary to complete the dose response rather than compare to literature because the cells were grown in the three–dimensional agarose culture model, which is physiological. Concentrations of 6, 12, and 24 µg⁄ml cis–pt were compared to vehicle control. The data for this experiment is presented in (Figure 3). There was a statistically significant increase in cell death for all concentrations tested compared to control. By using both the trypan blue exclusion assay and cell counting, we were able to confirm that proliferation was stopped at all the concentrations of cis–pt tested. This can be confirmed by comparing the number of live single cells (untreated) to the increased number of treated dead single cells with less colony formation in the treated cultures. Figure 3 shows that when untreated the majority of the cells become colonies with very few of those colonies containing dead cells.
Figure 3: Effectiveness of Cis–Pt on HT–29 colon cancer cells. Treatment of HT–29 cells with Cis–Pt. Treatment with any of these concentrations blocked proliferation as seen in the number of single cells present at day 7, with a concomitant rise in number of dead cells both in single cells and colonies. VC = vehicle control; SC = single cells; SC–D = single dead cells; Col = cell colony; Col–D = colonies containing dead cells. Data is presented as a percentage of total cells.
We also examined the ROS breakdown (as determined by GPox activity) for the cis–pt treated cultures. Slight increases were observed, as expected, indicative of increased ROS production due to cis–pt treatment (data not shown). Our goal was to mimic the clinically significant treatment regimen. Using the agarose culture method , we were able to examine effects of treatment at plating compared to cultures which were treated after colony formation, which more closely represents the formation of a cancerous polyp. In order to accomplish this we compared two cis–pt doses, 12 and 24 µg⁄ml, with multiple treatment regimens. In one experiment we treated cell continuously with cis–pt starting at plating (day 0) until day 7, when cells were counted and assayed for viability.
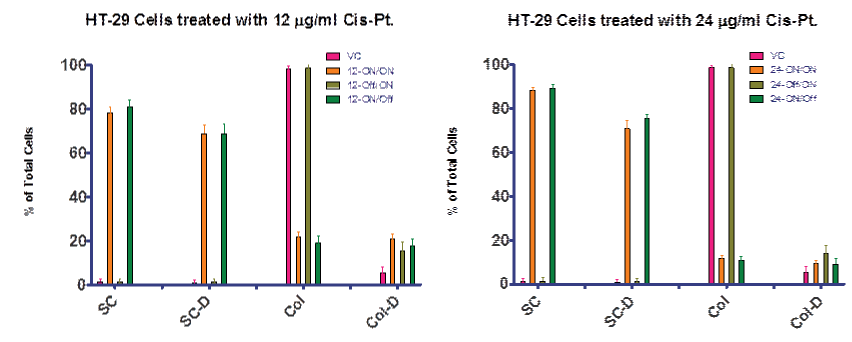
Figure 4A shows the data for continuous treatment as “ON/ON” indicating that treatment was ON during both the day 0–4 interval and the day 4–7 interval. In a second experiment, we allowed cells to grow without treatment day 0–4, and then with the midpoint media change, added cis–pt for day 4–7. Figure 4B summarized this second experiment by indicating that treatment was Off during the day 0–4 interval and ON during the day 4–7 interval. A third experiment was completed in which treatment was ON during the day 0–4 interval and Off during the day 4–7 interval. This data demonstrates that cis–pt is more effective if given at the time of plating (day 0).
Figure 4A and 4B: Treatment regimines for two concentrations of cis–pt. Data presented as ON⁄ON indicates treatment was present during the day 0–4 interval and the day 4–7 interval. OFF/ON indicated treatment was not present until the day 4–7 interval. ON⁄OFF indicates that treatment was present during the day 0–4 interval but not during the day 4–7 interval. Treatment of HT–29 cells with Cis–Pt showed greatest effect on cell kill before colonies were allowed to form. However, treatment with Cis–Pt inhibited the formation of colonies when cells were exposed to the drug upon setting the plates. The results from the 12 and 24 µg⁄ml treatments were similar. VC = vehicle control; SC = single cells; SC–D = single dead cells; Col = cell colony; Col–D = colonies containing dead cells. Data is presented as a percentage of total cells.
Figure 5 shows ROS breakdown for each of these cultures, which was considerable higher for cultures that were treated with cis–pt during the day 0–4 interval. Less ROS breakdown, although not significantly less than with control, was observed in cultures that were treated once colonies were allowed to form (day 4–7). Data from these experiments presented in Figure 5 combined with analysis of the cell mitotic activity and viability Figure 4 suggests that cis–pt is not effective when given after colony formation. Furthermore, these data suggest that the activity of cis–pt is related to the level of ROS present during treatment times.
Figure 3: ROS Breakdown with Cis–Pt For both Cis–Pt concentrations, less ROS breakdown compared to control was observed when colonies were allowed to form prior to Cis–Pt treatment (clinically relevant). Where cells were treated at plating prior to colony formation, ROS breakdown was increased relative to control.
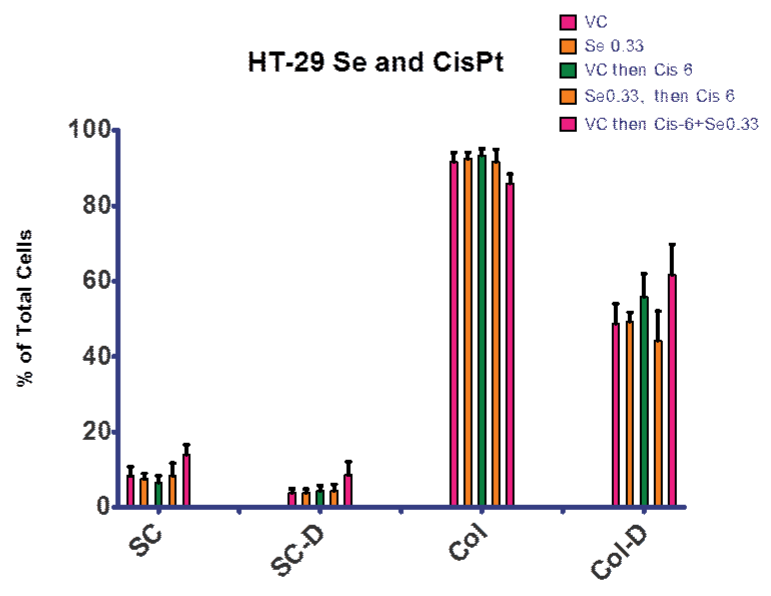
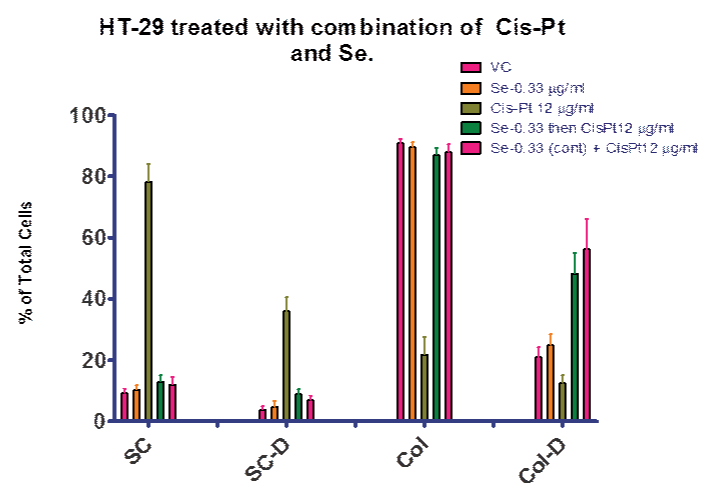
In order to examine our hypothesis (control of ROS levels would increase efficacy of cis–pt), we explored treatment regimens including selenite. Figures 6 and 7 summarize the experiments that compared selenite or cis–pt individual treatment with the combination treatment. These combination treatments explored both pre–treatment with elenite (day 0–4) followed by cis–pt alone day 4–7 and continuous treatment with selenite and cis–pt (day 0–7). As seen in Figure 6, there was no significant difference between the control and cultures treated with selenite or cis–pt (6 µg⁄ml). However, if colonies were allowed to form first (day 0–4), then combination treatment followed, there was a significant difference from vehicle control. Figure 7 shows similar results for the 12 µg⁄ml cis–pt. The number of colonies containing dead cells was higher compared to cis–pt alone when either pre–treated with selenite followed by cis–pt or when treated in combination. When co–treatment was used the difference was larger as compared to cis–pt alone.
Figure 6: Treatment with Se and Cis–Pt. There was no significant difference between VC and cultures treated with 0.33 µg⁄ml Se or 6 µg⁄ml Cis–Pt. There was a significant difference from VC if colonies formed prior to a combination treatment. There was a significant increase in single cells both alive and dead, a significant decrease in live colonies and significant increase in dead colonies . VC = vehicle control; SC = single cells; SC–D = single dead cells; Col = cell colony; Col–D = colonies containing dead cells. Data is presented as a percentage of total cells.
Figure 7: Se then (or and) Cis–Pt Cis–Pt blocked mitosis when treated at day 0. Se and Cis–Pt combinations increased the number of dead colony cells when compared to no selenite at all. VC = vehicle control; SC = single cells; SC–D = single dead cells; Col = cell colony; Col–D = colonies containing dead cells. Data is presented as a percentage of total cells.
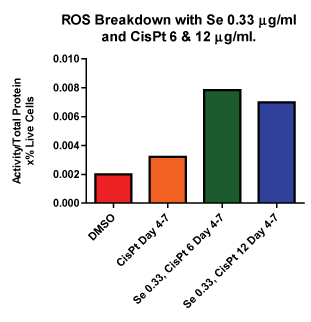
Next we compared ROS breakdown activity for these cultures (Figure 8). Figure 8 shows the combination therapy for both cispt concentrations. Pre–treatment with selenite followed by cis–pt at both concentrations was also examined (data not shown). These data confirm that in combination therapy there is more ROS breakdown as compared to control or cis–pt alone, which agrees well with the data presented in (Figures 6 and 7). Likewise, there was also an increase inROS breakdown for cultures that were pretreated with selenite (data not shown) but this difference was not significant.
Figure 8: ROS Breakdown with Se and Cis–Pt Se combined with both concentrations of Cis–Pt showed increased ROS breakdown compared to control. ROS breakdown was increased compared to control in all samples treated with both Se and Cis–Pt.
Conclusion
Results from this study confirm that at all doses tested, cis–pt was effective at decreasing mitotic activity and cell viability when administered prior to colony formation. More importantly, our data shows that when colonies were able to form before treatment, less cis–pt cytoxicity was observed. We were also able to correlate the decreased cytoxicity to a decrease in ROS breakdown. Using dose response studies we confirmed that at optimal selenite concentrations (0.05 to 0.33 µg⁄ml), there was no cytotoxcity observed with selenite treatment alone and ROS breakdown still occurred. This data suggests that the selenite concentrations used were not contributing to cell death, yet the ROS breakdown was still occurring. This dose response observation is important because selenium supplementation will contribute to the ROS pool and will therefore require more ROS breakdown. Since our dose of selenium at which the cells were treated did not contribute significantly to cell death, we were confident that the cell death was not related to the increased ROS pool. Based on our results, we conclude that the increase in cell death observed was due tothe co–treatment with selenite and cis–pt, not due to excessive selenite, which if high enough will cause cell death alone. When considered with the cis–pt selenite combination data, the potential link between cis–pt efficacy and ROS breakdown stands out. Supporting this observation is the data showing clearly that cytotoxicity is increased when the selenite cis–pt therapy was given, even after colonies were formed.
There are a number of possible explanations for the observed effects of the co–treatment ranging from increases in various selenoprotein levels to increased availability of cis–pt that may have been bound to glutathione. One of the more common or well studied mechanistic possibilities is change in the level of selenoenzyme thioredoxin reductase 1, which when treated with cis–pt appears to increase insertion of an essential selenocysteine residue [26]. Another explanation is that low dose selenium could be inhibiting repair of the DNA strand breaks induced by cis–pt, similar to what has been observed with resveratrol [27,28]. More generally, research has shown that uncoupling protein 2 expression, which would also alter ROS levels, relates to cis–pt cytoxicity [24]. The mechanism by which selenite and cis–pt co–treatment increase cell death after colony formation is unknown and further studies are required to elucidate said mechanism, however, the above mentioned possibilities representplausible starting points.
Our data clearly show that the combination therapy was more effective at killing cells in existing colonies. This finding is important because existing colony formation relates more closely to the clinically significant existing cancer. We were also able to show that pretreatment was able to increase the number of colonies with dead cells but only if the selenite treatment was continued in conjunction with cis–pt treatment after colony formation. These data suggest that pretreatment is not necessary because we also observed that cells that were pre–treated with selenite and then treated with cis–pt were not killedas easily as those that were only treated with combination therapy days 4–7. Our data suggest a potential for therapeutic application for co–treatment. Although typically, cis–pt is not a first line treatment in colon cancer, if used in conjunction with selenite it may prove useful. More studies are needed in order to complete the translation of this potential therapy to bedside and our study highlights the importance of completing such studies.
Abbreviations
VC = vehicle control; SC = single cells; SC–D = single dead cells; Col = cell colony; Col–D = colonies containing dead cells; ROS = reactive oxygen species; Cis–Pt = cis–platinum; GPox = glutathione peroxidase; Se = selenite.
Acknowledgements
We would like to thank the Department of Biological and Allied Health Sciences, the department of Pharmaceutical and Biomedical Sciences, and Ohio Northern University for the funding of the project. Additionally we would like to thank former Ohio Northern students Margaret Rowland, Rob Reichenbach, Brad Petersen, and Katherine Lui for their work on the project.
Conflicts of interest
The authors and participating students have no conflicts of interest.
References
- Brozmanová J, Mániková D, VlÃková V, Chovanec M. Selenium: a double-edged sword for defense and offence in cancer. Arch Toxicol. 2010; 84: 919-938.
- Muecke R, Schomburg L, Buentzel J, Kisters K, Micke O. German Working Group Trace Elements and Electrolytes in Oncology. Selenium or no selenium--that is the question in tumor patients: a new controversy. Integr Cancer Ther. 2010; 9: 136-141.
- Glavas-Obrovac, et al. Anticancer effects of selenium compounds on human colonic carcinoma cells. Acta Aliment Hung. 2000; 29(3): 295-306. ://000088769400008
- Combs, Clark, and Turnbull. Cancer prevention by selenium. Metal Ions Biol Med. 2002; 7: 600-603. ://000183835700124
- Combs GF Jr, Gray WP. Chemopreventive agents: selenium. Pharmacol Ther. 1998; 79: 179-192.
- Harrison PR, Lanfear J, Wu L, Fleming J, McGarry L. Chemopreventive and growth inhibitory effects of selenium. Biomed Environ Sci. 1997; 10: 235-245.
- Jung HJ, Seo YR. Current issues of selenium in cancer chemoprevention. Biofactors. 2010; 36: 153-158.
- Fink D, Nebel S, Aebi S, Zheng H, Cenni B. The role of DNA mismatch repair in platinum drug resistance. Cancer Res. 1996; 56: 4881-4886.
- Van de Vrie W, Van der Heyden SA, Gheuens EE, Bijma AM, De Bruijn EA. Drug resistance in rat colon cancer cell lines is associated with minor changes in susceptibility to cytotoxic cells. Cancer Immunol Immunother. 1993; 37: 337-342.
- Scanlon KJ, Kashani-Sabet M, Tone T, Funato T. Cisplatin resistance in human cancers. Pharmacol Ther. 1991; 52: 385-406.
- Ali BH, Al Moundhri MS. Agents ameliorating or augmenting the nephrotoxicity of cisplatin and other platinum compounds: a review of some recent research. Food Chem Toxicol. 2006; 44: 1173-1183.
- Fujieda M, Naruse K, Hamauzu T, Miyazaki E, Hayashi Y. Effect of selenium on Cisplatin-induced nephrotoxicity in rats. Nephron Exp Nephrol. 2006; 104: e112-122.
- Antunes LM, Darin JD, Bianchi Nde L. Effects of the antioxidants curcumin or selenium on cisplatin-induced nephrotoxicity and lipid peroxidation in rats. Pharmacol Res. 2001; 43: 145-150.
- Hu YJ, Chen Y, Zhang YQ, Zhou MZ, Song XM. The protective role of selenium on the toxicity of cisplatin-contained chemotherapy regimen in cancer patients. Biol Trace Elem Res. 1997; 56: 331-341.
- Schroeder CP, Goeldner EM, Schulze-Forster K, Eickhoff CA, Holtermann P. Effect of selenite combined with chemotherapeutic agents on the proliferation of human carcinoma cell lines. Biol Trace Elem Res. 2004; 99: 17-25.
- Trbojevic, et al. Effects of Cisplatin on Lipid Peroxidation and the Glutathione Redox Status in the Liver of Male Rats: The Protective Role of Selenium. Arch Biol Sci. 2010; 62(1): 75-82. ://000277610000010
- Sasada T, Nakamura H, Ueda S, Sato N, Kitaoka Y. Possible involvement of thioredoxin reductase as well as thioredoxin in cellular sensitivity to cis- diamminedichloroplatinum (II). Free Radic Biol Med. 1999; 27: 504-514.
- Caffrey PB, Frenkel GD. Selenium compounds prevent the induction of drug resistance by cisplatin in human ovarian tumor xenografts in vivo. Cancer Chemother Pharmacol. 2000; 46: 74-78.
- Wu X, Huang K, Wei C, Chen F, Pan C. Regulation of cellular glutathione peroxidase by different forms and concentrations of selenium in primary cultured bovine hepatocytes. J Nutr Biochem. 2010; 21: 153-161.
- Gan L, Liu Q, Xu HB, Zhu YS, Yang XL. Effects of selenium overexposure on glutathione peroxidase and thioredoxin reductase gene expressions and activities. Biol Trace Elem Res. 2002; 89: 165-175.
- Acharya A, Das I, Chandhok D, Saha T. Redox regulation in cancer: a double- edged sword with therapeutic potential. Oxid Med Cell Longev. 2010; 3: 23- 34.
- Caputo F, Vegliante R, Ghibelli L. Redox modulation of the DNA damage response. Biochem Pharmacol. 2012; 84: 1292-1306.
- Kralova, Cervinka, and Rudolf. ROS mediate selenite-induced apoptosis in colon cancer cells. Cent Eur J Biol. 2010; 5(2): 166-177. ://000275141000004
- Santandreu FM, Roca P, Oliver J. Uncoupling protein-2 knockdown mediates the cytotoxic effects of cisplatin. Free Radic Biol Med. 2010; 49: 658-666.
- Kinder DH, Aulthouse AL. MCF-7 breast cancer cell line grown in agarose culture for study of COX-2 inhibitors in three-dimensional growth system. Cancer Lett. 2004; 205: 49-53.
- Peng, Xu, and Arner. Thiophosphate and selenite conversely modulate cell death induced by glutathione depletion or cisplatin: effects related to activity and Sec contents of thioredoxin reductase. Biochem J. 2012; 447: 167-174. ://000309489600017
- Abul-Hassan KS, Lehnert BE, Guant L, Walmsley R. Abnormal DNA repair in selenium-treated human cells. Mutat Res. 2004; 565: 45-51.
- Miki H, Uehara N, Kimura A, Sasaki T, Yuri T. Resveratrol induces apoptosis via ROS-triggered autophagy in human colon cancer cells. Int J Oncol. 2012; 40: 1020-1028.
