
Research Article
Austin J Radiat Oncol & Cancer. 2015;1(2): 1006.
Inaccurate Positioning Might Introduce Significant Calibration Errorsto a Detector-Array QA Device for Flatten Filter Free Beams
Wang S, Chao KSC and Chang J *
Department of Radiation Oncology, Weill Cornell Medical College, New York, USA
*Corresponding author: Chang J, Department of Radiation Oncology, Weill Cornell Medical College, 525 E 68 St, Box 575, NY 10065, New York
Received: October 09, 2014; Accepted: February 27, 2015; Published: March 02, 2015
Abstract
Purpose: This study investigated the calibration error caused by misalignment of the beam with the MapCheck2 due to inaccurate positioning. We hypothesized the calibration for the Flatten-Filter-free (FFF) beam is more vulnerable to the positioning error than the conventional flattened beam.
Materials and Methods: A MapCheck2 was calibrated for the 10MV conventional and FFF beams with perfect alignment and with an introduced 1-cmpositioning error. The effect of positioning error was modeled as a detector independent multiplication factor to predict the calibration error for misalignment up to 1 cm. The calibrated sensitivities of both beams were compared to evaluate their dependence on the beam type.
Results: The 1-cm positioning error lead to 0.39% and 5.24% local calibration error for the conventional and FFF beams, respectively. After propagating to the edges of the MapCheck2, the calibration errors became 6.5% and 57.7%. The propagation error increased almost linearly with the positioning error. The percentage difference of sensitivities between the conventional and FFF beams was small (0.11±0.49%) without positioning error but was significantly larger (-32.2±17.8%) with1-cmmisalignment.
Conclusion: The positioning error is not handled by the current commercial calibration algorithm. The calibration errors for the FFF beam are ~9 times greater than that for the conventional beam with identical positioning error, and a small 1mm positioning error might lead up to 8% calibration error. Since the sensitivities depend weakly on the beam type, it is recommended to cross-check the calibrated sensitivities between the conventional and FFF beams to detect potential calibration errors.
Keywords: IMRT QA; Calibration error; 2D Detector array
Abbreviations
(FFF): Flattening Filter Free; (2D): Two-Dimensional; (IMRT): Intensity-Modulated Radiotherapy (QA): Quality Assurance; (CAX): Central Axis; (LINAC): Linear Accelerator; (MU): Monitor Unit
Introduction
MapCheck (Sun Nuclear Corporation, Melbourne, FL, USA) is a popular dosimetry device for radiotherapy [1-4]. It consists of a Two-Dimensional (2D) array of detectors that can be used for quick dosimetric check of radiation beams, particularly, the Intensity- Modulated Radiotherapy (IMRT) beams. Like many other dosimetry devices, the accuracy of this device depends on how well the detectors are calibrated. Since the sensitivities (detector responses to unit radiation fluence) of the detectors are not identical, a universal calibration factor does not apply and each detector requires individual calibration instead. A few calibration procedures [5-11] have been developed for dosimetry of 2D-array detectors, most of which can be applied to MapCheck. A successful calibration procedure should calibrate the radiation sensitivities of individual detectors with high fidelity so that they respond to incoming radiation uniformly. In addition, the calibration shouldn’t be over sensitive to uncertainty introduced during the calibration, e.g., machine output fluctuation, minor positioning errors…
For MapCheck calibration, the vendor recommends a patented algorithm [5] that the sensitivities of a row of detectors are calculated iteratively from the ratio of wide open-field images acquired with the MapCheck aligned with the beam Central Axis (CAX) and shifted laterally. Output variation is estimated from an image acquired with MapCheck rotated 180 degree, and removed from the iteratively calculated sensitivities. Although this calibration algorithm is efficient, it highly depends on the reproducibility of repeatedly delivered wide fields. Any local fluence fluctuation such as machine output variation will propagate to peripheral detectors due to the iterative nature of this algorithm and should be taken into consideration in the calibration algorithm.
Since the MapCheck is shifted manually during the calibration, a positioning error is inevitable. In this study, the positioning error is quantified as the displacement of the MapCheck from the required nominal calibration position. Since the detector sensitivity is calibrated based on the local fluence, a displacement of the MapCheck causes beam misalignment, which leads to a local variation of the expected fluence and ultimately results in a calibration error. This error shouldn’t be very significant for a flattened beam. Since the beam profile is relatively flat, a slight shift of the beam profile does not cause a significant change to the local fluence. For Flattening- Filter-Free (FFF) beams [12-16], on the other hand, the beam misalignment might lead to a higher calibration error because the beam profile varies considerably. Therefore, we hypothesized that the misalignment-induced calibration error depends on the gradient of the beam profile, and is more prominent for the FFF beam than the conventional flattened beam.
In the study, we investigated the errors of calibrated sensitivities for the conventional and FFF beams due to inaccurate positioning of the MapCheck during the calibration. A model was developed to predict the calibration errors using the calibration measurements with and without 1 cm displacement of the MapCheck. The calibration errors as a function of displacement were calculated and compared for the conventional and FFF beams.
Materials and Methods
Experiments of this study were conducted on a MapCheck2 device of our department commissioned for Quality Assurance (QA) of clinical IMRT beams. The MapCheck2 consists of an array of 1527 diode detectors distributed in a 26×32 cm2(row by column) area, but there are no detectors in the four 7×7 cm2 corner triangles. Detectors on each row have a 1 cm lateral spacing and the row-to-row interval is 0.5 cm. There is also a 0.5 cm lateral position difference between neighboring rows, leading to a diagonal detector-to-detector distance of about 0.71 cm. The diode detector of the MapCheck2has a photonenergy range from Co-60 to 25 MV, and an electron energy range from 6 MeV to 25 MeV.
MapCheck2 calibration
Figure 1 illustrates how the MapCheck2 is calibrated and how the positioning error might affect the calibration results. The calibration procedure is described in details in the patent by Simon et al. [5] And will be briefly summarized here. In Figure 1, R(X,Y) is the relative 2D in-detector beam fluence normalized to the center of the beam profile (the green profile) and S(X,Y) is the sensitivity for detector (X,Y) when the Central Axis (CAX) of the beam is aligned with the center of the MapCheck2. The detector reading is D0(X,Y)= R(X,Y)×S(X,Y), where the subscript 0 z. Please note that the beam shift is actually achieved by shifting the detector to the opposite side.
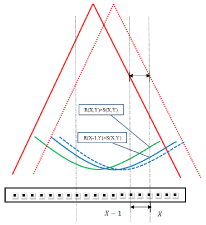
    Figure 1:  Illustration of how the MapCheck2 is calibrated and the potential
calibration error due to beam misalignment. R(X,Y): relative 2D in-detector
beam profile normalized to the center of the beam; S(X,Y): sensitivity for
detector (X,Y). Green line: the measurement for the centered beam. Solid
blue line: the measurement for the beam shifted 1 cm to the right. Dotted
blue line: the measurement for the misaligned beam caused by inaccurate
positioning of the MapCheck2 during calibration.
For MapCheck2 calibration, the sensitivity is calculated iteratively from the ratio of the detector readings for the centered (green) and shifted (blue) profiles. Let r(X,Y) be the ratio of D0(X,Y) to D1(X,Y), then
r(X,Y)= D 0(X,Y)/ D1(X,Y)= R(X,Y)/ R(X-1,Y), (1A)
or
R(X,Y)= r(X,Y)× R(X-1,Y). (1B)
Since R(0,Y)=1 by definition (the relative fluence is normalized to the center detector or detector 0 of each row), we can calculate R(n,Y) iteratively for detector n(=1, 2,3…)and the sensitivity can also be calculated as
S(n,Y)= D0(n,Y)/ R(n,Y)= D0(n,Y)/ R(n-1,Y). (2)
Prediction model for misalignment-induced calibration error
When the shifted detector is not positioned accurately, calibration error is introduced due to the discrepancy between the delivered and expected fluence. The positioning error, defined as the displacement of the MapCheck2 from the required nominal calibration position, results in a misaligned beam profile that is higher and lower than the expected on the left and right sides respectively (i.e., the dashed blue line instead of the solid blue line in Figure 1). This is different from output-induced discrepancy (the whole beam profile is either higher or lower than the expected) and cannot be modeled properly by the vendor’s calibration algorithm.
We have previously developed a model [17] for minimize the propagation of calibration error for 2D detector array. This model was generalized in this study to predict the calibration errors caused by beam misalignment. In this model, the misalignment-induced calibration error is modeled as a multiplication factor PE (d,n) to the calibrated sensitivity:
S d(n,Y)= S0(n,Y)×PE (d,n), (3)
Where n is the detector index with respect to the center of MapCheck2, S0(n,Y) is the true sensitivity and S d(n,Y) is the sensitivity from the calibration with a d cm misalignment of the beam.PE (d,n) depends on the gradient of the open-field beam profile and the amount of misalignment d of the beam from the nominal position. Since the sensitivities are calculated iteratively, the positioning error of the first detector propagates exponentially to subsequent detectors and PE (d,n)can also be obtained iteratively as
PE(d,n) = (1 + PE(d))n, (4)
where PE(d) is the position error factor for d–cm misalignment. Eq. (4) indicates that PE (d,n) is known once PE(d) is determined. To simplify the derivation of PE (d), we further assume that the calibration error increases linearly with d:
PE (d) = d × PE (1), (5)
where PE(1) is the positional error factor for a 1-cm displacement. As a consistence check PE (0) = 0 when there is no positioning error (i.e., d = 0) in Eq. (5), which leads to PE (0, n) = 1 in Eq. (4), and no calibration error due to beam misalignment in Eq. (3). With this prediction model, we were able to use the measurements with 1-cm simulated misalignment to estimate the calibration errors for a d cm displacement without repeating the physical calibration procedure.
Experiment
The calibration errors of MapCheck2 due to beam misalignment were investigated for the conventional flattened 10MV and the FFF 10 MV beams of the True beam Linear Accelerator (LINAC) of our department. We first calibrated the MapCheck2 using the 10MV conventional and FFF open-field beams. All calibration fields were delivered for 200 Monitor Unit (MU) at a dose rate of 300 MU/min. Gantry and collimator angles was fixed at 0 degree throughout the experiments. During the calibration, there was no buildup material placed on the MapCheck2. The calibration was performed following the vendor’s recommended calibration procedure at two different positions. For the first calibration position we aligned the center of the MapCheck2 with the CAX of the LINAC. For the second calibration position, the MapCheck2 was shifted 1cm laterally away from the CAX.
With these two calibrations, we were able to derive the sensitivity of each detector using Eq. (2). The calibrated sensitivities of the conventional and the FFF beams were compared to evaluate the dependence of detector sensitivities on the beam type.
In addition, the calibration errors due to beam misalignment between 0 cm and 1 cm were estimated using the prediction model described above, i.e., Eq. (3). To simulate the 1-cm misalignment, we performed the third data acquisition by shifting the MapCheck2 2 cm laterally away from the CAX (1-cm intentional displacement from the nominal calibration position). PE (1) was determined by comparing the calculated sensitivities with and without the 1-cm displacement. Once PE (1) was known, the calibration errors for all detectors were calculated using Eq. (3) for displacement between 0 cm to 1 cm with a 1mm increment.
Results and Discussion
In this study we investigated the calibration errors due to beam misalignment caused by inaccurate positioning of the MapCheck. The basic hypothesis of this study was that the misalignment-induced calibration errors would be more prominent for the FFF beam than the conventional beam. We first tested this hypothesis by comparing the calibration errors caused by the same (1-cm) misalignment for both beams. Figure 2 illustrates the percentage difference of the calibrated sensitivity for the 10 MV beam with and without the 1cm beam misalignment. Up to 6.5% difference was observed between these two calibrations. Figure 3 shows the similar percentage difference for the 10 MV FFF beam. The largest difference between the calibrated sensitivities with and without the 1-cm beam misalignment was 57.7%. It is obvious from these two figures that calibration of the FFF beam is more sensitive to the positioning error than that of the conventional beam.
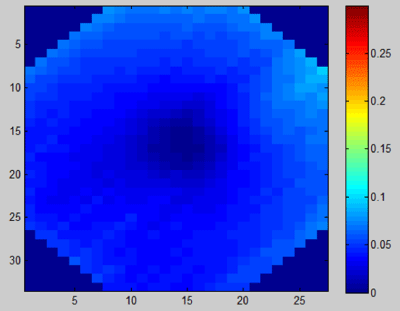
    Figure 2:  The percentage difference map of the calibrated sensitivities for
the 10 MV conventional beam with and without the 1cm beam misalignment
caused by positioning error.
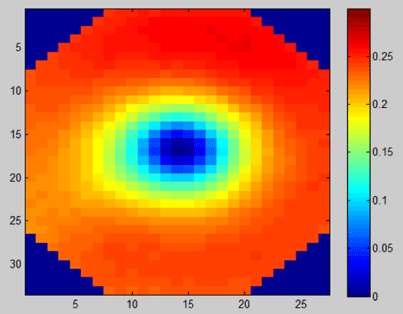
    Figure 3:  The percentage difference map of the calibrated sensitivities for
the 10 MV FFF (Flattening-Filter-Free) beam with and without the 1cm beam
misalignment caused by positioning error.
This dramatic difference is caused by the different gradient of the beam profile between these two beam types, i.e., the FFF beam has a much higher beam gradient than the convention beam. This is evidenced in Figure 4 which demonstrates the longitudinal profiles of the conventional and FFF open beams, measured by the MapCheck2 and corrected by the calibrated sensitivities with and without the1- cm beam misalignment. It is noted that the misalignment-induced calibration error propagates towards the beam edges and is more prominent for the FFF beams. PE (1) was calculated as 0.39% and 5.24% for the conventional and FFF beams, respectively.
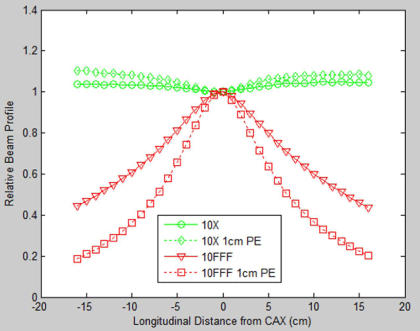
    Figure 4:  Longitudinal profiles of conventional and FFF open field beams,
measured with the MapCheck2 used in this study, and corrected by the
detector sensitivities calibrated with and without the 1cm beam misalignment
caused by Positioning Error (PE).
By plugging the PE (1) value into Eq. (3), we were able to calculate the calibration errors of each diodeforpositioning errors between 0 and 1 cm. Figure 5 shows the estimated maximum percentage calibration error for detector 16 (the most peripheral detector) as a function of the positioning error (in millimeters) of the MapCheck2, where the blue bars are for the 10 MV conventional beam and the brown bars for the 10 MV FFF beam. For the same positioning error, the calibration errors due to misalignment of the FFF beam are much larger than that for the conventional beam. Since the detector can generally be aligned within 2 mm of the intended location, we estimate that the calibration error due to the beam misalignment will introduce a systematic error of <1.5 % to the measurements for the conventional beam. Thus, QA check using the MapCheck2 device is not sensitive to the calibration error due to misalignment of the conventional beam. For the FFF beam, on the other hand, this systematic error can be as high as 16% and the QA results might be off significantly even if the device is slightly misaligned during the calibration. Therefore, an independent validation of the calibrated sensitivities of the FFF beam is highly desirable to assure the correctness of QA results using the MapCheck2 device.
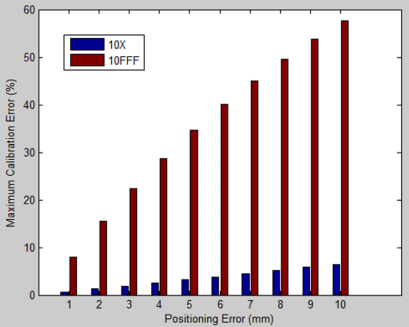
    Figure 5:  Estimated maximum percentage calibration error for Detector 16
(16 cm from the center) versus the displacement (i.e., positioning error) of
MapCheck2 in millimeters. Blue: 10 MV conventional beam. Brown: 10 MV
FFF beam.
Figure 6 is the histogram of the percentage difference between the sensitivities calibrated for the 10MV conventional and 10MV FFF beams, with a careful alignment of the beam with the MapCheck2 (i.e., no positioning error). The mean difference is 0.11% with a standard deviation of 0.49%, indicating that the sensitivity is weakly dependent on the beam type. This weak dependence provides a very useful tool for validating the calibrated sensitivities. That is, in addition to paying particular attention to the alignment of the beam with the MapCheck2 during calibration, we should also compare the calibrated sensitivities of the conventional and FFF beams to decide whether the calibration is reliable.
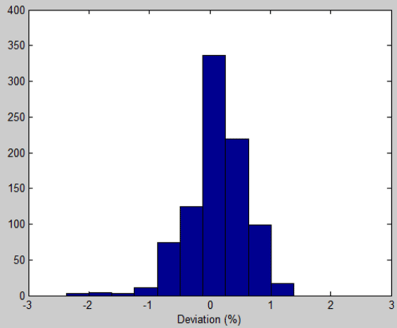
    Figure 6:  Histogram of the percentage difference of the calibrated sensitivities
between the 10MV conventional and 10MV FFF beams when the MapCheck
was carefully alignment (i.e., no positioning error).
The effectiveness of the proposed check (comparison of the calibrated sensitivities between the conventional and FFF beams) is demonstrated in Figures 7 & 8. Figure 7 shows the same histogram (the percentage difference between the calibrated sensitivities) as in Figure 6 except that the calibration of the conventional beam was perfectly aligned but a 1cm beam displacement was intentionally introduced to the calibration of the FFF beam. The mean difference was -29.1% with a standard deviation of 16.2%,indicating that the calibrated sensitivities of these two beams became significantly different when the misalignment of the FFF beam increases from 0 to 1 cm.
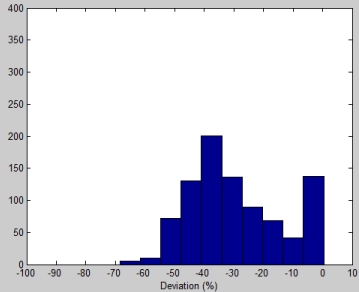
    Figure 7:  Histogram of the percentage difference of the calibrated sensitivities
between the 10MV conventional and 10MV FFF beams, when the Map Check
was intentionally displaced 1cm from the nominal calibration position for the
calibration of the FFF beam only.
Since the misalignment can also happen to the calibration of conventional beam, it might be argued that the difference between the calibrated sensitivities between the conventional and FFF beams might not be as pronounced as that shown in Figure 7. To address this concern, we compared the sensitivities calibrated for the 10MV conventional and FFF beams, with an intentionally introduced 1cm displacement of the MapCheck2 for both calibrations. As shown in Figure 8, the results of this comparison are virtually identical to that in Figure 7. The mean difference is -32.2% with a standard deviation of 17.8%, indicating the calibrated sensitivities are very different between these two beams. These results are actually expected since according to the validated basic hypothesis of this study, the FFF beam is far more sensitive to the positioning error than the conventional beam. Therefore, the proposed check is still useful even if there are misalignment-induced calibration errors for the conventional beam.
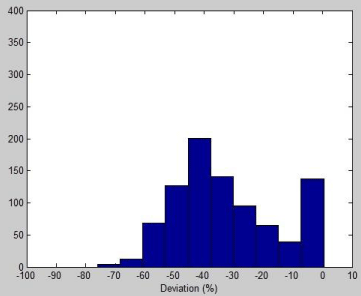
    Figure 8:  Histogram of the percentage difference of the calibrated sensitivities
between the 10MV conventional and 10MV FFF beams, when the Map Check
was intentionally displaced 1cm from the nominal calibration position for the
calibration of both beams.
Conclusion
We demonstrated that inaccurate positioning of the MapCheck leads to beam misalignment, which in turn results in calibration errors that are not handled by the current commercial calibration algorithm. Particularly, for the same positioning error the misalignmentinduced calibration errors for the FFF beam are ~9 times greater than that for the conventional beam, and a small 1mm misalignment might lead up to a8% calibration error. Since the sensitivities are only slightly dependent on the beam type and the conventional beam is less affected by the positioning error, it is advisable to cross-check the calibrated sensitivities between the conventional and FFF beams to detect potential calibration errors due to misalignment of the FFF beam.
References
- Keeling VP, Ahmad S, Jin H. A comprehensive comparison study of three different planar IMRT QA techniques using MapCHECK 2. J Appl Clin Med Phys. 2013; 14: 4398.
- Jursinic PA, Sharma R, Reuter J. MapCHECK used for rotational IMRT measurements: step-and-shoot, TomoTherapy, RapidArc. Med Phys. 2010; 37: 2837-2846.
- Jursinic PA, Nelms BE. A 2-D diode array and analysis software for verification of intensity modulated radiation therapy delivery. Med Phys. 2003; 30: 870-879.
- Létourneau D, Gulam M, Yan D, Oldham M, Wong JW. Evaluation of a 2D diode array for IMRT quality assurance. Radiother Oncol. 2004; 70: 199-206.
- Simon WE, Shi J, Iannello CA. Inventors Wide field calibration of a multi-sensor array patent. 2000. US6125335 A.
- Donetti M, Garelli E, Marchetto F, Boriano A, Bourhaleb F, Cirio R, et al. A method for the inter-calibration of a matrix of sensors. Phys Med Biol. 2006; 51: 485-495.
- Greer PB. Correction of pixel sensitivity variation and off-axis response for amorphous silicon EPID dosimetry. Med Phys. 2005; 32: 3558-3568.
- Siebers JV, Kim JO, Ko L, Keall PJ, Mohan R. Monte Carlo computation of dosimetric amorphous silicon electronic portal images. Med Phys. 2004; 31: 2135-2146.
- Parent L, Fielding AL, Dance DR, Seco J, Evans PM. Amorphous silicon EPID calibration for dosimetric applications: comparison of a method based on Monte Carlo prediction of response with existing techniques. Phys Med Biol. 2007; 52: 3351-3368.
- Parent L, Seco J, Evans PM, Fielding A, Dance DR. Monte Carlo modelling of a-Si EPID response: the effect of spectral variations with field size and position. Med Phys. 2006; 33: 4527-4540.
- Simon TA, Simon WE, Kahler D, Li J, Liu C. Wide field array calibration dependence on the stability of measured dose distributions. Med Phys. 2010; 37: 3501-3509.
- Georg D, Knöös T, McClean B. Current status and future perspective of flattening filter free photon beams. Med Phys. 2011; 38: 1280-1293.
- Kretschmer M, Sabatino M, Blechschmidt A, Heyden S, Grünberg B, Wurschmidt F. The impact of flattening-filter-free beam technology on 3D conformal RT. Radiat Oncol. 2013; 8: 133.
- O'Brien PF, Gillies BA, Schwartz M, Young C, Davey P. Radiosurgery with unflattened 6-MV photon beams. Med Phys. 1991; 18: 519-521.
- Vassiliev ON, Titt U, Ponisch F, Kry SF, Mohan R, Gillin MT. Dosimetric properties of photon beams from a flattening filter free clinical accelerator. Phys Med Biol. 2006; 51: 1907-1917.
- Pönisch F, Titt U, Vassiliev ON, Kry SF, Mohan R. Properties of unflattened photon beams shaped by a multileaf collimator. Med Phys. 2006; 33: 1738-1746.
- Wang S, Chao K, Chang J. Sensitivity Calibration of a 2-dimensional Detector Array Using 2 Shifts. International Journal of Radiation Oncology Biology Physics. 2012; 84: S799-S800.