
Research Article
Austin J Radiol 2023; 10(1): 1207.
CT Image Quality and Dose Reduction Management
Diab HM1*, Kameesy SUE2, Mostafa F3 and Abou-Elenein HS4
1Nuclear and Radiological Research Safety Center, Egyptian Atomic Energy Authority (EAEA), Egypt
2Department of Physics, Faculty of Science, Ain Shams University, Egypt
3Ministry of Health, Egypt
4Department of Radiotherapy, Children Cancer Hospital, Egypt
*Corresponding author: HM Diab Nuclear and Radiological Research Safety Center, Egyptian Atomic Energy Authority (EAEA), Egypt
Received: November 24, 2022; Accepted: January 03, 2022; Published: January 09, 2023
Abstract
Medical imaging is characterized by tremendous and undeniable benefits for patients in recent health care. Combining two imaging methodologies into a single examination, such as SPECT/ CT and PET/CT, so-called hybrid imaging, is also increased. Many factors may affect the image quality. Different CT protocols are designed to perform high-quality examination at low radiation dose. The present study is focused on the assessment of the performance of image quality for fifteen CT scanners with different scan mode (from 2slice to 320 slice) at 80, 100 and 120 kV with tube current of 50–250 mA to optimize the radiation dose. Also, the uniformity was examined as part of the quality control tests. The results showed that, the 320 slice CT scanner delivered the minimal radiation dose compared with the 16 and 64 slice CT scanners which mostly applied in Egyptian centers (governmental and private). Both 16 and 64 slice CT scanners produce acceptable image quality but with associated high absorbed dose. These results give a further support to the priority of the 320 slice CT scanner to be applied. Field uniformity measurements were adopted and the difference in the calculated values for different protocols was precisely evaluated and discussed.
Keywords: CT image quality; Image noise; Contrast; Resolution
Introduction
The objectives in CT development have changed from increasing the number of slices to focusing on improvements in X-ray tube performance, detector efficiency and data processing [1]. After the introduction of Multi-Slice CT (MSCT) in 1997 [2], the number of slices acquired per rotation has rapidly increased from 2 up to 4, 8, 16, 32, 40, 64, 128 and 320 [3]. The primary advantage of MSCT is improved temporal (<250 ms), spatial resolution (<0.5 mm) and smaller scan times [4]. Since 2006, a new scanner technology using two X-ray sources and two detectors simultaneously, dual source CT, have been settled up [5]. The technology has provided further improvements in scan speed and temporal resolution (0.28 s rotation time and 75 ms temporal resolution). By utilizing Dual Energy CT (DECT), using either dual source or kV-switching, advanced post-processing and visualization, new clinical applications have been found. The advantage with DECT is that the properties of X-ray attenuation change at different energies, which are used to differentiate materials, including iodine, calcium, and uric acid crystals. In recent years, iterative reconstruction methods have been introduced that provide great potential for improving image quality and reduced radiation doses [6].
Image quality is essential and can be used as a quality assurance/ control indicator for imaging system performance and also for optimizing patient radiation dose during X-ray practice. The challenge is how to establish protocols for specific diagnostic with sufficient image quality and lowest effective dose to patient.
The most known detector configuration today is from 64 to 320 detector rows. Every CT slice is subdivided into a matrix (e.g., 512×512 or 1024×1024). Each element (voxel) has been traversed by X-ray photons, and the transmitted radiation is detected by the detector. The attenuation of a monochromatic narrow X-ray beam going through a homogeneous material is described by the following equation:
I = I e-μx (1)
where I is the number of photons behind the object, I0 is the number of photons at the same point in the absence of the object, x is the object thickness, and μ is the linear attenuation coefficient of the material for the photon energy used. The linear attenuation coefficient μ is strongly dependent on the photon energy and therefore only of limited use for characterizing the radiation attenuation capacity of an object in CT. The attenuation value in CT (Hounsfield unit; HU) is the scaled difference of the linear attenuation coefficient of the investigated object from the linear attenuation coefficient of water. Water is used as the reference material:
HU = k*((μobject - μwater) /(μwater - μair)) (2)
where k is 1000 and μwater and μair are the linear attenuation coefficients of water and air. Specific attenuation values are assigned to each individual voxel. The reconstructed image consists of a matrix of picture elements or pixels. Each pixel is assigned a numerical value (HU) which is the average of all attenuation values within the voxel. This scale assigns for water an attenuation value of 0 HU and for air 1000 HU. Each number represents a shade of grey with - 1000 HU (black) to +1000 HU (white). By using so-called windowing technique (window widths and levels), certain types of tissues can be viewed in more detail [7].
There are several metrics describing different aspects of image quality in CT. Noise, uniformity high-contrast spatial resolution and low-contrast spatial resolution [8]. Several methods are available to optimize and minimize the radiation dose in CT [9,10]. The scanning parameters should be optimized for each specific examination and special efforts should be made with pediatric CT protocols [11]. A number of scanning parameters influence patient radiation dose and image quality: tube current, tube voltage, filtration, collimation, reconstruction method, reconstruction filter, slice thickness, pitch, and scanning length [12]. The operator can monitor most of these parameters and modify them to obtain the necessary image quality with a minimal absorbed dose to the patient. A simple relationship exists between the tube load (the product of tube current and exposure time per rotation, mAs) and radiation dose to the patient. A 50% reduction in tube load reduces the radiation dose by one half its values but also increases the noise level by a factor of v2. An adequate mAs level can be determined using dose reduction simulation software [13]. The software adds artificial noise to the CT raw data to simulate a scan acquired with lower dose (mAs). The tube voltage determines the energy of the emitted photons from the X-ray tube; consequently, a variation in tube voltage changes the radiation dose and image quality. Reduction in tube voltage results in reduced radiation dose when all other parameters are held constant. This will increase the image noise and cause contrast changes. Several studies have demonstrated an ability to affect radiation dose and image quality by using a lower tube voltage to optimize the Contrastto- Noise Ratio (CNR) and minimize the absorbed dose [14,15].
In CT, Automatic Exposure Control (AEC) is automatically modulated the current of tube in the plane of x-y (angular modulation) along the scanning direction (z-axis; longitudinal modulation) or both (combined modulation) [16]. The modulation is done according to the size of the patient, shape, and the attenuation of the scanned body parts. The system adjusts the current of the tube to obtain the pre-determined image quality indicated by the operator with improved radiation efficiency. The adaptation of the tube current is based on attenuation data from the localization radiograph and attenuation profiles or feedback from online measurements. AEC systems have several benefits: better control of the absorbed dose to the patient, improved consistency of image quality, reduction of certain artifacts related to the image, and small load on the X-ray tube, which increases its lifetime [17]. All modern CT systems are characterized by AEC systems that modulate current of the tube in three dimensions. Each of them has different functional properties. However, the main role is to adapt the needed image quality and radiation dose in a reproducible method by managing the tube current to the patient’s size, shape, and attenuation.
This study was conducted with the aim to evaluate the performance of CT scanners in governmental and private hospitals at various kilovolt and tube current setting. Image quality was assessed using a CT image quality phantom. The evaluated Image quality parameters are CT Image noise, uniformity and Contrast.
Materials and Methods
CT Scanners
The data used in the present work were collected from thirteen departments of radiology (private and governmental sectors) as shown in Table 1. The most wide spread procedures performed in the radiology department are head and abdomen.
    CT

    Manufacture

    Model

    No. of slices


    1

    Toshiba

    Equilion one genesis

    320 slice


    2

    Siemens

    Somatom

    64 slice


    3

    Toshiba

    Aquilion

    64 slice


    4

    Philips

    Brilliance

    16 slice


    5

    Neusoft

    Classic

    16 slice


    6

    Hitache

    Eclos

    16 slice


    7

    General electric

    Bright speed

    16 slice


    8

    General electric

    Bright speed

    16 slice


    9

    General electric

    Lights speed

    16 slice


    10

    Toshiba

    Activation

    16 slice


    11

    Toshiba

    Aquilion

    16 slice


    12

    Toshiba

    Asteion

    2 slice


    13

    Siemens

    Somatom Emotion duo

    2                  slice
Table 1: CT scanners Specifications.
Evaluation of Image Quality
Several ways are very well known to evaluate image quality such as objective evaluations of patient and phantom images. Contrast and noise are the fundamental factors in image quality: high noise or low contrast makes the objects invisible regardless of resolution. Contrast means the capability to convert differences in patient tissue into image. [18]. In a CT system, the attenuation coefficient μ of an area in the body will vary with the x-ray energy of the incoming radiation beam. μ is a property that is associated with will known methods to be determined. This property describes how the X-ray fluency rate is reduced by the object. The attenuation coefficient is presented as CT number relative to the attenuation of water. CT numbers (the signal) are given in Hounsfield Units (HU) and for an arbitrary tissue the attenuation coefficient is defined as [19]:
CTnumber = 1000 *( μtissue - μwater) /μwater (3)
Ideally, all pixel values would be zero when inserting a region of interest (ROI) in a homogenous water phantom. The CT-number in an image ranges from approximately -1000 for air, and up to 3000 for very dense bone. Water has a zero CT number. Assessments of CT number, noise, uniformity, and spatial resolution were made using a QC phantom as shown in (Figure 1).
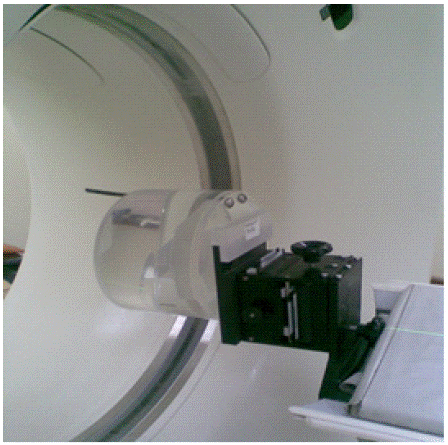
Figure 1: QC phantom used for image quality.
Noise: Noise is an important determinant of image quality because excess noise can reduce image resolution and impair the detection of low-contrast objects from background. Noise is the standard deviation of a pixel over an ensemble of images. It is commonly estimated over a Region Of Interest (ROI) in a single image [20]. Five identical ROIs were placed on the image of the QC phantom, four peripherally and one centrally. Noise was determined using the measurements from all five ROIs. Noise (β) is defined by the equation [21];
where NHair is the Hounsfield number for air and NHea the Hounsfield number for water. The Standard deviation is defined by the equation;
Noise should not vary by more than 10% or 0.2 HU from the baseline tests at acceptance. Noise can be derived from the x-ray detection system itself as electronic noise, but with current scanners quantum noise is more probable. Quantum noise is associated with the number of photons and the number of photons is, in turn, associated with radiation dose. The relationship between quantum noise and radiation dose is well known: noise is inversely proportional to the square root of the radiation dose and the radiation dose is directly proportional to the number of x-ray quanta [22]. Thus, tube current adjustment becomes an attractive way to optimize since the relationship between tube current and image quality is straightforward if other parameters are kept constant as shown in table 2. Indeed, tube current adjustment is one of the most common tools in controlling radiation dose [23].
    Voltage 80, 100, 120    kVp


    Exposure 50, 100, 150, 200, 250 mAs


    Slice Thickness 10 mm


    Rotation Time 0.75 s
Table 2: List of parameters utilized.
Uniformity: The uniformity of the image depends on the shaped beam filter, X-ray tube output and the centering of the object in the beam. The placement of ROIs in this test includes one ROI that is positioned in the center of the phantom and four ROIs that are placed in the periphery of the phantom and located at 3, 6, 9, and 12 o’clock. The peripheral ROIs are placed 1 cm from the edge. Image uniformity was evaluated as the maximum difference between the mean value of the center ROI and any of the four peripheral ROIs [24.]. The coefficient of variation (Cv) is expressed as a percentage and was calculated as follows:
Cv = ( s / M ) * 100 (6)
where M is the mean value of the measured image noise values of the phantom and s is the calculated SD of the measured image noise values. It refers to the values of the pixels in the reconstructed image; they should be constant at any point in the image of QC phantom. Accepted values for uniformity test are; (0 ±5) HU (max difference from center +5 or -5HU).
Contrast: The spatial resolution of an imaging system is defined as its ability to differentiate two objects lying close together [9]. The spatial resolution can be described both in the spatial domain, i.e. by the smallest distance between two features that can be resolved individually or in the spatial frequency domain, i.e. the highest spatial frequency that can be resolved by the system. Spatial frequency can be described as the number of line pairs present per centimeter (lp/cm), and the spatial frequency will increase as the lines move closer together.
The various strategies in CT technology may influence the diagnostic performance differently. A diversity of imaging techniques, new reconstruction algorithms and post-processing algorithms may result in images that do not look familiar to the radiologists with respect to grey-scale, noise suppression, linear structures, edge enhancement and variety in HU measurements. This introduces inter-scanner and inter-manufacturer differences in CT images, for instance with respect to Hounsfield Units (HU). Each HU-value represents one shade of grey in the reconstructed image. Every pixel in a CT image is correlated to one specific HU which reflects tissue density because each pixel reflects the linear radiation attenuation coefficient of the corresponding volume element (voxel) [25]. Contrast is calculated as the ratio of the signal difference to the signal of background:
C = (HUa-Hb)/ HUb (7)
Where: the HUa and HUb are the measured Hounsfield units of the object of interest and the background of the object respectively [26].
Image signal and image noise are key parameters in image quality assessment. In the ideal and linear case, image signal (S) is directly linked to the detected number of photons N whilst the noise (s) may be seen as the pixel’s stochastic fluctuation around their mean value. The photons are distributed according to Poisson’s law meaning that the quantity s is equal to N. The ratio of these two quantities yields the signal-to-noise ratio (SNR), expressed as:
SNRa (S/s) = N/vN = vN (8)
In an ideal device, each quantum could be counted by the detector and contributes towards the image. However, due to the properties of the detector and its limited efficiency a real measurement of the SNR would give the following result:
SNRreal = Nreal/vNreal = vNreal (9)
Where NReal gives the number of quanta that contribute to the image for the real device and is also called noise-equivalent quanta (NEQ) [27].
Results and Discussion
Noise
The effect of selecting tube kV and mAs on both noise and uniformity were examined for different kV at 80, 100 and 120, and different mAs value ranged from 50 to 250.The experimental results that predict the value of noise are shown in (Figure 2). Image quality improvement such as reduction of noise is a prerequisite for acceptance of lowering the radiation dose. Images obtained using the settings recommended by the manufacturer, 100 kV/200 mAs and 120 kV/250 mAs were considered reliable for routine standard imaging. The greatest noise was observed with 80 kV and 50 mAs and the lowest noise value was observed with 100 kV and 200 mAs.
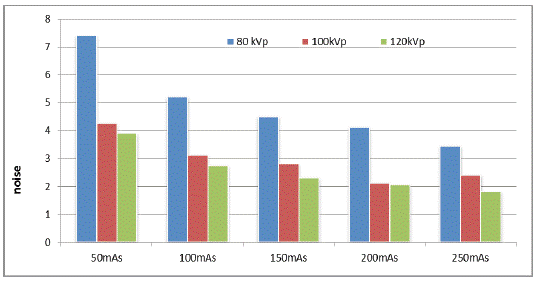
    Figure 2: Noise values at 80, 100 and 120 kV and 50, 100,150,200and

250 mA.
To reduce noise, one can increase the x-ray tube current, xray tube voltage, or slice thickness, or reduce the scan speed or helical pitch. For example, although an increased tube voltage helps to reduce noise under an equivalent kW (the product of the tube current and the tube voltage) condition, contrast electability is generally reduced. Similarly, increased slice thickness may result in a degraded 3D image quality and increased partial-volume effect. A smaller scan speed could lead to increased patient motion artifacts and reduced organ coverage. An increased tube current leads to increased patient dose and increased tube loading. As long as the tradeoffs are well understood, these options can be used effectively to combat noise as shown in (Figure 3).
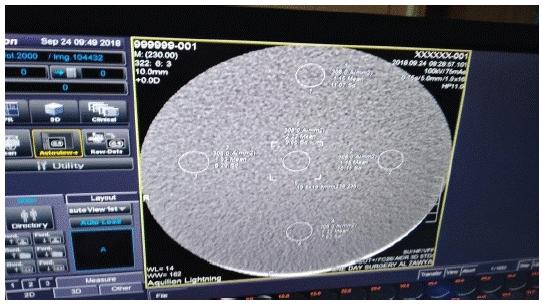
    Figure 3: The mean CT value and standard deviation for each Region

Of Interest (ROI).
Uniformity
Uniformity refers to the values of the pixels in the reconstructed image; they should be constant at any point in the image of QC Phantom. As shown in (Figure 4) the field uniformity measured is less than the acceptable value of ± 5% HU for all scanner types. It is evidently clear that both noise and uniformity decrease with the increase of kV and mAs values. Furthermore, CT image depends on the number of slice and the CT scanner type (manufacturer).
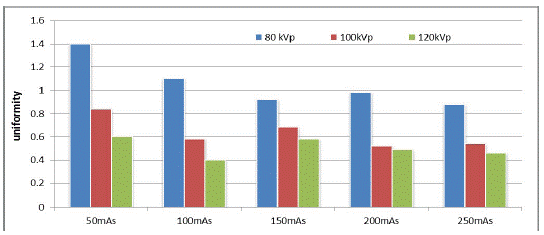
Figure 4: Uniformity values at different kV and mA.
Contrast
Figure 5(a, b and c) shows the mean values of the signal to noise ratio which are calculated for different scanner at each kV and different mAs. For all scaners, the SNR values are ranged from 0.034 to 0.31 for 80 kV, 0.0371 to 1.69 for 100 kV and 0.034 to 1.82 for 120 kV. It can be noticed that when mAs decreases it leads to the distortion of the image quality as well as distortion of the SNR for all scanner types.

    Figure 5: Signal to Noise Ratio (SNR) for different CT scanners at

(80, 100 and 120) kV and different mAs.
Evaluation of the Effect of the Physical Parameters on Image Quality
A more well-known applied method to define the quality of the target image is to adopt the Diagnostic Reference Levels (DRLs) making use of a simple measured and standardized quantity, such as CTDIw or CTDIvol. DRLsdo not represent an indication for the desired dose level for a specific diagnostic task but they define a reference doses that help users to investigate the potential dose reduction measures. The second perspective on dose reduction is to develop some characteristics of image quality. This approach can be reached by the proper optimization of the CT system and scanning techniques to improve the image reconstruction and data processing. A rather necessary aspect that must be taken into consideration is the effect of scan and protocol parameters that can be adjusted by the operator. In this study, the effect of physical parameters on image quality is evaluated in order to combining image quality and dose reduction.
(Figures 6, 7 and 8) show that the exposure dose is affected by image noise and uniformity values at different kV and mAs. A high noise level in the images is related to inconsistent attenuation values in the projection images affecting the uniformity of regions that correspond to the same tissue in the patient. Because of image noise is proportion to square root of mAs, therefore, if the mAs is reduced to one half of its original value, then the noise is expected to increase by 41%. The noise with low kilo voltage images does not cause a reduction in image quality due to the higher signal to noise ratio and higher attenuations.
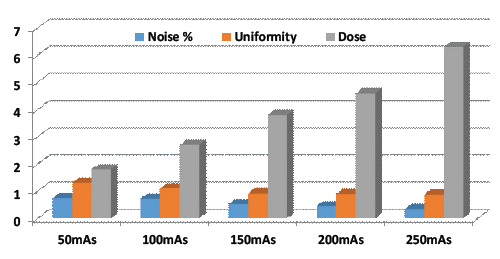
    Figure 6: Dependence of uniformity, noise and dose values on different

mA at 80 kV.
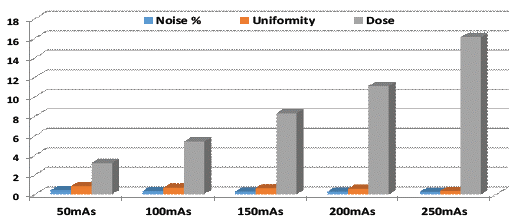
    Figure 7: Dependence of uniformity, noise and dose values on different

mA at 100 kV.

    Figure 8: Dependence of uniformity, noise and dose values on different

mA at 120 kV.
Radiation exposure can be reduced substantially by decreasing the tube voltage from 120 to 80 kV. Compared with the CTDIvol obtained at 120 kV and 50mAs, the reductions in the CTDIvols obtained at 100 kV were 4% at 50mAs, 21% at 100 mAs, 27% at 150 mAs, 32% at 200 mAs and 37% at 250 mAs.
As shown in (Figure 9), uniformity refers to the values of the pixels in the reconstructed image; they should be constant at any point in the image of QC Phantom. It is measured by using equation 4. The dependence of uniformity and noise on different kV and mAs is presented in table 3a, 3b and 3c. It is evidently clear that both noise and uniformity decrease with the increase of kV and mAs values. Furthermore, CT image depends on the number of slice and the CT scanner type (manufacturer).
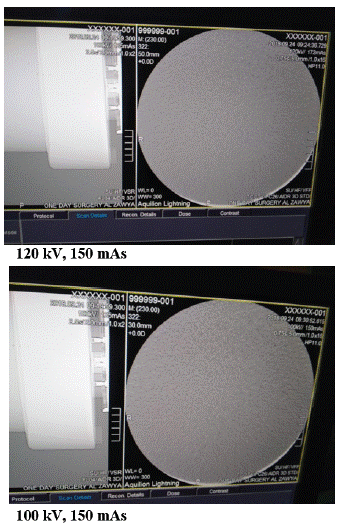
Figure 9: Uniformity at different kV.
Conclusion
The present work is devoted for the assessment of the performance of image quality for thirteen CT scanners with different scan modes at different kV (80,100 and 120) with tube current ranging from 50 to 250 mAs to know how to reduce the associated radiation dose. The obtained results indicate that the exposure dose effectively depends on the image, noise and uniformity values at different KV and mAs. Also, it is apparent that the noise accompanying the low kV images does not cause reduction in the image quality due to the higher signal to noise ratio.
The predictions of our study illustrate that both noise and uniformity decrease with the increase of both kV and mA values. In contrary, the CTDIvol values are linearly proportional to the applied kV and mAs. Furthermore, the obtained results support the superiority of the 320 slice CT scanner for routine CT applications.
References
- Fleischmann D, Boas FE. Computed tomography – old ideas and new technology. Eur Radiol. 2011; 21: 510-517.
- Hu H. Multi-slice helical CT: scan and reconstruction. Med Phys. 1999; 26: 5-18.
- Hsieh J. Computed tomography: principles, designs, artifacts, and recent advances. Second edn. Ed. Hsieh J. SPIE and John Wiley & Sons. 2009; 55-117: 375-465.
- Flohr T, Ohnesorge BM. Multi-slice CT technology. In: Multi-slice and dualsource CT in cardiac imaging: Principles – Protocols – Indications – Outlook. Second edn. Ed. Ohnesorge BM et al. Springer. 2007: 41-69.
- Johnson TRC, Kalender WA. Physical background. In: Dual energy CT inclinical practice Part I Physical implementation. Ed. Johnson TRC et al. Springer. 2011; 3-9.
- Hsieh J. Computed tomography: principles, designs, artifacts, and recent advances. Second edn. Ed. Hsieh J. SPIE and John Wiley & Sons. 2009; 55-117: 375-465.
- Kopp A, Klingenbeck-Regn K, Heuschmid M, Kuttner A, Ohnesorge B, et al. Multislice computed tomography: basic principles and clinical applications. Electromedica-Erlangen. 2000; 68: 94-105.
- Lifeng Yu, Xin Liu, Shuai Leng, James M Kofler, Juan C Ramirez- Giraldo, et al. Radiation dose reduction in computed tomography: techniques and future perspective. Imaging Med. 2009; 1: 65–84.
- Kalender WA, Buchenau S, Deak P, Kellermeier M, Langner O, et al. Technical approaches to the optimization of CT. Phys Med. 2008; 24: 71-79.
- Mattsson S, Soderberg M. Radiation dose management in CT, SPECT/CTand PET/CT techniques. Radiat Prot Dosim. 2011a; 147: 13-21.
- Frush DP. Pediatric dose reduction in computed tomography. Health Phys. 2008; 95: 518-527.
- Kalra M K, Maher MM, Toth TL, Hamberg LM, Blake MA, et al. Strategies for CT radiation dose optimization. Radiology. 2004; 230: 619-628.
- Soderberg M, Gunnarsson M, Nilsson M. Simulated dose reduction byadding artificial noise to measured raw data: a validation study. Radiat Prot Dosim. 2010; 139: 71-77.
- Funama Y, Awai K, Nakayama Y, Kakel K, Nagasue N, et al. Radiation dose reduction without degradation of low-contrast detectability at abdominal multi-section CT with a low-tube voltage technique: phantom study. Radiology. 2005; 237: 905-910.
- Kalender WA, Deak P, Kellermeier M, van Straten M, Vollmar SV. Application and patient size-dependent optimization of x-ray spectra for CT. Med Phys. 2009; 36: 993-1007.
- Kalra MK, Maher MM, Toth TL, Schmidt B, Westerman BL, et al. Reducing radiation dose in emergency computed tomography with automatic exposure control techniques. Emerg Radiol. 2005; 11: 267-274.
- Keat N. CT scanner automatic exposure control systems. Medicines and Healthcare products Regulatory Agency (MHRA) evaluation report 05016. 2005.
- G Dougherty, Digital image processing for medical applications. Cambridge university press, 2009.
- Kalendar. 2005.
- ICRP - International Commission on Radiological Protection. Radiological protection in paediatric diagnostic and interventional radiology. ICRP publication 121. Annals of the ICRP. 2013; 42: 1-63.
- KL Boedeker, VN Cooper, MF McNitt-Gray. Application of the noise power spectrum in modern diagnostic mdct: Part i. measurement of noise power spectra and noise equivalent quanta. Physics in Medicine and Biology. 2007; 52: 4027-46.
- ICRP - International Commission on Radiological Protection. Radiological protection in pediatric diagnostic and interventional radiology. ICRP publication 121. Annals of the ICRP. 2013; 42: 1-63.
- LW Goldman. Principles of CT: Radiation dose and image quality. Journal of Nuclear Medicine Technology. 2007; 35: 213–225.
- IEC. Evaluation and routine testing in medical imaging departments Part 3-5: acceptance tests. Imaging performance of computed tomography X-ray equipment. IEC 61223-3-5. Geneva: International Electrotechnical Commission; 2004.
- Leander P, Söderberg M, Fält T, Gunnarasson M, Albertsson I. Post-processing image filtration enabling dose reduction in standard abdominal CT. Radiat Prot Dosim. 2010.
- Dobbins JT. Image quality metrics for digital systems. In: Handbook of medical imaging. Vol I. Physics and Psychophysics. Ed. Beutel J et al. SPIE Press. 2000; 161-222.
- FR Verdun a, D Racine, JG Ott, MJ Tapiovaara, P Toroi, et al. Image quality in CT: From physical measurements to model observers. Physica Medica. 2015; 31: 823–s843.