
Research Article
Austin J Radiol. 2021; 8(7): 1151.
Performance of Conventional and Machine-Learning Approaches for the Diagnosis of Tumor Recurrence on MRI after Radiation Therapy of Brain Metastases
Ammari S1,2#, Rabiee B3#, Juvina S4, Antonios L2, Sallé de Chou R1, Balleyguier C1,2, Bidault F1,2, El Haik M1, Garcia GCTE2, Laurence M2, Limkin E5, Bockel S5, Khettab M6, Robert C7, Carre A7, Reuze S7, Lassau N1,2, Chouzenoux E4 and Dercle L8*
1Biomaps, UMR1281 INSERM, CEA, CNRS, Université Paris-Saclay, France
2Department of Imaging, Gustave Roussy Cancer Campus, Université Paris Saclay, France
3Montefiore Medical Center, Albert Einstein College of Medicine, USA
4Digital Vision Center, OPIS, CentraleSupélec, Inria, Paris-Saclay University, France
5Department of Radiation Oncology, Gustave Roussy Cancer Campus, France
6Department of Medical Oncology, Gustave Roussy Cancer Campus, France
7Molecular Radiotherapy and Innovative Therapeutics, INSERM UMR1030, Gustave Roussy Cancer Campus, Paris-Saclay University, Villejuif, France
8Department of Radiology, New York Presbyterian, Columbia University Irving Medical Center, USA
#Co-First author and Contributed Equally to this Work
*Corresponding author: Laurent Dercle, Department of Radiology, Columbia University Medical Center, 168th Street, New York, NY 10032, USA
Received: June 15, 2021; Accepted: August 04, 2021; Published: August 11, 2021
Abstract
Objective: To compare the performance of conventional and machinelearning approaches for the diagnosis of tumor recurrence after radiation therapy of brain metastases.
Methods: 184 symptomatic patients with solitary metastatic brain lesions treated with radiation therapy were enrolled in a monocentric retrospective study from June 2013 to May 2018. The diagnosis was tumor recurrence (n=71) and radiation necrosis (n=113) using as reference standard expert-consensus derived from pathology and long-term follow-up. 37 potential predictors were recorded at the time of radiological progression (7-15 months after therapy): 6 clinical features and 31 imaging features including 20 radiomics features derived from standard of care 3D T1-gadolinium sequences. We compared four approaches (A, B, C, D): expert report using MRI sequences without (A) and with delayedcontrast MRI (TRAM) sequences (B), 11 non-Radiomics imaging features alone (C) and a signature combining variables selected using unsupervised machinelearning algorithms (D), training:validation sets: n=144:40 pts).
Results: Overall (n=184), approaches B and C (using TRAM sequence alone) reached comparable performances with respective AUCs [95% CI] of 78.7% [72.3%-85.1%] and 76.8% [70.3%-83.3%]. Both significantly outperformed approach A with AUC [95% CI] of 57.4% [50.7%-64.1%] (DeLong’s test, p-value=10-7). In the validation set (n=40), the signature reached an AUC [95% CI] of 92% [87%-97%].
Conclusion: A quantitative analysis of TRAM sequence seems the best approach for the diagnosis of recurrent tumor after radiation therapy. It is parsimonious, objective and less time-consuming than interpreting all sequences. A signature derived from the analysis of standard of care 3D T1- gadolinium sequence showed promising results that warrant prospective validation.
Keywords: Radiation necrosis; Tumor progression; Brain lesion; Metastasis; MRI; TRAM
Introduction
Brain metastases are the most frequent brain tumors in adults and represent about 25% of brain masses [1,2]. Stereotactic Radiosurgery (SRS), a well-established treatment option, involves delivering a high dose of focal radiation to the tumor [3]. SRC provides increased local control and survival advantage compared to whole brain radiotherapy [2,4], but has a greater risk of Radiation Necrosis (RN), typically occurring months after the treatment [5]. Another major concern after treatment in Tumor Recurrence (TR). Distinguishing these two conditions is pivotal, as the treatment options differ markedly. While RN is mainly treated initially with dexamethasone and in persistent cases with bevacizumab [6,7], TR is treated with surgery, further radiation, or systemic therapy [3].
The main clinical challenge is that the accuracy of current tools for the diagnosis of TR and RN is limited. TR and RN have similar neurological signs and symptoms as well as relatively similar appearance on imaging, with an enlarging enhancing region and increased vasogenic edema on post gadolinium T1-weighted magnetic resonance imaging (MRI) and T2-weighted FLAIR MRI, respectively [3]. In an effort to avoid invasive diagnostic techniques (such as biopsy), more sophisticated modalities such as perfusion MRI, MR spectroscopy, and Positron Emission Tomography (PET) have been studied to help distinguish RN and TR, but there is limited availability of those modalities compared to more conventional imaging methods such as contrast enhanced MRI [8-13]. Furthermore, none of these modalities offer sufficient sensitivity or specificity in clinical settings [14-16]. Hence, identifying reliable diagnostic parameters, preferably using routine MRI sequences to avoid more invasive procedures such as biopsy or isotopic examination, would benefit a great number of patients and physicians facing this challenge.
Considering the physiological differences between TR and RN, there might be subtle differences in texture appearance in medical images. Computational medical imaging, known as radiomics, involves the analysis and translation of medical images into quantitative data [17], and could identify such potential differences. Promising studies have demonstrated quantifiable textural differences in gray levels and histogram-oriented gradients between RN and TR, which are not obvious to human observers; These include both local-level features (within a tumor niche) and global-level features (global composition of the region of interest) [18-21]. For instance, a T1/T2 mismatch in lesion margins has been correlated with RN [22]. Mesh-like diffuse enhancement and rim enhancement with feathery indistinct margins have been associated with RN, while TR was associated with focal solid nodules and solid uniform enhancement with distinct margins [23]. Analyzing differences between edges, as well as level and spot patterns within the lesions associated a soap bubble pattern with RN [24,25]. RN was associated with a diffuse pattern characterized by periventricular white matter changes, while TR was associated with hyper/hypo-intensities indicative of hemorrhagic changes on Gd-T1-w, T2-w, and FLAIR MR Modalities [24,26]. The importance of intensity normalization in cases of multi-scanner and multi-site acquisitions have been emphasized to normalize these quantitative features [27,28].
The objective of this study is to compare the performance of conventional and machine-learning approaches using quantitative imaging biomarkers alone or in combination (signature) for the diagnosis of tumor recurrence after radiation therapy of brain metastases. As an ancillary study, we assessed the feasibility of radiomic analysis of routine MR imaging sequences to identify computer-extracted texture differences between RN and TR.
Materials and Methods
Study design
Our aim was to compare the performance of conventional and machine-learning approaches using quantitative imaging biomarkers alone or in combination (signature) for the diagnosis of tumor recurrence after radiation therapy of brain metastases. As an ancillary study, we used a machine-learning algorithm to combine a subset of radiomic characteristics to build a model which best distinguished RN from TR. To this end, the algorithm was trained on a training cohort (as described below) and validated in a testing set. The ultimate goal of the study was to determine the best non-invasive MRI technique and sequence that can be used on routine MRI to distinguish RN from TR. Figure 1 shows a summary of the study design.
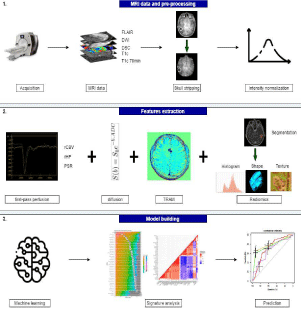
Figure 1: Study Design.
Approaches
We compared four approaches referred as A, B, C, and D: (A) expert report using conventional sequences (3D T1 gadolinium sequence, ADC, CBV); (B) expert report using conventional and delayed-contrast MRI (TRAM) sequences; (C) quantitative imaging biomarkers alone. (D) As an ancillary study, a signature was defined using an unsupervised machine-learning derived combination of 20 additional radiomics features extracted from standard of care 3D T1 gadolinium sequences.
Study population
184 symptomatic patient after 7-15 months from the end of radiotherapy for solitary metastatic brain lesions treated with radiation therapy were enrolled in a monocentric retrospective study from June 2013 to May 2018. All MRI exams were performed at Gustave Roussy Cancer Campus (Villejuif, France). Patients were randomly assigned to a training set (n=144) and testing set (n=40).
This study was approved by the local institutional review board and was in accordance with the declaration of Helsinki. We have sent a letter of information to the attention of patients and all patients were informed of their enrollment in the study, in compliance with the institutional and national guidelines.
Inclusion criteria were: (i) patients who initially responded to SRS (tumor shrinkage), (ii) but months later showed evidence of radiation necrosis or tumor recurrence. In all cases, standard clinical diagnostic MRI including T2-weighted FLAIR and T1-weighted pre-gadolinium MRI and T1-weighted post-gadolinium MRI (DOTAREM (acide gadotérique) guerbet villepinte France) were obtained in this order: an MRI of planning of the radiotherapy which corresponds to the MRI of the diagnosis of the metastasis, then an MRI of the reaugmentation of the contrast (suspicion of radionecrosis or progression) between 7 to 15 months after SRS.
Exclusion criteria were: (i) patients for whom the acquired MRI showed a significant movement artifact; (ii) patients who did not receive a gadolinium injection.
The reference standard for the diagnosis of radiation necrosis was the consensus of experts using imaging and/or biopsy. The initial diagnosis of radiation necrosis or tumor recurrence was made clinically by a committee of experts (two neuro-oncologists, 3 radiotherapists, 2 neurosurgeons). Final diagnosis was made either after 3 years of follow-up, using MRI and the clinical examination or PET MR choline and the clinical examination and findings (164 patients), or using histopathological findings after surgical resection (20 patients).
Imaging parameters and variables
The MRI acquisition parameters were the same on all acquired MRIs (Table 1). Data included at least a contrast (gadoterate meglumine [Dotarem®, 0.1mmol/kg injections of gadolinium-based contrast agent]) enhanced three-dimensional T1-weighed Fast Spoiled Gradient Recalled (FSPGR) acquisition on 3 Tesla MR Scanners (MR 750, Discovery; General Electric Healthcare). Imaging parameters were set as follows: repetition time: 10.2ms; echo time: 3.4ms; field of view, 22cm; voxel size: 0.8mm×0.8mm×1.2mm. Post-contrast 3DT1 sequences only were used as inputs of the radiomics classifier.
    Discovery MR750w 3T
    Name of the sequence
    Type of the sequence
    TR
    TE
    Cutting Thickness


    Installed in 2012, 70cm tunnel, 32 channels, 50cm    z-axis FOV, gradients 44mT/m SR 200T/m/s.
    T1 pre-contrast
    3D rapid gradient echo
    5.9ms
    2.1ms
    1mm


    T2-Flair
    Turbo spin echo
    7002ms
    118ms
    1mm


    DWI
    EPI, two b-values (0 and 1000 mm2/s)
    5375ms
    62.6ms
    3mm


    DSC (Dynamic susceptibility MRI)
    First pass gadolinium contrast-enhanced T2*W    echo-planar image sequence
    2,008ms (range: 1,690-2,250)
    62.4ms
    4mm


    T1 post-contrast - 3min after gadolium injection
    3D rapid gradient echo
    6.1ms
    2.1ms
    1mm


    T1 post-contrast - 70min after gadolium injection
    3D rapid gradient echo
    6.1ms
    2.1ms
    1mm
Table 1: MRI parameters.
Dynamic susceptibility MRI images were acquired using a first pass gadolinium contrast-enhanced T2*W echo-planar image sequence with 50 measurements. Each measurement ranged from 1.5s to 2s long depending on number of slices. Continuous transverse slices throughout the brain were made with each measurement. The number of slices was dependent on patient size. The image acquisition parameters were as follows repetition time: average 2,008ms (range: 1,690-2,250), echo time: 62.4ms, flip angle: 90°, slice thickness: 4mm with a 0.4mm skip; a matrix of 128 x 128 and a flip angle of 90. A series of 40 multisection acquisitions was acquired at 0.2s interval, field of view: 140 or 150, number of excitations: 1, bolus of Paramagnetic contrast media, gadobenate dimeglumine (Dotarem®), at a dose of 0.1mmol/kg was injected contrast bolus at 5ml/s followed by 20ml saline flush at 3ml/s into the cephalic vein catheter using an automatic power injector (medrad MR Injection System). A series of 40 multisection acquisitions was acquired at 0.2s interval. The first 8 acquisitions were performed before the contrast agent was injected to establish a pre-contrast baseline. Figure 2 shows representative images of an axial MRI of a brain lesion used in this study.
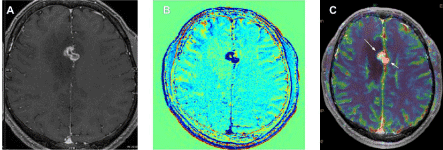
    Figure 2: Axial MRI images of a brain lesion.
A) Irradiated frontal metastasis; Sequence 3D T1 with injection of gadolinium chelate; B) TRAM of subtraction between a sequence at 70min and early sequence;
C) CBV mapping on a 3D morphological sequence. Finding an MRI tumor recurrence.
A 68-year-old patient followed for an encephalic localization irradiated in stereotactic radiotherapy.
Imaging performed 13 months after irradiation revealed left parasagittal contrast associated with perilesional oedema showing washout on TRAM sequence (blue)
and hyperperfusion on CBV mapping suggestive of tumor evolution (recurrence).
We recorded 17 variables including 6 clinical variables (age, primary tumor type, systemic immunotherapy treatment, symptom, surgery or no , final diagnosis) and 11 imaging biomarkers reported by the radiologist (edema, mismatch FLAIR/T1, ratioADC lesion/ADC control, ratioCBV corrected lesion/ CBV corrected control, ratioCBV corrected lesion/CBV corrected control , ratioCBV 95% percentile corrected lesion/CBV 95% percentile corrected control, rHP , PSR , radiological diagnostic hypothesis with all sequences without Delayed Contrast Extravasation MRI generate Treatment Response Assessment Maps (TRAM) , TRAM only, radiological diagnostic hypothesis with all sequences with TRAM). Imaging biomarkers were extracted from 4 MRI sequences: (i) First-pass perfusion or DSC-MRI and a Post-processing of DSC-MRI and DWI images were performed using the Olea MRI analysis software (Brain olea sphere®). The perfusion and diffusion plugin generates relative color perfusion MAP and ADC maps and the quantitative parameters are extracted as relative cerebral blood volume (rCBV), relative amplitude of the peak (rHP) and the percentage signal recovery (PSR); (ii) diffusion DWI; (iii) three-dimensional T1-weighted post-gadolinium (T1 ce w+) (iv) delayed-contrast MRI (TRAM) and (iv) extraction features radiomics with T1 ce w+ acquisition.
Image analysis
Pre-processing: MR images preprocessing included bias field correction using the N4ITK algorithm from the Advanced Normalization Tools (ANTs) library [29], skull-stripping with the Brain Extraction Tool (BET) of the FSL software (FMRIB’s Software Library) [30] and Z-score normalization with a scaling factor of 100. No spatial resampling was performed due to data homogeneity.
Tumor segmentation: Segmentation of the volume of interest, including the contrast-enhanced and necrotic regions, was performed semi-automatically using Olea SphereÒ (Olea Medical). Within a region of interest defined by a trained radiologist (5 year of experience), threshold-based grey level contouring and manual correction were used for the segmentation so that the volume of interest was carefully drawn along the tumor enhancement.
Feature extraction
A total of 100 radiomics features were extracted using the Pyradiomics (version 2.1.2) package [31]. An absolute discretization with a bin size of 64 was chosen. Six features classes were considered: 18 first-order statistics, 14 shape-based features, 22 Grey Level Cooccurrence Matrix features (GLCM), 16 Grey Level Run Length Matrix features (GLRLM), 16 Grey Level Size Zone Matrix features (GLSZM), and 14 Grey Level Dependence Matrix features (GLDM). Using principal component analysis, 20 uncorrelated imaging features were generated by using these 100 features and used for subsequent analysis.
Model building
In the training set, the machine-learning classifier reaching the highest performance, or the prediction of the diagnosis was selected as the radiomics signature. The establishment of the classification model was based on the scikit-learn library version 0.20.3 [32], which included two steps applied to the training set: (1) selection of the machine-learning (ML) classifier and feature scaling method and (2) optimization of the remaining hyper-parameters. In (1), a nested cross-validation was used given the moderately-sized dataset and 135ML models combining 9 feature scaling methods (no scaler, Standard Scaler, Min Max Scaler, Max Abs Scaler, Robust Scaler, Quantile Transformer-normal, Quantile Transformer-uniform, Power Transformer-yeo-johnson, Normalizer) and 15 classifiers (Logistic regression, Quadratic Discriminant Analysis, Adaboost, Bagging, Extra Trees, Decision Tree, Gradient Boosting, Random Forest, Extra Tree, Ridge, SGD, BernouilliNB, GaussianNB, KNeighbors, MLP) were compared. The nested cross-validation considered a 5-fold cross-validation in the inner loop for hyperparameters tuning and a 5-fold cross-validation in the outer loop for the model performance evaluation. In step (2), only the combined model showing the lowest generalization error was kept and a ten repeated 5-fold cross-validation was performed. In this second step, a grid search method was implemented to optimize the remaining hyper parameters. Mean sensitivity, specificity, accuracy, and area under the receiver operating characteristic curve (AUC) and their associated standard deviations were calculated as performance metrics.
Evaluation of the independent test set and comparison to human performance
All cases and associated clinical reports were reviewed by a certified neuroradiologist (A.S) with 10 years of experience, who was blinded to the final histopathological interpretation and the final diagnosis. The interpretation of the expert was then compared with that of the radiomics signature.
The performance of each sequence was evaluated (ADC alone, CBV alone, mismatch T2flair/T1, TRAM) and the performance of the radiologist was calculated without TRAM (the case in all centers) and with TRAM (the case of reading at Gustave roussy).
To ensure that comparison between the performances of radiomics and the expert mimicked clinical conditions, neuroradiologists analyzed all available sequences of the imaging exam as done in clinical routine (post-contrast 3DT1 sequences and the other sequences acquired).
Statistical Analysis
Statistical analysis was performed using R software (version 3.6.2). Sensitivity, specificity, accuracy and AUC were used to assess the diagnosis performances of the radiomics model. A MacNemar test (p-value level of significance 0.05) was used to assess the differences between the diagnostic performances of the radiomics classifier and of the readers at each step of the image analysis described above. AUCs were compared using DeLong’s test for two correlated ROC curves.
Results
Characteristics of the study population are displayed in Table 2
    Characteristic
    Parameter    and Value


    Age    (years)
    Mean:    60


    Median:    63


    Min-Max:    25 - 84


    Sex
    Female:    81(44%)


    Male:    103(66%)


    Primary    Tumor
    Bronchial    Tumor: 82(44%)


    Melanoma:    49(26%)


    Breast    Carcinoma: 25(13%)


    Papillary    Thyroid Carcinoma: 9 (4%)


    Ovarian    Tumor: 6 (3%)


    Clear    Cell Kidney Cancer: 6 (3%)


    Sarcoma:    5 (2.7%)


    Others:    2 (1%)


    Systemic    Treatment
    ICI    (Immunochekpoint Inhibitor Therapy): 73(39%)


    Chemotherapy    or targeted therapy: 112(60%)


    Final    Diagnosis
    Radionecrosis:    113 (61%)


    Tumor    Recurrence: 71 (38%)


    Surgical    Intervention
    Yes: 20    (11%)


    No: 164    (89%)
Table 2: Characteristics of the study participants.
Expert using conventional sequences
In the overall population (n=184), the performance of experts was AUC [95% CI] of (57.4% [50.7%-64.1%]).
Expert using conventional sequences and TRAM
The addition of TRAM sequence led to significant improvement (DeLong’s test, p-value = 7.5 10-8) in the performance of experts AUC [95CI] (78.7% [72.3%-85.1%]).
Quantitative imaging biomarker: quantitative measurement of imaging variables
The performance of the TRAM sequence alone was comparable to expert radiologists (AUC 76.8% [95% CI: 70.3%-83.3%]), hence comparable to approach B. TRAM significantly outperformed all sequences.
Signature
In the training set (n=134), the performance of several models combining all available quantitative and qualitative imaging features quantifying morphological and metabolic characteristics was evaluated. There was minimal improvement in performance by using more than 3 variables, presumably due to the significant correlation between several pairs of variables (Figure 3, Supplementary Figure 1) as well as the excellent performance of TRAM alone.
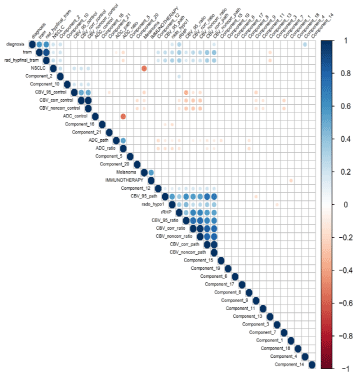
    Figure 3: Correlogram showing the correlation between imaging features.
This correlogram displays correlation between imaging features. The size of the circle shows the strength of the correlation. The color code is used to differentiate
negative (red) and positive correlations (blue). Unsupervised clustering was used to regroup correlated variables. This shows that several imaging biomarkers are
redundant and provide similar information. Of note, the referenced standard (i.e., diagnosis is tumor recurrence is strongly correlated with the TRAM sequence and
the interpretation by a trained radiologist (rad_hypfinal_tram) as well as with the primary tumor type (NSCLC).
Using an unsupervised random forest algorithm, the machinelearning algorithm ranked the most important variables for the diagnosis (Figure 4-6, Table 3 and Supplementary Figure 2-4). The performance of each variable included in the signature, as well as the optimal threshold, are displayed in Figure 4, 5 and 7.
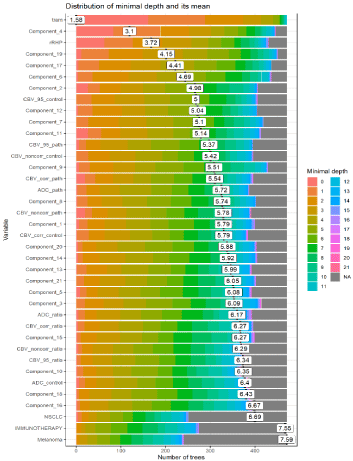
    Figure 4: Unsupervised ranking of the most importance of variables by the random forest algorithm for the diagnosis of TR vs. RN. A) The plot shows the distribution
of minimal depth among the trees of the forest. The mean of the distribution is marked by a vertical bar with a value label on it (the scale for it is dierent than for the
rest of the plot), the scale of the X axis goes from zero to the maximum number of trees in which any variable was used for splitting. Intimal depth for a variable in a
tree equals the depth of the node which splits on that variable and is the closest to the root of the tree. If it is low than a lot of observations are divided into groups
on the basis of this variable. B) This plot summarizes the most important variables for distinguishing TR from RN, based on their performance.
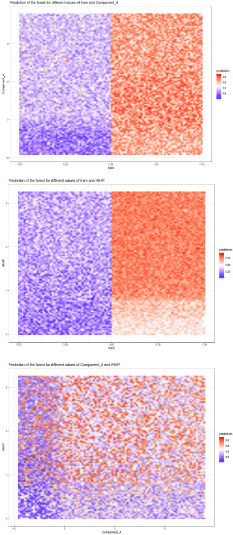
    Figure 5: Probability based upon a combination of variables prediction on
a grid.
The plots below show predictions of the random forest depending on values
of components of an interaction (the values of remaining predictors are
sampled from their empirical distribution) for interactions that consist of two
numerical variables.
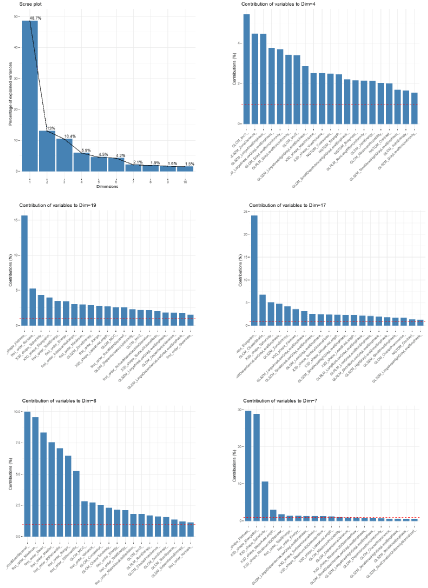
Figure 6: Principal component analysis: top 5 components used to diagnose tumor progression vs. radiation necrosis.
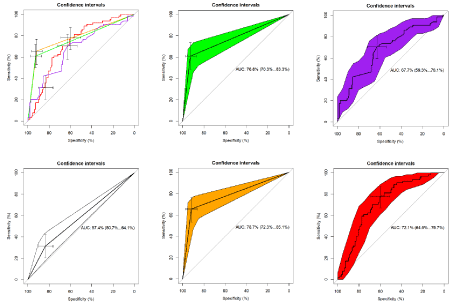
    Figure 7: AUC of single imaging features.
Green: Only TRAM: AUC 76.8% (95%CI: 70.3%-83.3%); Threshold 0.50000 (binary); Specificity 92.7%; Sensitivity 60.9%. Purple: rRHP: AUC 67.7% (95%CI:
59.3%-76.1%); Threshold 0.8516484; Specificity 62.7%; Sensitivity 70.3%. Blue: Radiologist without TRAM: AUC: 57.4% (95%CI: 50.7%-64.1%); Threshold:
0.50000 (binary); Specificity: 83.6%; Sensitivity: 31.3%. Orange: Radiologist with TRAM: AUC 78.7% (95%CI: 72.3%-85.1%); Threshold 0.50000 (binary);
Specificity 91.8%; Sensitivity 65.6%. Red: Component 4: AUC 72.1% (95%CI: 64.5%-79.7%); Threshold -0.882759; Specificity 60.0%; Sensitivity 78.1%
    Variable
    Mean Min Depth
    Number of Nodes
    MSE Increase
    Node Purity Increase
    Number of Trees
    Times a Root
    Top 5 Variables


    ADC_control
    7.6357
    695
    0.0006
    0.5075
    384
    6


    ADC_path
    7.0384
    770
    0.0015
    0.68
    387
    3


    ADC_ratio
    7.3215
    774
    0.0005
    0.5862
    393
    5


    CBV_95_control
    6.1168
    837
    0.0023
    0.9184
    406
    0


    CBV_95_path
    6.6225
    782
    0.0023
    0.6773
    395
    6


    CBV_95_ratio
    7.6925
    748
    0.0007
    0.4909
    377
    1


    CBV_corr_control
    7.1431
    795
    0.0012
    0.5747
    384
    1


    CBV_corr_path
    6.7412
    760
    0.0041
    0.837
    396
    19


    CBV_corr_ratio
    7.3548
    750
    0.0008
    0.5808
    396
    4


    CBV_noncorr_control
    6.6435
    770
    0.0009
    0.5721
    396
    0


    CBV_noncorr_path
    7.0247
    754
    0.0028
    0.7459
    391
    20


    CBV_noncorr_ratio
    7.7233
    689
    0.0012
    0.4901
    372
    5


    Component_1
    6.8889
    794
    0.0019
    0.7116
    400
    6


    Component_10
    7.8153
    699
    -0.0008
    0.4555
    369
    3


    Component_11
    6.1237
    879
    0.0008
    1.0383
    413
    26


    Component_12
    6.1744
    883
    0.0013
    0.9009
    405
    4


    Component_13
    7.1858
    790
    0.0007
    0.6426
    392
    1


    Component_14
    6.9281
    783
    0.0002
    0.7334
    405
    4


    Component_15
    7.3159
    783
    -0.0007
    0.4148
    399
    3


    Component_16
    7.7355
    750
    0.0005
    0.3661
    393
    3


    Component_17
    5.0396
    1000
    0.0035
    1.5013
    437
    5
    #5


    Component_18
    7.5963
    712
    -0.0002
    0.3841
    389
    1


    Component_19
    4.5332
    1058
    0.0049
    2.0053
    451
    11
    #3


    Component_2
    6.0977
    841
    0.0035
    1.1184
    406
    26


    Component_20
    6.9264
    793
    -0.0004
    0.6299
    403
    4


    Component_21
    7.0859
    772
    -0.0001
    0.6237
    402
    0


    Component_3
    6.9388
    827
    0.0014
    0.6228
    414
    0


    Component_4
    3.6342
    1054
    0.0178
    3.3027
    446
    83
    #2


    Component_5
    7.2559
    736
    -0.0004
    0.5101
    392
    9


    Component_6
    5.2944
    969
    0.0039
    1.4261
    437
    4


    Component_7
    5.9822
    922
    0.0015
    1.0073
    419
    0


    Component_8
    6.8205
    794
    0.0025
    0.7218
    402
    3


    Component_9
    6.188
    919
    0.0012
    0.917
    429
    6


    IMMUNOTHERAPY
    9.8602
    373
    0
    0.0467
    275
    0


    Melanoma
    10.2863
    316
    0.0003
    0.0405
    241
    0


    NSCLC
    9.6853
    344
    0.0008
    0.2574
    251
    4


    rRHP
    4.5338
    924
    0.0168
    2.4057
    430
    63
    #4


    tram
    1.5796
    617
    0.1032
    8.2278
    471
    161
    #1


    ADC_control
    7.6357
    695
    0.0006
    0.5075
    384
    6
Table 3: Description of all variables and top 5 important variables based on their performance.
The final signature reaching the highest performance in the training set was obtained from a random forest using regression methods in 500 trees and evaluating 3 variables (TRAM, Component 4, rHP) in each split.
In the validation set, the signature explained 38.24% of the variance with a mean of the squared residuals of 0.1436. The performance was AUC [95% CI] 92% [CI: 87%-97%] but needs to be validated prospectively.
The signature selected imaging biomarkers characterizing the texture and spatial heterogeneity of the lesion on T1w+ sequence that were not correlated with other known imaging biomarkers such as TRAM, ADC, CBV (entropy: AUC: 72.1% [95% CI: 64.5%-79.7%]; rRHP: AUC: 67.7; [95% CI: 59.3%-76.1%]).
Correlation between imaging features
The correlogram shows that several imaging features are providing redundant information (Figure 3, Supplementary Figure 1, 3 and 4). For instance, the primary tumor type is also a predictor: a non-small cell lung cancer is associated with higher probability of tumor recurrence. The referenced standard (presence of tumor recurrence) is correlated with the TRAM and the interpretation by a trained radiologist. It shows that increase TRAM values are correlated with higher probability of tumor recurrence.
The correlogram also shows that some radiomics features are not providing an incremental value since they are significantly correlated with conventional imaging biomarkers. For instance, components 2 and 12 are correlated with CBV.
Of note, in the signature, the second most contributing imaging feature was component 4. Radiomics-derived component 4 was the second most contributive feature and was not correlated with any other known imaging biomarker (TRAM, ADC, and CBV). Hence, Component 4 is providing new information. Of note, Component 4 is derived from principal component analysis and the most contributive feature is GLCM features which is a texture feature.
Discussion
As a standard treatment for brain metastatic lesions, SRS provides superior likelihood of local control by providing focal high dose radiation. The main complication of SRS, radiation-induced injury referred to as RN, can happen in up to 34% of the cases, up to several months following SRS [33,34]. Distinguishing RN with TR is challenging, considering the similarity of initial clinical and imaging manifestations. As both these conditions are associated with significant morbidity and mortality, and their treatments are fundamentally different, early diagnosis is of great clinical importance. Current methods of making the definitive diagnosis are histological findings and/or long term clinical follow up [13,14,35,36]. Histological confirmation necessitates a biopsy from the lesion, an invasive procedure which might not be the optimal choice for many patients. It also raises the problem of how representative the sample is. On the other hand, diagnosing with clinical and imaging follow up requires at least 4-9 months of observation, which significantly limits the opportunity for early treatment [13,14,35,36].
Currently available non-invasive options to distinguish RN and TR include metabolic imaging (MRS, PET, and SPECT) and functional imaging [37]; however, these techniques are of limited availability, are costly, and have not shown efficient sensitivity and specificity in clinical management [14-16]. In this study, we investigated the potential of using routine MRI sequence images in a radiomics model to distinguish RN from TP, compared the performance with that of an expert neuroradiologist, and analyzed the outcomes to propose the superior modality to make this differentiation.
The presence of new contrast on MRI after irradiation of a malignant tumor raises the problem of differential diagnosis between RN and TP. Many criteria have been proposed in the literature based on morphological, functional or metabolic criteria [38]. In the follow-up of irradiated metastases, a transient and moderate increase in lesion volume is possible with a good prognosis. Lesion morphological characteristics (volume, T2/T1 gadolinium ratio) and perfusion analysis, ADC and/or spectroscopy, TRAM plus and radiomics provide useful tools to approach the diagnosis of RN versus TP. We investigated different modalities and presented the best current tools to differentiate RN from TR based on our findings.
We found the TRAM sequence to be the best sequence for distinguishing RN from TP. TRAM sequence performance not only is superior to all conventional sequences currently in use, but also by utilizing the TRAM sequence, the radiologist’s performance increased significantly. Furthermore, TRAM sequence outperformed the radiologist utilizing all the other conventional sequences. TRAM sequence is calculated from delayed contrast MRI, and its advantage in differentiating radiation side effects versus persistent tumoral lesions has been shown in other tissues in recent studies. Peker et al. showed that TRAM sequence shows excellent sensitivity (96%) and positive predictive value (99%) in diagnosing radiation effects in lung cancer [39]. Guez et al. investigated the TRAM sequence in radiation-induced brain vascular malformations mimicking cancer, and reported that TRAM can effectively distinguish the radiation effects and active tumors [40]. In line with literature, our findings suggest that TRAM sequence can be implemented clinically to significantly increase the diagnosis power in distinguishing RN from TP, ultimately to help guide the treatment plan.
The use of Radiomics and machine learning has shown that an imaging biomarker characterizing the texture and spatial heterogeneity of the lesion on a conventional T1 sequence allows to differentiate RN from TR with good performance (Component 4). This parameter is not correlated with other imaging biomarkers and provides independent information. This is of great clinical importance, since it provides additional data to support the diagnosis, and guide the appropriate treatment. The combination of these parameters in a signature has generated satisfactory performances. A prospective validation is warranted to validate these findings, given the sample size of our study.
Our study had some limitations. This is a retrospective monocentric study which could limit the generalizability of the results. However, it was done in a referral oncology center, one of the largest radiotherapy departments in Europe, receiving patients from different backgrounds with a large volume of irradiated brain metastases, with a multidisciplinary team expert in post radiation aspects. There are very limited studies analyzing all the MRI sequences and parameters and our approach provides an original and novel concept in differentiating RN and TP, using MRI as a non-invasive method and optimizing it via machine learning.
Conclusion
We investigated the performance of MRI sequences in distinguishing RN from TP. We utilized multiple parameters extracted from these sequences, created a signature to optimize performance, and compared them together and with radiologist readings. The TRAM sequence is the best sequence for diagnosis of RN. Its performance is superior to all conventional sequences currently in use. The radiologist’s performance significantly increases by utilizing TRAM sequence as well. We found a new, independent imaging parameter (component 4) using radiomics and machine learning which can differentiate RN from TR with great performance. The combination of these parameters in a signature has generated satisfactory performances which could benefit from a prospective validation.
References
- Aoyama H, Shirato H, Tago M, Nakagawa K, Toyoda T, Hatano K, et al. Stereotactic radiosurgery plus whole-brain radiation therapy vs. stereotactic radiosurgery alone for treatment of brain metastases: a randomized controlled trial. JAMA. 2006; 295: 2483-2491.
- Andrews DW, Scott CB, Sperduto PW, Flanders AE, Gaspar LE, Schell MC, et al. Whole brain radiation therapy with or without stereotactic radiosurgery boost for patients with one to three brain metastases: phase III results of the RTOG 9508 randomised trial. The Lancet. 2004; 363: 1665-1672.
- Mehrabian H, Desmond KL, Soliman H, Sahgal A, Stanisz GJ. Differentiation between radiation necrosis and tumor progression using chemical exchange saturation transfer. Clinical Cancer Research. 2017; 23: 3667-3675.
- Hoefnagels FW, Lagerwaard FJ, Sanchez E, Haasbeek CJ, Knol DL, Slotman BJ, et al. Radiological progression of cerebral metastases after radiosurgery: assessment of perfusion MRI for differentiating between necrosis and recurrence. Journal of neurology. 2009; 256: 878-887.
- Robbins M, Greene-Schloesser D, Peiffer AM, Shaw E, Chan MD, Wheeler KT. Radiation-induced brain injury: A review. Frontiers in oncology. 2012; 2: 73.
- Shaw PJ, Bates D. Conservative treatment of delayed cerebral radiation necrosis. Journal of Neurology, Neurosurgery & Psychiatry. 1984; 47: 1338- 1341.
- Patel U, Patel A, Cobb C, Benkers T, Vermeulen S. The management of brain necrosis as a result of SRS treatment for intra-cranial tumors. Translational Cancer Research. 2014; 3: 373-382.
- Huang C-F, Chiou S-Y, Wu M-F, Tu H-T, Liu W-S, Chuang J-C. Apparent diffusion coefficients for evaluation of the response of brain tumors treated by Gamma Knife surgery. Journal of neurosurgery. 2010; 113: 97-104.
- Orlhac F, Soussan M, Chouahnia K, Martinod E, Buvat I. 18F-FDG PETderived textural indices reflect tissue-specific uptake pattern in non-small cell lung cancer. PLoS One. 2015; 10: e0145063.
- Lupo JM, Cha S, Chang SM, Nelson SJ. Dynamic susceptibility-weighted perfusion imaging of high-grade gliomas: characterization of spatial heterogeneity. American Journal of Neuroradiology. 2005; 26: 1446-1454.
- Mitsuya K, Nakasu Y, Horiguchi S, Harada H, Nishimura T, Bando E, et al. Perfusion weighted magnetic resonance imaging to distinguish the recurrence of metastatic brain tumors from radiation necrosis after stereotactic radiosurgery. Journal of neuro-oncology. 2010; 99: 81-88.
- Sugahara T, Korogi Y, Tomiguchi S, Shigematsu Y, Ikushima I, Kira T, et al. Posttherapeutic intraaxial brain tumor: the value of perfusion-sensitive contrast-enhanced MR imaging for differentiating tumor recurrence from nonneoplastic contrast-enhancing tissue. American Journal of Neuroradiology. 2000; 21: 901-909.
- Asao C, Korogi Y, Kitajima M, Hirai T, Baba Y, Makino K, et al. Diffusionweighted imaging of radiation-induced brain injury for differentiation from tumor recurrence. American Journal of Neuroradiology. 2005; 26: 1455-1460.
- Dequesada IM, Quisling RG, Yachnis A, Friedman WA. Can standard magnetic resonance imaging reliably distinguish recurrent tumor from radiation necrosis after radiosurgery for brain metastases? A radiographicpathological study. Neurosurgery. 2008; 63: 898-904.
- Barajas R, Chang J, Sneed P, Segal M, McDermott M, Cha S. Distinguishing recurrent intra-axial metastatic tumor from radiation necrosis following gamma knife radiosurgery using dynamic susceptibility-weighted contrastenhanced perfusion MR imaging. American journal of neuroradiology. 2009; 30: 367-372.
- Sundgren P. MR spectroscopy in radiation injury. American journal of neuroradiology. 2009; 30: 1469-1476.
- Limkin E, Sun R, Dercle L, Zacharaki E, Robert C, Reuzé S, et al. Promises and challenges for the implementation of computational medical imaging (radiomics) in oncology. Annals of Oncology. 2017; 28: 1191-1206.
- Tuytelaars T, Mikolajczyk K. Local invariant feature detectors: a survey: Now Publishers Inc. 2008.
- Kassner A, Thornhill R. Texture analysis: a review of neurologic MR imaging applications. American Journal of Neuroradiology. 2010; 31: 809-816.
- Dalal N, Triggs B, editors. Histograms of oriented gradients for human detection. 2005 IEEE computer society conference on computer vision and pattern recognition (CVPR’05). 2005.
- Ambrosini RD, Wang P, O’Dell WG. Computer-aided detection of metastatic brain tumors using automated three-dimensional template matching. Journal of Magnetic Resonance Imaging. 2010; 31: 85-93.
- Kano H, Kondziolka D, Lobato-Polo J, Zorro O, Flickinger JC, Lunsford LD. T1/T2 matching to differentiate tumor growth from radiation effects after stereotactic radiosurgery. Neurosurgery. 2010; 66: 486-492.
- Reddy K, Westerly D, Chen C. MRI patterns of T1 enhancing radiation necrosis versus tumour recurrence in high-grade gliomas. Journal of medical imaging and radiation oncology. 2013; 57: 349-355.
- Tiwari P, Prasanna P, Wolansky L, Pinho M, Cohen M, Nayate A, et al. Computer-extracted texture features to distinguish cerebral radionecrosis from recurrent brain tumors on multiparametric MRI: a feasibility study. American Journal of Neuroradiology. 2016; 37: 2231-2236.
- Kumar AJ, Leeds NE, Fuller GN, Van Tassel P, Maor MH, Sawaya RE, et al. Malignant gliomas: MR imaging spectrum of radiation therapy-and chemotherapy-induced necrosis of the brain after treatment. Radiology. 2000; 217: 377-384.
- Chan Y-l, Leung S-f, King AD, Choi PH, Metreweli C. Late radiation injury to the temporal lobes: morphologic evaluation at MR imaging. Radiology. 1999; 213: 800-807.
- Shah M, Xiao Y, Subbanna N, Francis S, Arnold DL, Collins DL, et al. Evaluating intensity normalization on MRIs of human brain with multiple sclerosis. Medical image analysis. 2011; 15: 267-282.
- Reinhold JC, Dewey BE, Carass A, Prince JL, editors. Evaluating the impact of intensity normalization on MR image synthesis. Medical Imaging 2019: Image Processing; 2019: International Society for Optics and Photonics.
- Smith SM. Fast robust automated brain extraction. Human brain mapping. 2002; 17: 143-155.
- Nyúl LG, Udupa JK, Zhang X. New variants of a method of MRI scale standardization. IEEE transactions on medical imaging. 2000; 19: 143-150.
- Breiman L. Random forests. Machine learning. 2001; 45: 5-32.
- van Velden FH, Kramer GM, Frings V, Nissen IA, Mulder ER, de Langen AJ, et al. Repeatability of radiomic features in non-small-cell lung cancer [18F] FDG-PET/CT studies: impact of reconstruction and delineation. Molecular imaging and biology. 2016; 18: 788-795.
- Le Rhun E, Dhermain F, Vogin G, Reyns N, Metellus P. Radionecrosis after stereotactic radiotherapy for brain metastases. Expert review of neurotherapeutics. 2016; 16: 903-914.
- Garcia GC, Bockel S, Majer M, Ammari S, Smits M. Imaging of brain metastases: diagnosis and monitoring. Central Nervous System Metastases: Springer. 2020: 145-158.
- Minniti G, Clarke E, Lanzetta G, Osti MF, Trasimeni G, Bozzao A, et al. Stereotactic radiosurgery for brain metastases: analysis of outcome and risk of brain radionecrosis. Radiation oncology. 2011; 6: 1-9.
- Kimura T, Sako K, Tanaka K, Gotoh T, Yoshida H, Aburano T, et al. Evaluation of the response of metastatic brain tumors to stereotactic radiosurgery by proton magnetic resonance spectroscopy, 201TlCl single-photon emission computerized tomography, and gadolinium-enhanced magnetic resonance imaging. Journal of neurosurgery. 2004; 100: 835-841.
- Chao ST, Ahluwalia MS, Barnett GH, Stevens GH, Murphy ES, Stockham AL, et al. Challenges with the diagnosis and treatment of cerebral radiation necrosis. International Journal of Radiation Oncology* Biology* Physics. 2013; 87: 449-457.
- Raimbault A, Cazals X, Lauvin M-A, Destrieux C, Chapet S, Cottier J-P. Radionecrosis of malignant glioma and cerebral metastasis: a diagnostic challenge in MRI. Diagnostic and interventional imaging. 2014; 95: 985-1000.
- Peker S, Samanci Y, Aygun MS, Yavuz F, Erden ME, Nokay AE, et al. The Use of Treatment Response Assessment Maps in Discriminating Between Radiation Effect and Persistent Tumoral Lesion in Metastatic Brain Tumors Treated with Gamma Knife Radiosurgery. World Neurosurgery. 2021; 146: e1134-e1146.
- Guez D, Last D, Daniels D, Sharabi S, Nass D, Nissim O, et al. Radiationinduced vascular malformations in the brain, mimicking tumor in MRI-based Treatment Response Assessment Maps (TRAMs). Clinical and translational radiation oncology. 2019; 15: 1-6.