Review Article
Austin J Robot & Autom. 2014;1(1): 5.
Evaluation of the Vertical Wheel Loads of a Heavy Vehicle with Two Different Experimental Methods
Dimitrios Koulocheris*
Department of Mechanical Design & Automatic Control, National Technical University of Athens, Greece
*Corresponding author: Dimitrios Koulocheris, School of Mechanical Engineering, Department of Mechanical Design & Automatic Control, Vehicles Laboratory, National Technical University of Athens (NTUA), PO BOX 157 80, Heroon Polytechniou 9, Zografou Campus, Athens, Greece
Received: August 11, 2014; Accepted: October 14, 2014; Published: October 16, 2014
Abstract
Dynamic tyre forces are thought to be a cause of increased damage to roads caused by heavy vehicles. For many years, research into “vehicle-highway interaction” involved measuring or simulating the dynamic tyre forces generated by heavy vehicles, without reference to the response of the road surface. As a consequence, there is a considerable literature concerning dynamic tyre forces generated by trucks. A variety of techniques can use for measuring the dynamic tyre forces generated by heavy vehicles. In our laboratory a combination of accelerometers and strain gauges had been used to determine the wheel forces through measuring the shear and bending strains, and the accelerations of the wheels. Our research focused on the comparison of these methods and especially on the understanding of the dynamic behavior of the forces applied on the two wheels. A variety of road tests were conducted in order to evaluate the methods in depth during cornering, accelerating, and other cases.
Keywords: Wheel loads; Shear strains; Experimental; Instrumentation techniques; Vertical forces; Heavy vehicle
Introduction
Dynamic tire forces have been considered as the source of the increased damaged caused to the roads by heavy vehicles [1-3]. For many years, research into ‘vehicle-highway interaction’ involved measuring or simulating the dynamic tire forces generated by heavy vehicles, without reference to the response of the road (of bridge) surface. As a consequence, there is considerable literature concerning dynamic tire forces generated by trucks.
In more recent times, the response of road and bridge surfaces to dynamic vehicle loads has been investigated. In order to understand the interactions between the vehicle and its gateway, and hence to devise improvements or assessment procedures for either system, it is useful to have a basic understanding of the principal features of dynamic tire forces [4-6].
A variety of techniques can be used for measuring dynamic tire forces generated by heavy vehicles. For testing programs involving a limited number of vehicles, it is convenient and practical to mount instrumentation on each vehicle. A combination of accelerometers and strain gauges has been traditionally used to determine the wheel forces [7]. Various methods have been developed such as the ones through measuring the shear and bending strains and using the dynamic equilibrium of the vertical forces and the dynamic equilibrium of the bending moments respectively, and the vertical accelerations of the wheels [8-10]. In some applications, however, it is desirable to measure dynamic tire forces without instrumenting vehicles.
In this study the results of the wheel loads of a heavy vehicle through the measurements of the shear and the bending strains are presented. The aim of this work is to illustrate the behavior of the forces applied on the two wheels and to evaluate the regression of the forces with the vertical acceleration of the wheels, as a predictor variable. The main subject is to compare the forces and reach to a conclusion regarding the possible improvements. The road tests, which were conducted, were divided in four different cases during accelerating, right cornering, driving on inclined road and passing an obstacle.
Vehicle-Based Systems
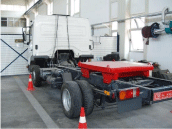
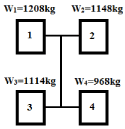
The object of the tests was a heavy vehicle, category N2, and specifically an At ego 815 of Daimler Chrysler. The sensors were mounted on the vehicle in order to measure the vertical acceleration of the two wheels, the bending and the shear strains (Figures 1,2).
Figure 1: Daimler Chrysler Atego 815.
Figure 2: Distribution of mass of the vehicle.
The sensors were connected with MGC plus, HBM’s amplifier system, and the data were recorded and accessed online through the Catman software. The instrumentation setup consists of three parts so that the data could be obtained, recorded and accessed online:
- The sensors which are responsible for measuring the phenomenon (oscillation, strain, pressure, temperature, speed etc.) and for converting it in an electrical signal.
- The amplifiers, both in the interior of MGC plus and whenever needed in the instrumentation setup, recording the signal with the chosen sampling rate.
- The software, which is able to obtain the data from MGC plus in order to present them both during (on line) and after (off line) the tests (Figure 3).
Figure 3: The three parts of the instrumentation setup.
Accelerometers
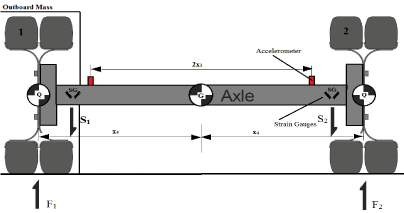
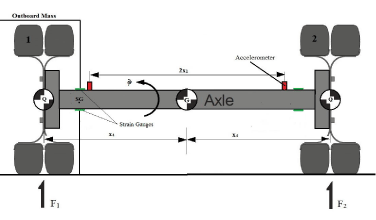
The other part of the instrumentation system consists of two accelerometers that measure the vertical accelerations Z1 and Z2 of the axle. The selected accelerometers are Kistler’s 8704B and the type of mounting that was selected was the magnetic mount on a small base. They have been mounted between the spring mounting and the brake black plate, as shown in (Figure 4 b). The measured accelerations are used to correct the measured shear forces for the inertia force and couple generated by the acceleration of the outboard mass. It’s important that the sensors are as close to the wheel as possible in order to minimize the difference between the distance from the center of the axle to accelerometer and the distance from the center of the axle to the center of the gravity of the mass outboard of the strain gauges (Figure a,b).
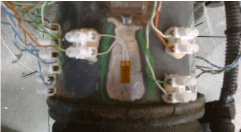
Figure 4: (a) Strain Gauged Axle, (b) Accelerometer.
Strain Gauged Axle
Method A’ by measuring the shear strains: The instrumentation system consists of two pairs of strain gauges, as shown in figure 4(a), mounted on the front and rear faces of the axle, oriented at 45° to the vertical and 90° between the two strains of each pair. It’s important that there isn’t an error in the mounting angle larger than 5 degrees because it will produce an error around 1 to 5% in the final measurement, called misalignment error. The two pairs of strain gauges in the following instrumentation create a full bridge setup, which is responsible of measuring strains due to axle shear and hence the shear forces S1 and S2. The full bridge was selected as a means of compensating the thermal strains at high level. Also, it’s crucial to mount the strain gauges as close as possible to the neutral plane so as to avoid superimposed bending strains to the measurement (Figure 5).
Figure 5: Strain Gauged Axle.
Method B’ by measuring the bending strains: The instrumentation setup, in this method, consists of two strain gauges, as shown in figure 5, mounted on the upper and lower surfaces of the axle between the brake plate and the wheels. The half bridge was selected in order to avoid superimposed normal strains to occur in the result and to compensate the thermal strain in a high degree. Also, in this instrumentation setup the strain gauges have to be as close as possible to the wheel in order to minimize the difference between the distance from the mounting point of the strain gauges to the center of the gravity of the outboard mass and the distance from the mounting point of the strain gauges to the center of the wheel.
Theoretical Background
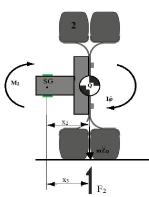
The theory behind the strain-gauged axle housing transducers is derived from conditions of dynamic equilibrium of the free body diagram of the wheel and the axle stud. Especially, the wheel load measurement methods, used in this paper, are based on the dynamic equilibrium of the vertical forces for the Method A’ and the dynamic equilibrium of the moments acting on the mass outboard the strain gauges for the Method B’ [1,11]. The derivation of the equations is based on rigid body theory and on the assumption of small angles; sinφ and cosφ are approximated as φ and 1, respectively (Figure 6).
Figure 6: Free Body Diagram of the wheel and the axle stud (Method A’).
The vertical accelerations of the center of the axle and the roll acceleration of the axle can be calculated from the outputs of the accelerometers placed near the wheels, according to the following equations:
where 2x1 is the distance between the two accelerometers. Using the assumption of the small angles and, thus, the fact that the roll angle is small, the vertical acceleration of the center of the gravity of the outboard mass of the strain gauges is:
where x4 is the distance between the center of the gravity of the outboard mass and the center of the axle. Regarding the mass outboard of the strain gauges, it refers to all the axle components outboard the point SG (axle housing, brakes, wheel and tire), shown in figure 6. It isn’t sure that these components would always be the same for every truck, due to the fact that for every vehicle there is a different design regarding the position of the brakes. So, in the specific truck the axle components of the mass outboard the strain gauges are the axle housing, the wheel, the tire and the brake plates (Figure 7).
Figure 7: Free Body Diagram of the wheel and the axle stud (Method B’).
Method A’ by measuring the shear strains
The vertical acceleration of the outboard mass m is responsible for the inertia force that corrects the shear forces. Considering now the dynamic equilibrium of the vertical forces and using Newton’s Second Law, the wheel load is:
Similar equations apply for the left wheel and the shear force F1.
Method B’ by measuring the bending strains (Figure 8)
The vertical acceleration of the outboard mass m results in an inertia force X2 m and is responsible for the inertia force that corrects the bending moments. The rotational acceleration of the outboard components results in an inertia couple , where I is the roll inertia about Q of the components outboard the point SG. Considering now the dynamic equilibrium of the moments acting on the mass outboard the point SG, the wheel load is:
Figure 8: Free Body Diagram of the left rear wheel (Method B’).
Similar equations apply for the left wheel and the shear force F1.
Experimental Results
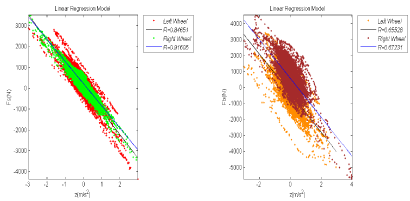
The methods described were evaluated in depth during accelerating, right cornering, driving in a road with a slope and passing obstacles. The road tests conducted were about 15-20 seconds long and the data, obtained with a sampling rate of 1200Hz, contained 20,000 measurements. At last, a test was conducted around the campus in order to clarify whether the behavior is the same in a test which contained all the separate cases and had a greater number of data. The data were analyzed in order to try and fit the resulted forces of each wheel in linear regression models, with the vertical acceleration as a predictor variable. Then we compared the measured forces and the fitted linear models of each wheel in each road test.
Accelerating
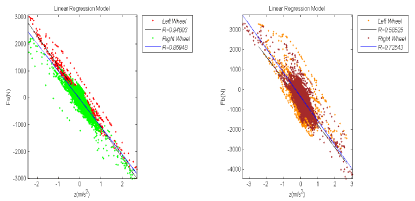
The loads of the left and right wheel with the method A’ fit equations (6) and (7) respectively:
y=-1122x+30.50 R2=0.90 (6)
y=-1022x-49.92 R2=0.76 (7) (Figure 9a,b)
Figure 9: Linear regression model for the relation between the forces and the vertical accelerations of the wheel during accelerating (a) Method A’ (b) Method B’.
While, the loads of the left and right wheel with the method B’ fit equations (8) and (9) respectively:
y=-1132x-637.50 R2=0.34 (8)
y=-1201x-368.23 R2=0.53 (9)
Cornering right
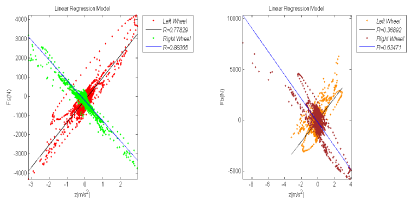
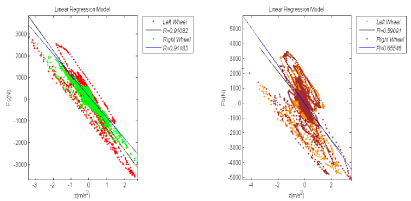
The loads of the left and right wheel with the method A’ fit equations (10) and (11) respectively:
y=1162x-188.65 R2=0.61 (10)
y=-1049x-239.54 R2=0.78 (11) (Figure 10 a,b)
Figure 10: Linear regression model for the relation between the forces and the vertical accelerations of the wheel during accelerating (a) Method A’ (b) Method B’.
While, the loads of the left and right wheel with the method B’ fit equations (12) and (13) respectively:
y=-1067x-32.50 R2=0.14 (12)
y=1157x-212.78 R2=0.40 (13)
Road with a slope
The loads of the left and right wheel with the method A’ fit equations (14) and (15) respectively:
y=-1145x+59.89 R2=0.72 (14)
y=-1066x+226.67 R2=0.84 (15)
While, the loads of the left and right wheel with the method B’ fit equations (16) and (17) respectively:
y=-1218x-353.50 R2=0.43 (16)
y=-1213x+551.03 R2=0.45 (17) (Figure 11 a,b)
Figure 11: Linear regression model for the relation between the forces and the vertical accelerations of the wheel during accelerating (a) Method A’ (b) Method B’.
Step input
The loads of the left and right wheel with the method A’ fit equations (18) and (19) respectively:
y=-1137x-39.75 R2=0.83 (18)
y=-966x-136.75 R2=0.83 (19) (Figure 12 a,b)
Figure 12: Linear regression model for the relation between the forces and the vertical accelerations of the wheel during accelerating (a) Method A’ (b) Method B’.
Accelerations of the wheel during accelerating (a) Method A’ (b)
While, the loads of the left and right wheel with the method B’ fit equations (20) and (21) respectively:
y=-1145x-161.60 R2=0.35 (20)
y=-1255x+2.34 R2=0.43 (21)
Complete road test
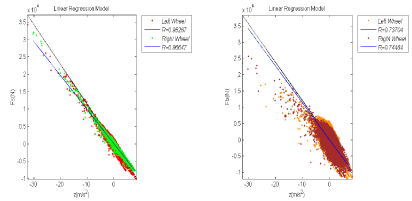
The loads of the left and right wheel fit equations (22) and (23) respectively:
y=-1141x-1.14 R2=0.91 (22)
y=-975x-115.42 R2=0.93 (23) (Figure 13 a,b)
Figure 13: Linear regression model for the relation between the forces and the vertical accelerations of the wheel during accelerating (a) Method A’ (b) Method B’.
Accelerations of the wheel during accelerating (a) Method A’ (b) Method B’.
While, the loads of the left and right wheel with the method B’ fit equations (24) and (25) respectively:
y=-1117x-316.90 R2=0.54 (24)
y=-1130x+27.88 R2=0.55 (25)
Conclusion
In conclusion, in all cases, the final linear regression model showed that measured wheel loads follow Newton’s Second Law applied on the wheels, as all the fitted equations comply with:
y= mTotal x + error (26)
Regarding the Method A’, the measured results of the forces of the wheels have a good fit in the linear regression model, as shown in figures 6(a), 7(a), 8(a), 9(a), 10(a), and specifically the coefficients of these models have reached at some point the expected values. The factor of x reaches the total mass of the right and left part of the vehicle with a high value of R (regression factor). On the other hand, the Method B’ didn’t reach at any case the accuracy that was achieved with the Method A’. The regression factors R were acceptable but not that high and the convergence to the static measured mass was satisfactory. All in all, the mass distribution, shown in figure 2, compared with the coefficients of the models allows us to understand the reliability of the results of the measured forces in both the two methods.
During this analysis, the road test of right cornering showed in the results the behavior of the vehicle and especially the use of the antiroll bar. As shown in figure 7(a) and 7(b), the forces applied on the right wheel are in counter direction in order to stabilize the vehicle during cornering. Furthermore, the left wheel has a larger increase of load from the measured static load than the left wheel, proving the fact that in both the methods forces of lower values apply to the internal wheels during cornering.
Another issue that has to be mentioned is the high value of the regression factor, R, in the step input in Method A’. In this case, the factor of x reached the total mass of the rear right and left wheels with high accuracy in addition to other cases. This could be explained because, as mentioned above, the accelerations are used to correct the measured shear forces and thus during the step input there are higher values of accelerations and probably a better correction of the shear forces.
Finally, promising were the results of the complete road test. At first, the regression between the forces and the vertical accelerations, in Method A’, were really high and because the factor of x reached the mass of both wheels at a great level with an insignificant error, as shown in equations (22) and (23) based on equation (26). Considering that in the complete road test all the separate cases, and more, were involved proves that the test was reliable. This refers to the Method B’, as well. Despite the fact that in the separate case the regression factors weren’t good enough, in the complete test there was an increase in their values.
To sum up, the difference in the reliability and the accuracy of the two methods was something expected in some level. In Method B’, the presence of the roll inertia, which is difficult to be evaluated, decreases the accuracy of the test contrast to Method A’ which demands the outboard mass in order to evaluate the forces. Additionally, the main disadvantage of Method B’ is that roll or slide-slip motion can cause errors to the measured bending strains due to the applied side forces or the variation of the moment arm x3. Besides the disadvantages and the results mentioned above, this Method has an advantage that should be taken in consideration. The measurements of the bending strains are less prone to noise because there are larger than the shear strains (by a factor of 2.5-3) and this makes them more accurate.
Taking into account the advantages and the disadvantages of Method B’, further research is in progress in order to improve the results by evaluating the side forces acting on the wheels and trying to calculate with more accuracy the roll inertia.
References
- Cebon D. Handbook of Vehicle-Road Interaction, Swets & Zeitlinger, Lisse, the Netherlands. 1999.
- Wong JY. Theory of Ground Vehicles, John Wiley & Sons, United States of America. 2008.
- Reza NJ. Vehicle Dynamics Theory and Application, Springer, New York. 2008.
- Heising B, Mertin Ersoy. Chassis Handbook, Fundamentals, Driving Dynamics, Components, Mechatronics, Perspectives, Vieweg+Teubner, Germany. 2011.
- Mike Blundell, Damian Harty. Multibody Systems Approach to Vehicle Dynamics, Elsevier Butter worth Heinemann, New York. 2004.
- Hans B. Pacejka. Tire and Vehicle Dynamics, Elsevier Butterworth Heinemann, Great Britain. 2002.(11)
- Hoffmann K. An Introduction to Stress Analysis and Transducer Design using Strain Gauges, HBM,Germany.1989.
- Koulocheris D, Dertimanis V, Spentzas C. Structural Optimization of a fixed-tank vehicle using complex method, Limassol, Proceedings of 5th GRACM International Congress on Computational Mechanics. 2005.
- Koulocheris D. “Optimum Dynamic performance of a tank vehicle”, International Review of Mechanical Engineering (I.RE.ME). 2007; 1: 218-224.
- Koulocheris D, Dertimanis V. “Calculation of a fixed-tank vehicle optimum dynamic performance”, Procedia Social and Behavioral Sciences. 2008; 48: 2230-2240.
- Koulocheris D, Dertimanis V, Spentzas C. Estimation of vehicle’s structural parameters from multi-channel vibration measurements, Proceedings of 21st JUMV International Automotive Conference. 2007.
