
Research Article
J Schizophr Res. 2025; 12(1): 1049.
Predicting Schizophrenia via Cognitive Biomarkers: Development of a Machine Learning Algorithm for Early Diagnosis
Lyakhov ML*
Great Neck North High School, USA
*Corresponding author: Michael Lyakhov, Great Neck North High School, USA Email: mlyakhov1@student.gn.k12.ny.us
Received: March 31, 2025 Accepted: April 16, 2025 Published: April 21, 2025
Abstract
Schizophrenia (SCZ) is a chronic psychiatric disorder affecting over 20 million people worldwide, with early diagnosis hindered by inconsistent biomarkers and subtle symptom onset. This study presents a machine-learning pipeline to identify cognitive biomarkers from neuroimaging data for early and reliable SCZ diagnosis. Resting-state and Multi-Source Interference Task (MSIT) fMRI datasets were analyzed, highlighting key regions such as the anterior cingulate and dorsolateral prefrontal cortex. A novel approach integrated MSITderived features—linked to psychosis treatment progression—into resting-state data from prodromal patients. This enabled the prediction of psychosis onset through functional connectivity and machine learning. The pipeline automates preprocessing, feature extraction, and classification, and is available as an opensource Python library, promoting reproducibility and scalability. This research underscores the potential of cognitive biomarkers in early SCZ detection and offers a robust framework for broader psychiatric applications. Future work will explore multi-modal data integration to improve diagnostic precision across
Introduction
Over twenty million individuals worldwide have schizophrenia (SCZ), a severe and long-lasting mental illness. However, only 30% of cases improve because 50% of patients refuse treatment, and another 20% are unresponsive to drugs [1]. Those with SCZ typically experience a plethora of symptoms, especially as the disease progresses, including hallucinations, delusions, and disorganized speech, which can significantly reduce quality of life and impair daily function [1]. SCZ signs are clustered into broad categories of positive and negative symptoms.
Positive Symptoms
The active stage of SCZ, also known as psychosis, is when positive symptoms, those that result in an excess or distortion of behaviors [2], are most prevalent, with patients experiencing hallucinations, delusions, thought disorder, and hyperactivity [3].
Hallucinations and Delusions: Hallucinations are sensory fabrications in which a perceived sensory input accompanies false perceptions of reality, while delusions are false perceptions of reality that persist despite contrary evidence [3]. Antipsychotic medications are effective in treating these symptoms by blocking the dopamine-2 (D2) receptor, therefore easing hyperactive dopamine transmission and handling delusional symptoms [4]. Side effects of antipsychotics yield complications ranging from relatively unpleasant (e.g., constipation, sexual dysfunction) to disfiguring (e.g., weight gain, tardive dyskinesia) to life-threatening (e.g., myocarditis, agranulocytosis) as described by patients [5]. These effects may repel patients from continuous use of medications despite doctor recommendations.
That is, the more obvious, substantial symptoms of SCZ—thus the ones that impel most patients to get treatment—are hallucinations and delusions, both of which can be treated with a 75% success rate [4]. Delusions, however, can quickly become imperceptible to patients, as this symptom also entails one of the most dangerous developments associated with SCZ—anosognosia.
Anosognosia: Anosognosia is defined as a condition in which one is in denial of an apparent disability or deficit, frequently resulting in a patient’s refusal of treatment [3]. In many patients with SCZ, delusions develop into a fervent denial of treatment before professional help can intervene [3].
Negative Symptoms
The negative symptoms of SCZ, which include cognitive impairment, disorganized thought, and social withdrawal, are prevalent throughout the illness’s entire progression [2]. These symptoms are also seen as the first, preluding symptoms of SCZ.
Cognitive Impairment: The most prominent negative symptom observed is cognitive impairment, which includes executive function, attention, and working memory problems. Cognitive impairment is typically quantified through the measurement of a patient’s performance on a series of brain tasks. The MATRICS™ Consensus Cognitive Battery (MCCB™) Evaluation is a collection of 10 diverse examinations that is used as the industry standard in determining a change in cognitive function and targets common cognitive domains associated with SCZ [6]. Cognitive Remediation Therapy (CRT) is a treatment strategy for enhancing cognitive abilities in individuals with SCZ. However, it is expensive and grows to be less effective as SCZ progresses [2]. Moreover, CRT is especially unsuccessful for anosognosic SCZ patients, as they are typically confrontational and skeptical of treatment [7].
Thought Disorder: Thought disorder (TD), more colloquially known as disorganized thinking, can be especially damaging because it impairs the ability of the patient to self-reflect, thus exacerbating anosognosia [8]. Moreover, even if the patient is not enduring a psychotic episode, TD significantly detriments daily life by rendering patients unable to speak coherently and reason [9]. Further, as shown in Figure 1, neurological anosognosia symptoms are similar to those of neurocognitive disorders like TD.
Social Withdrawal: Many individuals with SCZ remove themselves from social interactions, which is coupled with an overall lack of motivation. Social withdrawal is a particularly troubling symptom, as it diminishes both the likelihood and quality of treatment participation [10,11]. As individuals retreat further from social interactions, they often lose the opportunity for supportive relationships that might encourage trust in medical interventions. Various psychosocial and cognitive-based interventions like CRT may be effective in addressing certain symptoms of SCZ [12]. Individuals exhibiting social withdrawal often demonstrate high dropout rates and low treatment engagement. [12].
Early Diagnosis
The premature diagnosis of SCZ can alleviate and prevent the development of the disorder by avoiding the transition into a state of psychosis. If the disorder was diagnosed prematurely, there would be a smaller likelihood of patients developing anosognosia, and therefore, the chance of a full recovery would dramatically increase [13].
Chemical Biomarkers
Biomarkers are specific metrics that serve as indications of disease development. Chemical biomarkers, such as neurotransmitter levels, inflammatory markers, and specific proteins found in cerebrospinal fluid or blood, have long been investigated for their potential to aid in the prognosis of SCZ [14]. Such biomarkers aim to offer objective measures that reflect underlying biological processes associated with the disorder, potentially enabling early detection and more targeted interventions. However, they have proven largely ineffective as reliable diagnostic tools because they are either not specific enough, resulting in a mistaken indication of the disorder, or they are too specific and only apply to statistically insignificant fragments in a dataset [15]. Moreover, the etiology of SCZ has not yet been identified, which further limits the specificity of biomarkers, as studies tend to identify clusters of interdependent biomarkers rather than exclusive ones [15]. Chemical biomarkers often display significant variability between individuals with SCZ. Factors like genetic background, environmental influences, lifestyle, and even concurrent medications can affect biomarker levels, leading to inconsistent results across patient populations [16]. This variability complicates efforts to establish standardized biomarker thresholds that reliably indicate SCZ, as opposed to individual variability or external factors. For example, a study by Saha et al. [17] found that neurotransmitter levels can fluctuate based on the stage of illness, current symptoms, or even the time of day. Such instability limits their utility for consistent diagnosis, as levels may not correlate directly with the patient’s current clinical state.
Problem Statements
1. Variability and Limitations of Biomarkers for SCZ Diagnosis.
Biomarkers cannot currently yield accurate prognoses for SCZ because of the multifaceted nature of the disease's etiology.
2. Treatment Resistance and the Impact of Anosognosia.
A major barrier to effective treatment in SCZ is anosognosia. This phenomenon is particularly prevalent in individuals who suffer from the second stage of SCZ, which involves delusions/hallucinations and can be avoided if the illness is treated before psychosis ensues. Compounded by cognitive impairment and social withdrawal, anosognosia prevents patients from seeking or adhering to necessary interventions despite existing treatments, which exacerbates the disease’s progression. As such, a preliminary diagnostic tool is needed to most effectively treat SCZ.
Objectives
1. This study seeks to develop a prognosis algorithm based on a comprehensive assessment of the negative symptoms of SCZ that can identify cognitive biomarkers.
2. The prognosis algorithm will also use fMRI data to predict whether an individual will develop schizophrenia--more specifically, psychosis--, thereby increasing early intervention rates in SCZ and preventing treatment refusal.
Methodology
Role of Student vs. Mentor
I conducted all of the work for this project independently, including the development of the machine learning (ML) model and the execution of the data analysis framework. My mentor, Mrs. York, provided minimal edits to my paper, but the conceptualization, implementation, and refinement of the ML model and the adaptive application were entirely self-directed.
Participants and Data Sources
This study utilized two datasets from Zucker Hillside Hospital containing functional magnetic resonance imaging (fMRI) scans of participants completing the MSIT task before and after 12 weeks of treatment and resting-state fMRI for patients in the prodromal stage of SCZ. These datasets provided the trajectory of cognitive improvement with treatment in disidentified patients with SCZ, which was later emulated by an ML algorithm to identify biomarkers. Participants in the datasets were diagnosed with SCZ according to DSM-5 criteria. fMRI scans were included only if they demonstrated minimal motion artifacts, defined as less than 3 mm of translational movement and 3° of rotational deviation. The datasets consisted of a diverse participant pool with significant age and ethnicity ranges to maximize the model's generalizability.
Equipment and Software
The study utilized a Windows-11-based workstation with an Intel Xeon W-2255 processor, 64 GB RAM, and a 2 TB solid-state drive for computational tasks. A VPN was established to the dataset’s network via SSH X11 forwarding with PuTTy and Xming. All processing, ML model development, and figure creation were conducted using MATLAB with the SPM12 toolbox and the FMRIB Software Library.
Data Preprocessing
To ensure data uniformity and analytical accuracy, preprocessing was conducted in sequential steps for both neuroimaging and cognitive datasets.
fMRI Preprocessing
The functional connectivity fMRI data underwent preprocessing using MATLAB's Statistical Parametric Mapping (SPM12) toolbox. This included spatial realignment and normalization to the Montreal Neurological Institute (MNI) space to standardize spatial orientation across participants.
Gaussian kernel smoothing was then applied with a full width at half maximum (FWHM) of 8 mm to improve signal-to-noise ratio and highlight regional activity patterns. Eliminating this obscurity in the scan made the statistical analysis more accurate and informative. Outlier scans exceeding the predefined motion thresholds were excluded to preserve data quality.
Figure 2 illustrates a detailed fMRI preprocessing workflow designed to standardize the data and minimize artifacts for accurate neuroimaging analysis. The process began with data stored in NIfTI format, with a repetition time (TR) of 0.75 seconds, ensuring compatibility with analysis tools and capturing high temporal resolution for precise neural dynamics. Motion correction was performed to realign fMRI volumes to the mean image, with a strict tolerance of ±2 mm for translational movements and ±2° for rotational deviations to exclude scans with excessive motion and preserve voxellevel alignment; this restriction was more strict than the dataset’s to ensure quality scans and reduce overfitting. Slice timing correction was applied to account for interleaved slice acquisition, using the middle slice as a reference point to synchronize signal timing across the brain. Co-registration aligned structural T1-weighted images with functional data, enabling precise anatomical localization of neural activity and setting the stage for accurate spatial normalization. Functional images were then normalized to the MNI152 template with a voxel size of 2 mm isotropic and a bounding box of [-90, -126, -72; 90, 90, 108] to ensure uniform alignment with a standard brain space. Denoising was performed by regressing out motion parameters and physiological confounds, with global intensity scaled to a mean of 100 for consistency across scans. Temporal filtering using a bandpass range of 0.01–0.1 Hz was applied to retain relevant neural signals while removing low-frequency drifts and noise. Finally, smoothing was conducted using a Gaussian kernel with an 8 mm full-width at half maximum (FWHM) to enhance the signal-to-noise ratio and improve the detection of regionally significant activation patterns. This preprocessing pipeline ensured high-quality, artifact-free data suitable for downstream statistical and machine-learning analyses.
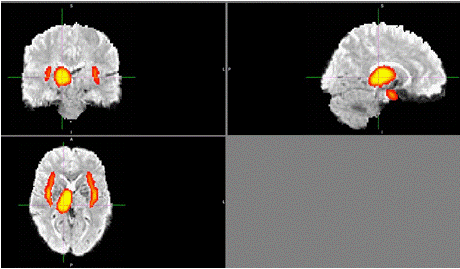
    Figure 1: Regional similarities in brain metabolism and amyloid
deposition. Graphic by student researcher.
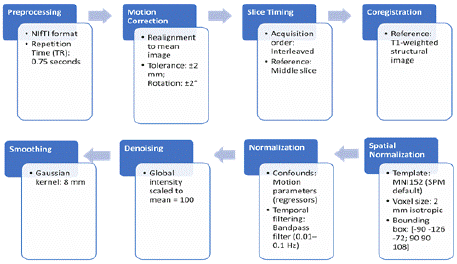
    Figure 2: Preprocessing pipeline. The preprocessing pipeline
depicted above follows standard conventions to ensure data is fitted and
interpretable by the ML algorithm. Graphic by student researcher.
Neuroimaging
fMRI Analysis: Neuroimaging analyses were performed to determine and characterize the functional connectivity of patients in the datasets, i.e., identify the performance of brain regions associated with cognitive performance (Figure 3).
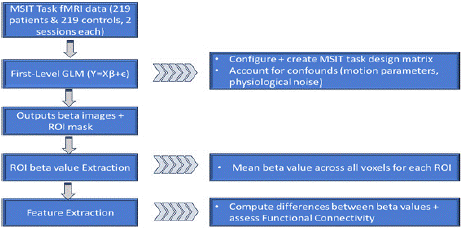
    Figure 3: Workflow diagram for analyzing MSIT task fMRI data,
encompassing 219 patients and 219 controls across two sessions.
The process includes creating an MSIT task design matrix, accounting for
confounds, generating beta images and ROI masks, extracting ROI beta
values, and performing feature extraction to compute functional connectivity
metrics. Graphic by student researcher.
For the MSIT task database, a General Linear Model (GLM) correlated each patient's 12-week treatment and functional connectivity. The contrast matrix [1 -1] was used in the GLM for congruent (assigned a value of 1) and incongruent (assigned a value of -1) MSIT task responses, respectively, to account for task-specific design matrices. Activation maps were generated to visualize regions showing significant activity changes. Additionally, a paired t-test correlated the General Linear Models' parameters collectively to generate an overall trend between treatment and change in functional connectivity, identifying voxels relevant to the patient's cognitive state and the extent and quality of responses thereof to treatment. This was done in order to later identify relevant ROIs accordingly. Beta images were generated to represent neural activation patterns, and these outputs were combined with ROI masks to extract mean beta values across all voxels for each ROI. Functional connectivity was then assessed by computing the differences between beta values and generating correlation metrics (Figure 4).
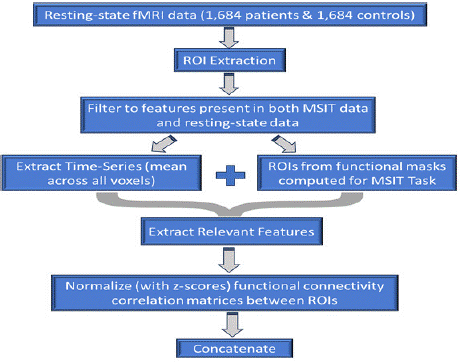
    Figure 4: Workflow for resting-state fMRI data analysis involving
1,684 patients and 1,684 controls. The process includes ROI extraction,
filtering features common to MSIT and resting-state data, extracting timeseries
data, generating ROIs from functional masks, extracting relevant
features, normalizing functional connectivity matrices using z-scores, and
concatenating the results for further analysis. Graphic by student researcher.
The resting-state fMRI analysis pipeline began with the extraction of regions of interest (ROIs) from functional masks generated during MSIT task-based fMRI analyses. That is, the relevant features mapped onto masks were super positioned onto the resting state scans. These ROIs represented key brain regions implicated in cognitive processes in SCZ. Within each ROI, voxel-level signals were averaged to compute mean time-series data, capturing the overall neural activity within each region.
The extracted features were filtered to retain only those present in both MSIT task-based and resting-state datasets, ensuring a consistent basis for functional connectivity comparisons. Pairwise Pearson correlation coefficients were calculated between ROI time series, generating correlation matrices that quantified the strength of connectivity between regions. These matrices were standardized using z-scores to normalize connectivity measures and account for inter-subject variability. Dimensionality reduction was performed using principal component analysis (PCA), retaining over 95% of the variance while optimizing computational efficiency. The resulting features were concatenated to form a robust dataset for downstream ML applications, ensuring that all functional connectivity measures were consistently integrated for predictive modeling (Figure 5).
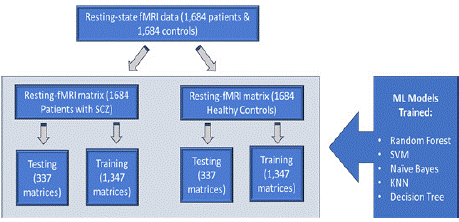
    Figure 5: Machine learning workflow using resting-state fMRI data from
1,684 patients with schizophrenia (SCZ) and 1,684 healthy controls.
Data is split into training (1,347 matrices) and testing (337 matrices) sets
for both groups. Multiple ML models, including Random Forest, SVM, Naive
Bayes, KNN, and Decision Tree, are trained for classification and analysis.
Graphic by student researcher.
The resting-state fMRI matrix for 1,684 patients diagnosed with SCZ and 1,684 healthy controls was divided into training and testing datasets. For both groups, 1,347 matrices (80%) were designated for training, while 337 matrices (20%) were set aside for testing. This split ensured that the models were trained on a substantial portion of the data while being evaluated on an independent and unseen dataset to prevent overfitting and assess generalizability. The training dataset was used to develop five ML models: Random Forest, Support Vector Machines (SVM), Naïve Bayes, k-Nearest Neighbors (kNN), and Decision Tree. These models were chosen for their varying strengths to provide the highest chance of a successful model. Each model was fine-tuned using hyperparameter optimization on the training data to maximize predictive accuracy. The testing dataset was used exclusively for the final model evaluation.
Performance metrics, including accuracy, precision, recall, F1- score, and ROC-AUC, were computed to compare model efficacy. Further, all models underwent 5-fold cross-validation to tune hyperparameters and ensure overfitting was not inflating accuracy.
Results
Preprocessing Validation
Preprocessing steps were validated through quality control analyses, including intensity histograms (Figure 6) and time-series visualizations (Figure 7). These checks confirmed the removal of noise artifacts and the preservation of signal integrity, providing reliable inputs for downstream analysis. The time-series plots demonstrated stable signals across the ROIs, with minimal motion artifacts, ensuring high-quality data for functional connectivity calculations.
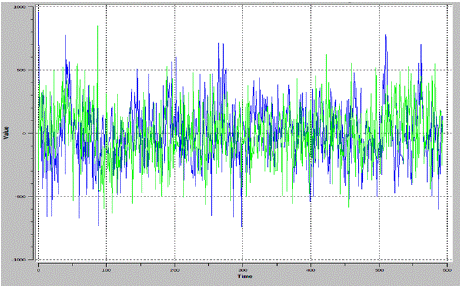
    Figure 6: Time-series visualization of neural activity extracted from
resting-state fMRI data. The plot overlays signal intensity fluctuations over
time for two distinct regions of interest (ROIs). Temporal patterns reflect
regional activation dynamics and are integral to functional connectivity
computations.
Stable oscillatory patterns within the plot demonstrate the preprocessing
efficacy, ensuring the integrity of the extracted signals. Graphic by student
researcher.
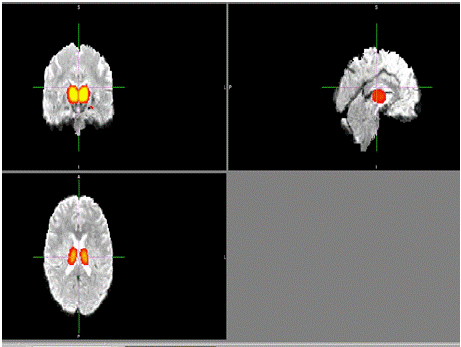
    Figure 7: Composite brain images displaying significant regions of
interest (ROIs) are identified as critical for cognitive impairment in
schizophrenia. Regions such as the anterior cingulate cortex and dorsolateral
prefrontal cortex exhibit notable disruptions in functional connectivity. These
ROIs were derived from task-based and resting-state fMRI analyses and are
implicated in executive function and symptom severity. Graphic by student
researcher.
ROI Correlation and Dimensionality Reduction
Figure 8 represents the significant regions of interest (ROIs) derived from the MSIT task-based fMRI data, explicitly identifying key brain areas, such as the anterior cingulate cortex and the dorsolateral prefrontal cortex, associated with cognitive processing in SCZ. These ROIs were mapped onto the resting-state fMRI data to investigate functional connectivity patterns (Figure 8). The coordinates shown were obtained through statistical parametric mapping, with thresholding applied at p<0.001 (FWE-corrected). These clusters overlapped substantially with the connectivity findings from resting-state analyses.
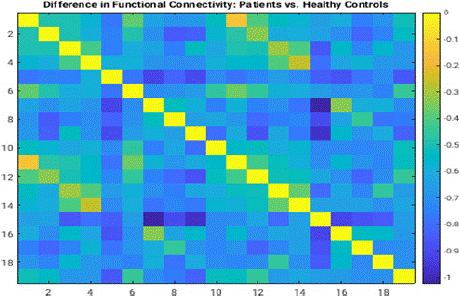
    Figure 8: Functional connectivity matrix for schizophrenia patients
during resting-state fMRI. The x- and y-axes correspond to the same ROIs
analyzed in healthy controls. Lower correlation values (depicted in bluegreen)
reflect reduced connectivity and impaired neural communication. This
disruption is characteristic of schizophrenia
and underpins deficits in cognitive and executive functions. Graphic by
student researcher.
Table 1 highlights the top five most significant regions of interest (ROIs) identified through functional connectivity analyses in schizophrenia patients. Each set of X-, Y-, and Z-coordinates represents a specific spatial location within the Montreal Neurological Institute (MNI) standard brain space. These regions correspond to areas such as the anterior cingulate cortex and dorsolateral prefrontal cortex, which are critical for cognitive and executive functions. The ROIs were derived from both task-based and resting-state fMRI datasets, ensuring consistency and capturing functional disruptions associated with schizophrenia's prodromal and psychotic stages.
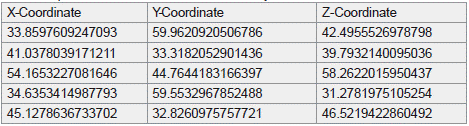
    Table 1: Significant regions of interest (ROIs) identified from functional
connectivity analyses in schizophrenia patients. The X-, Y-, and Z-coordinates
represent spatial locations in the Montreal Neurological Institute (MNI) standard
brain space. These coordinates correspond to brain regions implicated in
cognitive and executive function disruptions, including the anterior cingulate
cortex and dorsolateral prefrontal cortex. The listed ROIs were derived from both
task-based and resting-state fMRI datasets to ensure consistency and relevance
for schizophrenia-related biomarkers. Table by student researcher.
Functional Connectivity Analysis
The resting-state functional connectivity analysis demonstrated notable differences between patients with SCZ (SCZ) and healthy controls.
The difference matrix (Figure 1) highlighted regions of disrupted connectivity in SCZ patients, particularly in networks associated with cognitive control and executive functioning. These disruptions were evident in the comparison of connectivity patterns for healthy controls (Figure 2), which exhibited higher integration and consistent inter-network correlations (Figure 9).
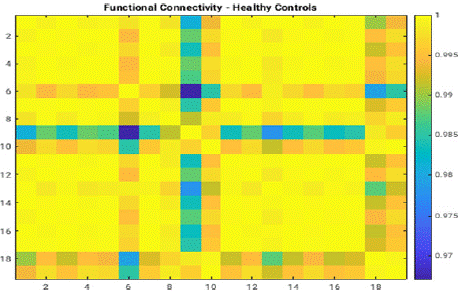
    Figure 9: Functional connectivity matrix illustrating inter-regional
correlations for healthy control subjects. The x- and y-axes represent
distinct regions of interest (ROIs) in the brain. High correlation coefficients,
denoted by yellow, signify robust connectivity, indicating normal neural
integration across functional networks. This matrix serves as a baseline for
comparison with disrupted connectivity observed in schizophrenia patients.
Graphic by student researcher.
Open Sourcing Library
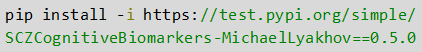
A Python-based library was developed to support the preprocessing, feature engineering, and ML workflows required for this study. The library was designed to integrate with SPM outputs, enabling the efficient import and processing of task-based and resting-state fMRI data. It includes modules for region of interest (ROI) extraction, functional connectivity matrix computation, and dimensionality reduction using principal component analysis (PCA). The library automates the calculation of pairwise Pearson correlation coefficients between ROIs, z-score normalization, and PCA to ensure standardized and computationally efficient processing of high-dimensional data. The ML module within the library includes implementations for multiple classifiers, such as Random Forest, Support Vector Machines (SVM), Naïve Bayes, k-Nearest Neighbors (kNN), and Decision Tree. It supports hyperparameter optimization through grid search and cross-validation. Intermediate outputs, including connectivity matrices and feature selection logs, are saved for transparency and reproducibility. The modular design of the library allows it to be applied to various datasets, enabling flexible adaptation for future neuroimaging studies while maintaining methodological rigor. Further, the library was published as an open-source Python package to ensure accessibility and reproducibility, with detailed documentation and example workflows provided (Appendix C). To install the library in Windows command prompt:
Discussion
Functional Connectivity Analysis
Resting-state functional connectivity analysis revealed distinct disruptions in brain networks critical for cognitive control and executive functioning in individuals with SCZ (SCZ). These disruptions were characterized by lower inter-network correlations compared to healthy controls, as illustrated by the difference matrix (Figure 1). Task-based analyses further identified significant regions of interest (ROIs), such as the anterior cingulate cortex and dorsolateral prefrontal cortex, which play essential roles in cognitive processes. These findings align with previous literature on cognitive impairments in SCZ and underscore the pervasive impact of the disorder on functional brain organization.
The regions identified provide a clear framework for understanding how SCZ alters neural communication pathways. By combining insights from task-based and resting-state connectivity patterns, the analysis highlights both localized and network-wide deficits, offering a nuanced perspective on cognitive biomarkers. The overlaps between regions implicated in executive function and those linked to symptom severity further validate the clinical relevance of the findings. These results suggest that cognitive decline in SCZ is not isolated to specific tasks but reflects broader disruptions in neural integration and coordination and that focusing on functional networks rather than isolated regions could yield more comprehensive diagnostic tools and therapeutic strategies. This pattern recognition requires ML, which validates the results from the six models built. Most importantly, the mean significant coordinates, although these will vary per dataset, atlas, and participant, corroborated with past literature.
Limitations
The study's limitations primarily stem from the data utilized and its potential generalizability.
Using cognitive impairment data from the MSIT task in psychotic patients presents a challenge, as these findings may not directly translate to individuals in the prodromal stages of SCZ. This discrepancy arises because cognitive changes in the prodromal phase are often subtler and less pronounced than those observed during psychosis, potentially making the model less sensitive to early-stage indicators. This limits the algorithm's ability to reliably detect early-stage cognitive biomarkers in a broader population. Additionally, potential biases in data collection, such as variability in imaging protocols, scanner types, or participant demographics, may affect the generalizability and accuracy of the findings. For instance, differences in the resolution or signal-to-noise ratio of imaging data across scanners could lead to inconsistencies in the identification of functional connectivity patterns [18]. Furthermore, the datasets used in this study may not adequately capture the full diversity of clinical presentations, which could constrain the algorithm's performance when applied to heterogeneous populations
Future Research
Building upon the successes of this study, future research should aim to expand the current ML algorithm to identify biomarkers for a broader range of psychiatric disorders. Many psychiatric conditions, such as major depressive disorder (MDD), bipolar disorder, and anxiety disorders, often co-occur with SCZ (SCZ), and their overlapping symptoms may result from disruptions in similar brain regions and networks. By integrating multi-modal datasets that include functional connectivity, task-based neural activity, and cognitive assessments across different disorders, a new ML algorithm could be developed to differentiate and predict multiple psychiatric conditions simultaneously. This expansion would enhance the clinical applicability of the algorithm, providing a comprehensive diagnostic framework to account for the complexities of comorbid conditions. Additionally, to ensure accessibility and usability, an interactive cognitive training application is under development to house the algorithm.
This application employs a Model-View-Controller (MVC) architecture to ensure modularity, scalability, and patient confidentiality. Using Amazon Web Services (AWS) for secure data management and a user-friendly interface (e.g., Wix or a comparable platform), the application could integrate the algorithm into a functional tool for clinicians and researchers. The interactive tasks, including the Multi-Source Interference Task (MSIT) and the MATRICS Consensus Cognitive Battery (MCCB), would dynamically adapt difficulty based on user performance to provide a detailed cognitive profile. Future iterations of the application will expand task sets to include assessments targeting emotional regulation and memory, which are relevant for disorders beyond SCZ.
Relation to Prior Literature
This study aligns with and expands upon prior literature examining the neural and cognitive biomarkers of SCZ. Consistent with previous research (e.g., Goldsmith et al.; Correll & Schooler [2,14]), the findings highlight significant disruptions in functional connectivity in brain regions critical for executive function, such as the anterior cingulate cortex (ACC) and dorsolateral prefrontal cortex (DLPFC). These results support established models that link SCZ to widespread network dysfunction rather than isolated regional abnormalities. This paper expands on traditional approaches by integrating task-based and resting-state fMRI with ML models. Most studies focus on either task-based or resting-state data, so this research bridges both domains to identify biomarkers for early SCZ diagnosis. Lastly, the study’s open-source Python library provides a novel, scalable framework for reproducible neuroimaging analyses, addressing a common limitation in prior research.
References
- Jaeschke K, et al. Global estimates of service coverage for severe mental disorders: findings from the WHO Mental Health Atlas 2017 Glob Ment Health. 2021; 8: e27.
- Correll CU & Schooler NR. Negative Symptoms in Schizophrenia: A Review and Clinical Guide for Recognition, Assessment, and Treatment. Neuropsychiatric disease and treatment. 2020; 16: 519–534.
- Lehrer DS & Lorenz J. Anosognosia in schizophrenia: hidden in plain sight. Innovations in clinical neuroscience. 2014; 11: 10–17.
- Samara MT, Nikolakopoulou A, Salanti G & Leucht S. How Many Patients With Schizophrenia Do Not Respond to Antipsychotic Drugs in the Short Term? An Analysis Based on Individual Patient Data From Randomized Controlled Trials. Schizophrenia Bulletin. 2019; 45: 639–646.
- Stroup TS & Gray N. Management of common adverse effects of antipsychotic medications. World psychiatry: official journal of the World Psychiatric Association (WPA). 2018; 17: 341–356.
- Shi C, Kang L, Yao S, Ma Y, Li T, Liang Y, et al. The MATRICS Consensus Cognitive Battery (MCCB): Co-norming and standardization in China. Schizophrenia Research. 2015; 169: 109–115.
- Morrison AK. Cognitive behavior therapy for people with schizophrenia. Psychiatry (Edgmont (Pa.: Township)). 2009; 6: 32–39.
- Uzman Özbek S & Alptekin K. Thought Disorder as a Neglected Dimension in Schizophrenia. Alpha psychiatry. 2021; 23: 5–11.
- Sass L & Parnas J. Thought Disorder, Subjectivity, and the Self. Schizophrenia Bulletin. 2017; 43: 497–502.
- Ori Elis, Janelle M Caponigro, Ann M Kring. Psychosocial treatments for negative symptoms in schizophrenia: current practices and future directions. Clin Psychol Rev. 2013; 33: 914-928.
- Robert W Buchanan, Julie Kreyenbuhl, Deanna L Kelly, Jason M Noel, Douglas L Boggs, Bernard A Fischer, et al. The 2009 schizophrenia PORT psychopharmacological treatment recommendations and summary statements. Schizophr Bull. 2010; 36: 71-93.
- Farina EA, Assaf M, Corbera S & Chen CM. Factors Related to Passive Social Withdrawal and Active Social Avoidance in Schizophrenia. The Journal of nervous and mental disease. 2022; 210: 490–496.
- Häfner H & Maurer K. Early detection of schizophrenia: current evidence and future perspectives. World psychiatry: official journal of the World Psychiatric Association (WPA). 2006; 5: 130–138.
- Goldsmith DR, Crooks CL, Walker EF & Cotes RO. An Update on Promising Biomarkers in Schizophrenia. Focus (American et al.). 2018; 16: 153–163.
- Galinska-Skok B & Waszkiewicz N. Markers of Schizophrenia Critical Narrative Update. Journal of Clinical Medicine. 2022; 11: 3964.
- Brown AS. The environment and susceptibility to schizophrenia. Progress in neurobiology. 2011; 93: 23–58.
- Saha S, Barnett AG, Foldi C, Burne TH, Eyles DW, Buka SL, et al. Advanced paternal age is associated with impaired neurocognitive outcomes during infancy and childhood. PLoS medicine. 2009; 6: e40.
- Alberto Parola, Arndis Simonsen, Jessica Mary Lin, Yuan Zhou, Huiling Wang, Shiho Ubukata, et al. Voice Patterns as Markers of Schizophrenia: Building a Cumulative Generalizable Approach Via a Cross-Linguistic and Meta-analysis Based Investigation, Schizophrenia Bulletin. 2023; 49: S125– S141.