Abstract
Objective: Genuvarum deformity experience knee instability. This deformity can lead the patient to sever osteoarthritis. The recovery of postural stability is very important to prevention of these patients. Strategies aimed at stabilizing the muscle can have a long-term effect on the joint. This study was performed to determine the relationship between muscle stabilization strategies and knee instability, in order to determine how people with knee Genuvarum, respond to rapid absorption and muscle co- contraction during landing task.
Methods: Twenty female participants, (10 normal and 10 Genuvarum) in the present study. The subjects were land by preferred lower limb from a table (30 cm high) on a force plate. Vertical ground reaction force, time to peak of vertical reaction force, velocity of vertical ground reaction force to reach the maximum, time to stability in X and Y directions and resultant vector were calculated as postural control parameters. Also surface electromyography of transverse abdominal/int. oblique, vastus medialis, vastus lateralis, lateral gastrocnemius, and medial gastrocnemius muscles were recorded during landing. Motor control strategy were measured by similarity index and voluntary response index.
Results: There are significant difference between Genuvarum and Healthy subjects in motor control strategy (P<0.05).A significant difference are detected in postural control parameters between two groups (P<0.05).
Conclusion: Genuvarum deformity may be linked to altered quadriceps, abdominal and gastrocnemius muscles reciprocal co-activation patterns during landing task. In addition, may be affected voluntary motor control strategy in synergy concepts. Postural control is affected in these deformity and shock absorption may be reduced in parallel to increase of response vector and reduce of instability in landing task.
Keywords: Genuvarum; Postural Stability; Similarity index; Voluntary response index
Abbreviations
sEMG: Surface Electromyography; SENIAM: Surface Electromyography for the Non-Invasive Assessment of Muscles; TA/IO: Transverse Abdominal/Int. Oblique; VM: Vastus Medialis; VL: Vastus Lateralis; MG: Medial Gastrocnemius; LG: Lateral Gastrocnemius; GRF: Ground Reaction Force; VGRF: Vertical GRF; TTP: Time to peak of VGRF; VGRFvel: Velocity of VGRF; TTS: Time to Stability; RV: Resultant Vector; SI: Similarity Index; VRI: Voluntary Response Index; RVi: Response Vector; PRVi: Prototype Response Vector.
Introduction
Biological and mechanical approach for detection of impairments and treatments of knee lesions was reported previously [1-3]. Valgus deformity is very common in younger subjects and may to lead knee joint to osteoarthritis in elder ages.
The improvement of postural control can prevent the knee osteoarthritis and keen joint arthroplasty and side effect of infections.
There are multiple modalities that coordinate a complex activity, such as exteroceptive and proprioceptive sensations, motor control planning, muscle activities, joint biomechanics, postural stability. These coordination and redundancy are a complex process that are related to all of the degree of freedom of the above variable elements [4]. The effects of muscles on postural stability are very important and altered by motor control strategies and afferent pathway. Malalignment of biomechanic properties of joints, especially lower limbs can change, and variate afferents input to upper motor neuron [5].
Variation in motor control strategy in postural control may be increased by deformity in the knee joint such as knee genuvarum deformity by changes in muscles activities and motor control timings [6,7]. Normal postural stability is important aspect for maintaining quality of life in patients with knee genuvarum. When abnormalities occur in the joint, the visual or vestibular and other joints somatosensory systems, must control postural stability and therefore degree of freedom may increase. At these situations different muscle contractions work together and produce co-contraction instead of co-activation. Motor timings and muscles activity durations may increase, and postural stability may reduce [5,6].
A motor control deficit is a key factor for inducing patients with Genuvarum and a relationship may exist between changes in the normal timing of muscle activities (abdominal, quadriceps and gastrocnemius) of subjects with genuvarum [6,10,11].
It is clear that the patients’ motor control strategies and induces of synergy changed and analyses of above conditions are the focus of this paper.
The use of motor control parameters in assessment of postural stability in genuvarum is new approach and this study can be used for next researches and improve rehabilitation aims for patients with genuvarum.
Voluntary Response Index (VRI) has been used as measure of motor control to determine abnormal voluntary movements [12-18]. The VRI consists of two numeric values, one obtained from the total electrical activity of all muscles during a task (magnitude; Mag), and the other calculated from the Electromyography (EMG) distribution across the recorded muscles in comparison to specific prototype (Similarity Index; SI). This method analyses, quantitatively, the surface EMG activity of the related muscles during a given voluntary movement for assessment of voluntary motor control. In assessing.
Voluntary motor control assessment, the surface EMG activities of related muscles are analyzed during a given voluntary movement.
The aim of the present study is to evaluate postural stability and motor control variations in patients with genuvarum.
Method
Twenty females with the age range of 20 to 30 years old participated in this study in two groups, 10 with healthy knee and 10 with Genuvarum deformity. Subjects would be excluded from the study if they had a history of neuromuscular and musculoskeletal disorders, surgery or fracture in the lower extremity over the past six months, and other lower limb abnormalities. The study was accomplished in the Biomechanics Laboratory at Rehabilitation Faculty of Shahid Beheshti University of Medical Sciences. Genuvarum deformity was measured by a camera capturing goniometer and MicroDicom viewer software (Figure 1) [6]. Different more than 11o between thigh and leg angle detected as Genuvarum [6,8-18].
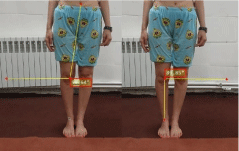
Figure 1: Measuring the varus angle by the difference between thigh angle and leg angle as Azizi and et al, technique.
All subjects were informed about the experimental procedure and they signed a consent form. A triaxial force plate (MIE model, Bertec Corp, UK) was used for recording and measuring vertical Ground Reaction Force (GRF). The Vertical GRF (VGRF) was used to detect the very first contact during landing. The time when the vertical force was reached to 10% of body weight was marked as the reference point for calculating the EMG onset time.
The force plate was recorded at a sampling rate of 1000 Hz. The subjects were trained to hang their dominant leg from a table with 30 cm height and land on the center of the force plate with the same leg after the command of the examiner. The force plate was synchronized with the electromyography device. Surface Electromyography (sEMG) of Transverse Abdominal/Int. Oblique (TA/IO), Vastus Medialis (VM), Vastus Lateralis (VL), Medial Gastrocnemius (MG) and lateral gastrocnemius (LG) were recorded during landing.
The skin’s surface of the muscles was shaved and cleaned by alcohol wipes before attaching the electrodes. All sEMG signal recordings were made using the DataLOG, Biometrics Ltd England. Preamplifier bipolar active electrodes (Type NOS.SX230, Biometrics Ltd) with a fixed center-to-center interelectrode distance of 20 mm, recording diameter of 10 mm, with a gain of 1000, the input impedance of 1015 O, common-mode rejection ratio of 110 dB at 60 Hz, and bandwidth of 20–450 Hz and ground electrodes were located on the preferred wrist. The electrode positions and orientations were located according to EMG sensor locations described in SENIAM guidelines [19].
Data Analysis
Postural control
The motor control strategies for postural control were measured by:
• Time to peak of VGRF (TTP); when VGRF increases from 10% of body weight to peak of vertical reaction force (Figure 2).
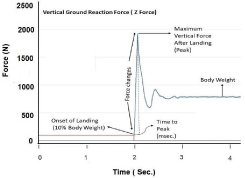
    Figure 2: Postural control parameter where detected by VGRF changes for
Time to Peak (TTP) and Velocity of VGRF changes (VGRFvel).
• Velocity of VGRF changes (VGRFvel); the ratio between VGRF changes from 10% of body weight to peak of vertical reaction force to TTP.
• Time to Stability (TTS); the shearing forces in two directions (mediolateral X and anteroposterior Y) will reach the stability for several second after landing. TTSx and TTSy were calculated by the Ross SE technique [20,21].
• Vector of time to stability in two directions (TTS x and TTS y) which were named as Resultant Vector (RV) equation 1 [19,20] (Figure 3).
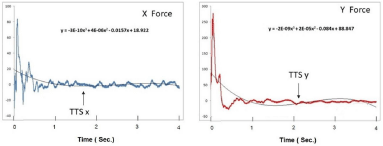
    Figure 3: Sway of shearing forces (N) in mediolateral (X Force) and anteroposterior (Y Force) will reach to steady (stability). The time of this stability is estimated
by Ross technique. The vector of time to stability (TTS x and TTS y) named as Resultant Vector (RV).
Equation 1:
Co-contraction and motor control
After preparing the participants, they were asked to land with the dominant leg from a table (30 cm high) on a force plate. The onset and offset times of muscle activity for each muscle were detected as the point where the rectified signal was passed above or below a threshold, respectively, and remained for at least 250 ms. The threshold was calculated by adding the average EMG signal during 500 ms. before the landing command to two times of standard deviation of the EMG signal during the same period (Figure 4).
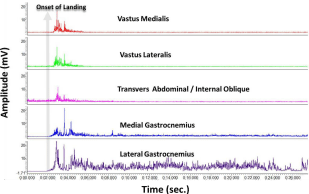
Figure 4: Muscles activity during landing task, onset and offset of these activities were measured after onset of landing by threshold detection.
Muscles activity (RMS) were measured between onset and offset time for each muscles as power of muscles or response for each muscles (R1, R2, R3,…,Rn). Also, RMS of muscles activity during 500 ms measured as rest power of muscle for base line correction (Ri) in Similarity Index (SI) and Voluntary Response Index (VRI) equations (co-contraction and motor control respectively).
SI and VRI equations
To implement that, first, the Root Mean Square (RMS) of five muscles (VM, VL, TA/Int. Obl. MG and LG) were calculated for each muscle (R1, R2, R3, R4, R5), then base line correction by RMS of rest activity (500 ms) of each muscles were measured (Ri 1, Ri 2, Ri 3, Ri 4, Ri 5). The vector of these base line correction selected (vRi12+ Ri22+ Ri32+ Ri42+ Ri52) for normalization of each muscle activities (R norm) as equation 2.
The summation of these five R norm were considered as Response Vector (RVi) and average of five R norm were defined as Prototype Response Vector (PRVi), for Genuvarum group. The RVi multiplied by PRVi are defined as magnitude [10].
Also, above sequences were measured for Healthy group (|RV|) (|PRV|) and ratio between two magnitudes (Genu varum/Healthy) indicated Similarity Index (SI) as equation 3.
The SI multiplied by magnitude is named as Voluntary Response Index (VRI), which is shewed as equation 4.
Equation 2:
Equation 3: SI= (Si (RViPRVi))/(|RV| |PRV|)
Equation 4: VRI = SI* Magnitude
Statistical analysis
The number of participant accommodated by G-Power software until it reach to Beta =0.2 and Effect size= 0.8. Statistical analyses were performed using the SPSS (v. 17, SPSS Inc., Chicago, IL, USA). Since data was normally distributed, as determined by Kolmogorov- Smirnov tests, an independent T-test was run to assess the effect of group (participants with VAR vs. participants without VAR or healthy group) on the TTP, VGRFvel, TTS x, TTS y, SI and VRI values. This statistical procedure allowed the testing of the difference between two groups. A significant level of 0.05 was set for all analyses. The Smallest Detectable Change (SDC) was estimated for compare of two group variable effect.
Results
Two groups were matched in anthropometric values (Table 1) and just varus angle in genuvarum group was more in healthy group significantly. The results of T-test analysis of depended variables revealed significant different for all of them for each test (P<0.05) (Table 2).
Variables
Age (y)
Weight (kg)
Height (m)
Body mass
index (kg/m2)Varus angle
(deg.)Mean
SD
Mean
SD
Mean
SD
Mean
SD
Mean
SD
Genuvarum
25.1
5.97
61.4
11.23
1.64
0.08
22.69
2.76
14.134
2.52
Normal
21.5
4.84
57.4
6.96
1.65
0.06
21.13
1.9
6.499
1.88
P value
0.08
0.18
0.41
0.08
0.000
Table 1: Demographic information (Mean and SD) of the two groups.
Postural control results
Comparison of postural control variables between two groups indicated significant reduction of TTP and increase of VGRFvel, TTS x, TTS y, and RV in genuvarum group (Table 2).
    TTP (ms)
    VGRFvel (N/ms)
    TTS x (sec.)
    TTS y (sec.)
    RV (sec)


    Mean
    SD
    Mean
    SD
    Mean
    SD
    Mean
    SD
    Mean
    SD


    Genuvarum
    81.03
    18.15
    21.28
    8.05
    1.37
    0.83
    1.02
    0.14
    2.19
    1.64


    Healthy
    110.66
    21.5
    12.27
    4.27
    0.51
    0.2
    0.98
    0.04
    1.12
    1.09


    P Value
    0.004
    0.006
    0.005
    0.423
    0.013


    Mean Diff.
    -29.63
    9.01
    0.86
    0.04
    1.07


    SDC
    5.5
    1.71
    0.14
    0.03
    0.24


    There are significant difference between    in TTP, VGRFVEL, TTSx and RV between two groups and    lower SDC in comparison to mean differences.
Table 2: Mean and SD of postural control elements variable in genuvarum and healthy groups.
Co-contraction and motor control result
Base line correction (normalize EMG) of muscle activity is named as Response Vector (RVi) of each muscle, which are measured by equation 2. These variables indicated significant difference in RV2 and RV4, (Table 3). There is significant difference in co-contraction and motor control parameters between two groups (Table 4), (Figure 5).
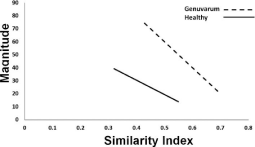
    Figure 5: The relation between Magnitude and total SI in two groups are
different (Genuvarum, R² = 0.63, P=0.014 and Healthy, R²= 0.55, P=0.006).
RV1(VM)
RV2(VL)
RV3
(TA/Int.obl)RV4(MG)
RV5(LG)
Mean
SD
Mean
SD
Mean
SD
Mean
SD
Mean
SD
Genuvarum
12.71
6.92
6.35
2.91
12.8
7.01
10.42
5.15
5.08
1.93
Healthy
10.41
4.76
3.47
1.29
10.6
4.48
3.91
0.85
1.31
0.28
P Value
0.19
0.005
0.21
0
0
Mean Diff.
2.3
2.88
2.19
6.51
3.77
SDC
13.21
3.59
12.42
0.78
2.35
There is significant difference between two groups in RV2, RV4 and RV5, whereas there are lower SDC in comparison to mean differences of RV4 and RV5.
Table 3: Mean and SD of Response Vector of muscles genuvarum and healthy groups.
The total similarity index analysis between Genuvarum and Health groups (equation 3, SI= (Si (RViPRVi))/(|RV| |PRV|)) by ratio between healthy response vector (197.15 mV) to varus response vector (519.44 mV) indicates SI=0.38 and degree between them is 67.69o (Cosine of SI). It means that there is different co-contraction in genuvarum in compared to healthy subjects.
Discussion
Decrease of postural stability in genuvarum subjects, where defined by several researchers as Azizi et al. The result shows that more of postural control parameters in genuvarum subjects are reduced in landing task similar to previous researches, especially in time base variables, such as TTP, VGRFvel , TTSx and RV which are induce of motor control programing. Increase of muscles magnitude (voluntary response and prototype response vector) in genuvarum is an important variable element which is described by previous studies. Increase of muscle activities were explained at this subjects [6,7].
Increase of magnitude of genuvarum in comparison to healthy subject indicated more muscle contraction in genuvarum group. The ratio of magnitude between these two groups indicate a great angle about 67.69o. This finding trend to increase of total Similarity Index and it main that there is a high difference between two groups. Also, there are increase of SI and VRI by each cases of genuvarum in comparison to healthy subjects (Table 4).
    SI
    Magnitude
    VRI


    Mean
    SD
    Mean
    SD
    Mean
    SD


    Genuvarum
    0.56
    0.08
    47.35
    19.86
    25.54
    8.41


    Healthy
    0.41
    0.07
    29.7
    10,73
    11.59
    2.92


    P Value
    0.0001
    0.0118
    0.0001


    Mean Diff.
    0.16
    17.65
    13.95


    SDC
    0.2
    29.75
    8.1


    There is significant difference between    two groups in c-contraction and motor control variables; just there is lower    SDC in comparison to mean difference of VRI between two groups.
Table 4: Mean and SD of SI, Magnitude and VRI in Genuvarum and healthy
groups.
Conclusion
Genuvarum deformity increases lower trunk and lower limb muscle contraction in one leg landing task. The increase of muscle contraction produces co-contraction instead of the co-activation (Healthy muscle contraction). The pattern of muscle activity in genuvarum deformity, needs more motor control programing, planning and strategy and consequently increase of degree of freedom and internal noise of CNS.
The reduction of postural control in landing task is related to motor control deficiency, and changes of motor control strategies is more dependent on environment, proprioceptive afferent and re-afferent (joint, muscle, etc.) inputs. This circular causal effect must treat by motor control task orientation techniques parallel to deformity correction.
Ethical Considerations
Each participant signed an informed consent form approved by the Institutional Review Board of the Shahid Beheshti University of Medical Sciences.
Acknowledgment
The authors are thankful to all patients who participated in this research. We are also thankful to all personnel of the laboratory for their kind cooperation.
References
- Amoczky SP. Structure and Biology of the Knee Meniscus. Biomechanics of Diarthrodial Joints. 2002; 177-190.
- Ellenberger L, Oberle F, Lorenzetti S, Frey WO, Snedeker JG, Spörri J. Dynamic knee valgus in competitive alpine skiers: Observation from youth to elite and influence of biological maturation. Scandinavian Journal of medical & sciences in sport. 2020.
- Filardo G, Di Martino A, Kon E. Midterm Results of a Combined Biological and Mechanical Approach for the Treatment of a Complex Knee Lesion, Cartilage. 2012; 3: 288-292.
- Gopalakrishnan A, Modenese L, Phillips A. A novel computational framework for deducing muscle synergies from experimental joint moments, Frontiers in Computational Neuroscience. 2014; 8: 153.
- Wang CC, Jiang BC, Huang PM. The Relationship between Postural Stability and Lower-Limb Muscle Activity Using an Entropy-Based Similarity Index. Entropy. 2018; 20: 320.
- Azizi M, Khademi KH, Ghasemi M, Akbarzadegan A. Changes in muscle strategies during landing task in subjects with and without Knee genu varum. Journal of Modern Rehabilitation. 2020; 14: 105-112.
- Letafatka A, Mantashloo Z, Moradi M. Comparison the time to stabilization and activity of the lower extremity muscles during jump-landing in subjects with and without Genu Varum. Gait & Posture. 2018; 65: 256–261.
- Gibson K, Sayers SP, Minor MA. Measurement of varus/valgus alignment in obese individuals with knee osteoarthritis. Arthritis care & research. 2010; 62: 690-696.
- Kenneth A, Krackow. The measurement and analysis of axial deformity at knee. Homer Stryker Center. 2008; 37-39.
- Cowan SM, Bennell KL, Hodges PW, Crossley KM, McConnell J. Delayed onset of electromyographic activity of vastus medialis obliquus relative to vastus lateralis in subjects with patellofemoral pain syndrome. Archives of physical medicine and rehabilitation. 2001; 82: 183-189.
- Piva SR, Fitzgerald GK, Irrgang JJ, Fritz JM, Wisniewski S, McGinty GT, et al. Associates of physical function and pain in patients with patellofemoral pain syndrome. Archives of physical medicine and rehabilitation. 2009; 90: 285-295.
- Lim H, Lee D, McKay W, Priebe M, Holmes S, Sherwood A. Neurophysiological assessment of lower-limb voluntary control in incomplete spinal cord injury. Spinal Cord. 2005; 43: 283-290.
- Lee D, Lim H, McKay W, Priebe M, Holmes S, Sherwood A. Toward an objective interpretation of surface EMG patterns: a Voluntary Response Index (VRI). Journal of Electromyography and Kinesiology. 2004; 14: 379-388.
- Lin J-J, Lim HK, Soto-quijano DA, Hanten WP, Olson SL, Roddey TS, et al. Altered patterns of muscle activation during performance of four functional tasks in patients with shoulder disorders: interpretation from voluntary response index. Journal of Electromyography and Kinesiology. 2006; 16: 458-468.
- McKay W, Ovechkin A, Vitaz T, de Paleville DT, Harkema S. Neurophysiological characterization of motor recovery in acute spinal cord injury. Spinal Cord. 2011; 49: 421-429.
- Zoghi M, Galea M, Morgan D. A Brain Motor Control Assessment (BMCA) protocol for upper limb function. PloS one. 2013; 8: e79483.
- Cheng C-H, Wang J-L, Lin J-J, Wang S-F, Lin K-H. Position accuracy and electromyographic responses during head reposition in young adults with chronic neck pain. Journal of Electromyography and Kinesiology. 2010; 20: 1014-1020.
- Talebian S, Hosseini M, Bagheri H, Olyaei G, Reazasoltani A. Trunk muscle fatigue in subjects with a history of low back pain and a group of healthy controls measured by similarity index. Journal of Back and Musculoskeletal Rehabilitation. 2011; 24: 17–22.
- Stegeman D, Hermens H. Standards for surface electromyography: The European project Surface EMG for non-invasive assessment of muscles (SENIAM). 2007.
- Ross SE, Guskiewicz KM, Gross MT, Yu B. Assessment tools for identifying functional limitations associated with functional ankle instability. Journal of athletic training. 2008; 43: 44-50.
- Ross SE, Guskiewicz KM, Yu B. Single-leg jump-landing stabilization times in subjects with functionally unstable ankles. Athl Train. 2005; 40: 298–304.
