
Research Article
J Stem Cell Res Transplant. 2016; 3(1): 1022.
Characterization of Carbohydrate Surface Markers on Mouse Embryonic Stem Cells
Zhenwei He1,2, Yue An1,3, Gang Shi1,4, Yingwei Lin1,3, Jiliang Hu5* and Yali Li¹*
¹Department of Biochemistry and Molecular Biology, Dalian Medical University, China
¹Department of Neurology, Forth Affiliated Hospital of China Medical University, China
³Department of Clinical Laboratory, The Second Affiliated Hospital of Dalian Medical University, China
4Department of Colorectal Surgery, Liaoning Cancer Hospital and Institute, Cancer Hospital of China Medical University, China
5Department of Neurosurgery, The Shenzhen People’s Hospital, The Second Clinical Medical Collage of Jinan University, China
*Corresponding author: Yali Li, Department of Biochemistry and Molecular Biology, Dalian Medical University, China
Jiliang Hu, Department of Neurosurgery, The Shenzhen People’s Hospital, The Second Clinical Medical Collage of Jinan University, China
Received: April 19, 2016; Accepted: July 13, 2016; Published: July 15, 2016
Abstract
Glycosylation of proteins and lipids on cell surface have been shown to be important in maintaining pluripotency and stem cell fate in embryonic stem cells. Lectins have been widely used to characterize carbohydrate modifications on cell surface of embryonic stem cells to determine pluripotency and stem cell fate. In the present study, a panel of 14 lectins and carbohydrate antibodies was used to characterize the carbohydrate surface markers of mouse Embryonic Stem (ES) cells. SSEA-1-positive mouse ES cells were firstly enriched and the carbohydrate profile of the cells was determined by flow cytometry and immunocytochemistry. Enrichment of mouse ES cells yielded approximately 99.95 ± 0.87% of SSEA-1-positive mouse ES cells. A uniform and high percentage of binding was observed for PNA, DSL, JAC, GNL, PSA and LTL, with PNA, DSL, JAC and GNL having similar percentage of binding to SSEA- 1 (99.9%), while PSA and LTL binding were approximately 95%-99%. Partial binding of WFL, SNA and AAL were observed in mouse ES cells which was also reflected by the respective immunocytochemistry images. A very low percentage of binding was observed for MAA and UEAI. The data showed that high expression of mannose, N-acetyllactosamine and galactose are present on the cell surface of mouse ES cells. Some reliable surface markers that can be used to determine pluripotency are PNA, DSL, JAC and GNL, which showed similar binding to SSEA-1, a well-established pluripotent marker. Taken together, the data has provided information on the cell surface carbohydrate profile of mouse ES cells.
Keywords: Mouse embryonic stem cells; SSEA-1; Lectins
Abbreviations
mouse ESCs: mouse Embryonic Stem Cells; SSEA-1: Stage Specific Embryonic Antigen-1; GalNAc: N-acetylgalactosamine; LIF: Leukemia Inhibitory Factor; MEF: Mouse Embryonic Fibroblast; PBS: Phosphate Buffered Saline; BSA: Bovine Serum Albumin; UEAI: Ulex Europaeus Agglutinin I; LTL: Lotus Tetragonolobus Lectin; PSA: Pisum Sativum Agglutinin; GNL: Galanthus Nivalis Lectin; AAL: Aleuria Aurantia Lectin; PNA: Peanut agglutinin; JAC: Jacalin; MAA, MALII: Maackia Amurensis Lectin II; SNA, SBNL: Sambucus Nigra Agglutinin, Elderberry Bark Lectin; DSL: Datura Stramonium Lectin; WFL: Wisteria Floribunda Lectin; FITC: Fluorescein Isothiocyanate
Introduction
Mouse Embryonic Stem (ES) cells were first derived from inner cell mass of mouse blastocysts isolated from pre-implantation embryos on feeder layers [1,2]. The use of mouse ES cells provided a deeper understanding of the mechanisms of cell differentiation and observations of the physiological consequences of genetic mutations. Most importantly, the pluripotent nature of mouse ES cells enabled the generation of transgenic and knockout mice, which has revolutionized genetic research, allowing the development of countless animal models for human diseases [3].
Key regulators of pluripotency and self-renewal including Oct4 and Nanog are well known markers of mouse ES cells [4]. These transcription factors regulate the expression of numerous genes responsible for stem cell fate and pluripotency such as Sox2, Foxd3, Setb1, Rif1 and Esrrb [4]. Apart from transcription factors, cell surface markers of mouse ES cells for pluripotency have also been identified. The most common cell surface carbohydrate antigen specifically found on murine ES cells is the stage specific embryonic antigen 1 (SSEA-1) – also known as Lewis x or CD15 – which is important for cell-cell adhesion in tightly compacted colonies of mouse ES cells [5,6,7]. Other surface markers include CD324, CD90, CD117, CD9 and CD326 [8].
Carbohydrate modifications of proteins and lipids on cell surface of ES cells have also been reported to be important in maintenance of pluripotency and stem cell fate [9]. Glycosylation, a process by which glycans or carbohydrate are attached to proteins or lipids, are common post-translational carbohydrate modifications. Glycans play essential roles in biological process such as cell development and differentiation. Lectins are proteins that bind to glycans and are universally present in animals, plants and bacteria. Lectin profiles are widely used to characterize carbohydrates of glycoproteins, glycolipids or polysaccharides. Venable et al. [10] was the first to characterize carbohydrate patterns through lectin profiles in SSEA- 4-enriched human ES cells. Additionally, a panel of lectin biomarkers has been identified for the isolation of pluripotent human ES cells [9]. Lectin probes and more recently, lectin microarrays have also been utilized to distinguish undifferentiated from differentiated ES cells in both human and mouse ES cells [11,12,13].
In the present study, carbohydrate profiles of ES-D3 and ESC57BL/ 6 mouse ES cell lines were analyzed. These cell lines have been shown to express SSEA-1, the pluripotency marker in mouse ES cells [14,15]. SSEA-1-positive cells were enriched by flow cytometry before carbohydrate analysis using a panel of 14 carbohydrate antibodies and lectins. The study showed distinct expression and localization of carbohydrate and lectins on cell surface of the mouse ES cells.
Materials and Methods
Chemicals
All cell culture reagents were purchased from Invitrogen Life Technologies (Merelbeke, Belgium), unless indicated otherwise. Anti-SSEA-1 antibody was purchased from Santa Cruz Biotechnology Inc. Rat anti-mouse IgM-microbeads and LS+ positive selection column were purchased from Miltenyi Biotec Inc. (Miltenyi Biotec. Inc., Bergisch Gladbach, Germany). L3, L4 and L5 antibodies were produced as previously described and presented by Melitta in Hamberg University [16,17,18]. R-Phycoerythin (R-PE)-conjugated mouse anti-rat monoclonal, R-Phycoerythin (R-PE)-conjugated rat anti-mouse IgM monoclonal Ab, PerCP-CY5.5-conjugated rat antimouse IgM monoclonal, PerCP-CY5.5-conjugated mouse antirat IgM monoclonal Ab, PerCP-CY5.5-conjugated streptavidin and R-PE-conjugated rat anti-mouse IgM monoclonal antibodies were purchased from BD Biosciences (Franklin Lakes, NJ, USA). Biotinylated lectins and Texas Red Avidin D were purchased from Vector Laboratories, Inc. (Burlingame, CA, USA). FITC-conjugated rat anti-mouse IgM Ab and Cy3-conjugated mouse anti-rat IgM Ab were purchased from Invitrogen Detection Technologies, Oregon, USA. Leukemia Inhibitory Factor (LIF) was purchased from Chemicon Incorporation, Temecula, CA, USA.
Cell culture
All cell culture reagents were purchased from Invitrogen Life Technologies (Merelbeke, Belgium) unless indicated otherwise. ES-D3 embryonic stem cell line derived from the blastocysts of 129 S2/SvPas mouse and ES-C57BL/6 embryonic stem cell line derived from the C57BL/6J mouse were purchased from ATCC (Global Bioresource CenterTM, Manassas, USA). ES cells were grown in ESDMEM supplemented with 15% ES-FBS, 1 × non-essential amino acids, 2 mM L-glutamine, 50 U/mL penicillin, 50μg/mL streptomycin, and 0.1 mM 2-mercaptoethanol. Undifferentiated ES cells were grown on Mitomycin C-Treated Mouse Embryonic Fibroblasts (MEFs) in the presence of 1,000 U/mL Leukemia Inhibitory Factor (LIF; Chemicon Inc.). ES cells were passaged every 2 or 3 days using 0.05% trypsin/0.04% EDTA for 2-3 minutes or mechanical dissection with BD Medimachine. Flow cytometry assay was performed using routinely maintained adherent mouse ES cell colonies.
Enrichment of SSEA-1 positive mouse Embryonic Stem Cells (ESCs)
Murine ES cells were grown in 10cm dishes and trypsin/EDTA passaged into single cell suspensions as described above. Cells were incubated at 4°C for 30 minutes in 1:10 dilution of purified antimouse IgM in D/G buffer. D/G buffer consisted of 0.5% BSA and 2 mM EDTA in Phosphate Buffered Saline (PBS), pH7.4. After incubation, 2 ml D/G buffer was added and cells were re-suspended and centrifuged at 300g for 5 minutes. Supernatant was removed, leaving the cell pellet intact, and cells were washed again in D/G buffer and re-suspended. After centrifugation, cells were incubated at 4°C for 30 minutes in 1:10 dilution of SSEA-1 antibody in D/G buffer. After washing with D/G buffer for 3 times, a 1:4 dilution of secondary anti-mouse IgM-beads in D/G buffer were added to the cell pellet, and the re-suspended pellet was incubated at 4°C for 5 minutes. After incubation, 5 ml of D/G buffer was added to wash the cell pellet, followed by centrifugation (300g) for 5 minutes. This process was repeated two more times with 5 ml D/G buffer. The cells were finally re-suspended in 500 μl of D/G buffer before being applied to a prewashed magnetic beads column. The flow through from the column was collected and applied to the magnetic beads column thrice. Then, 5 ml of D/G buffer was applied to the magnetic beads column to obtain the eluate. The eluate was collected and cells were counted. Cells were then subjected to flow cytometry. Flow cytometry results presented here are from mouse ES cells that were used immediately after the enrichment.
Flow cytometry assay
Cell surface carbohydrate expression of SSEA-1 enriched mouse ES cells was assessed by indirect immunofluorescence detected by flow cytometry to provide a quantitative binding percentage and fluorescence intensity of SSEA-1 Ab, carbohydrate antibodies and lectins. FACSCalibur (Becton-Dickinson, San Jose, USA) equipped with an argon laser with emission wavelength at 488 nm was used. Flow cytometry results presented here are from mESCs that were used immediately after the SSEA-1 positive cell enrichment procedure. Cell Quest Pro software (Becton-Dickinson) was used for cell acquisition and analysis. Mouse ES cells were prepared, cultured and harvested into single cell suspensions using trypsinization as described above. The cells were digested with 0.05% trypsin and washed twice with PBS (Gibco, Long Island, USA). Single cell suspension was prepared in PBS with 10%FBS with the concentration adjusted to 107 cells/ ml for indirect antibody labeling. The SSEA-1 positive ES cells were enriched as described above. Then, cells were placed in 4 ml sterile conical tubes (Falcon, Becton-Dickison) in aliquots of 500,000 cells each and stained with one of the 14 carbohydrate antibodies and lectins. Cells were washed 3 times with PBS and subsequently stained with primary antibodies. Cells were double stained with one of the 14 carbohydrate antibodies and lectins and SSEA-1 Ab, then stained with secondary antibodies after washing with PBS. The secondary antibodies were chosen so that there would not be any overlap in the emission/excitation wavelengths and so that double staining could be performed. Unstained, enriched mouse ES cells and enriched mouse ES cells stained with secondary antibodies alone were used as controls. Flow cytometry was performed using a Beckman Coulter Cytomics FC 500 Flow Cytometer. Data analysis was performed using the RXP Analysis Software by Beckman Coulter and Windows Multi Document Interface for Flow Cytometry (WinMDI 2.8). At least three independent assays were carried out using both ES-D3 cell line and ES-C57BL/6 mouse ES cell line.
Immunocytochemical staining
Immunocytochemistry staining was used to analyze the localization and staining patterns of cell surface carbohydrate expression and SSEA-1 on routinely maintained adherent cultures of mouse ES cells. Mouse ES cells were fixed in 4% paraformaldehyde in PBS for 30 minutes and then washed 3 times with PBS. After blocking in 1% BSA for 1 hour, cells were double stained with one of the 11 biotinylated lectins, 3 carbohydrate antibodies and SSEA-1 Ab for 1 hour, followed by washing with PBS thrice. Cells were stained with secondary antibodies for 1 hour and then washed 3 times with PBS. After drying, cells were mounted with Hard SetTM fluorescence mounting medium (Vector Laboratories, Inc. Burligame, CA, USA) including DAPI to detect cell nuclei. Controls of unstained cells were obtained by incubation with secondary antibodies alone. All slides were visualized using a LSM510 laser microscope. Individual color channels were captured separately and merged using the LSM510 software.
Statistical analysis
All data were expressed as mean ± S.E.M. Statistical evaluations were achieved by one-way analysis of variance and Student’s t-test. Differences were considered to be significant when p < 0.05.
Results
Carbohydrate analysis using flow cytometry
To decrease non-specific binding, purified anti-mouse IgM was used to block mouse ES cells. After blocking, the non-specific binding was decreased from 14.36% to 3.61% (Figure S1). To obtain undifferentiated mouse ES cells, magnetic beads sorting method was used to enrich SSEA-1 positive mouse ES cells. After enrichment, about 99.95 ± 0.87% of mouse ES cells were SSEA-1 positive (Figure 1). To determine the presence and binding percentage of 14 chosen carbohydrate Abs and lectins on pluripotent mouse ES cell surfaces, both karyotypically normal mouse ES cell lines (ES-D3 and ESC57BL/ 6) were analyzed using flow cytometry with the panel of Abs and lectins together with the pluripotency marker, SSEA-1. A broad range of binding percentages was observed (Figure 2). The highest binding percentages were detected using PNA, DSL, JAC, GNL, PSA, AAL and LTL. The binding percentages for PNA, DSL, JAC and GNL were similar to that of SSEA-1, which showed over 99.9% of positive binding in enriched mouse ES cells. Figure 3B and 3C show the shifted histogram plots of GNL and DSL, as representatives of these high percentage binding Abs and lectins. The flurorescence intensity of DSL binding was higher than GNL binding. The binding percentages of PSA, AAL and LTL ranged from 95-99% of enriched mouse ES cells. Two lectins, MAA and UEAI, binding percentage were very low. Analysis of MAA and UEAI histograms showed a little peak shifts using these lectins (Figure 3E and 3F).
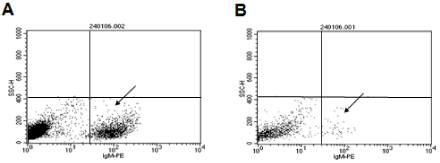
    Figure S1:  Effect of blocking with purified anti-mouse IgM. To decrease non-specific binding, purified anti-mouse IgM was used to block the mouse ES cells. After
blocking, the non-specific binding was decreased from 14.36% (A, left arrow) to 3.61% (B, right arrow).
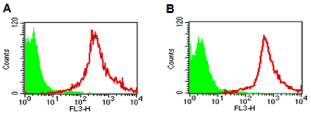
    Figure 1:  Effect of magnetic beads sorting. The histogram of unstained,
control mouse ESCs (green) and cells stained with SSEA-1 antibody (red)
after enrichment. A: the sorting results of mouse ES-D3 cells, B: the sorting
results of mouse ES-C57BL/6 cells.
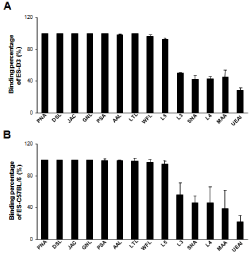
    Figure 2:  Quantitation of lectins and carbohydrate Abs binding on pluripotent
mouse ES cells surface. To determine the presence and binding percentage
of 14 chosen carbohydrate Abs and lectins, karyotypically normal mouse ES
cell lines (A: ES-D3 and B: ES-C57BL/6) were analyzed using flow cytometry
with the panel of Abs and lectins and the pluripotency marker, SSEA-1. The
data are presented as mean ± SD of 3 independent assays.
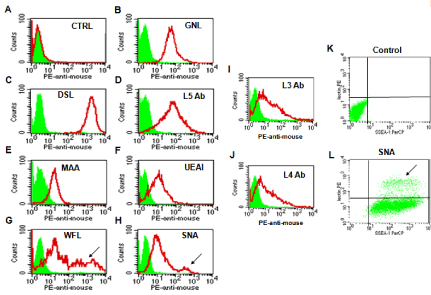
    Figure 3:  Glycosylation patterns on the cell surface of mouse ES cells. Carbohydrate expression on the cell surface of mouse ES cells was assayed by flow
cytometry. The filled green areas show the number of unstained cells and the areas outlined in red represent cells binding to various lectins and carbohydrates
antibodies. A: The result for the unstained cells. Figure 3K and 3L show the double staining results. Figure 3K shows plots of unstained mouse ES cells and Figure
3L shows subpopulations of cells characterized as SSEA-1(+)/SNA(-) (lower) or SSEA-1(+)/SNA(+) cells (upper, arrow).
Some lectins were found to partially bind to mouse ES cell colonies. These lectins revealed two distinct subpopulations of cells that include a SSEA-1(+)/lectin (-) population and a SSEA-1(+)/ lectin (+) population. For example, Figure 3G shows a representative histogram plot of WFL which shows a large population of WFL positive (weak) and negative cells that overlap the unstained control cells; However, the arrow indicates another smaller population of cells that shows a peak shift representing strong WFL binding. Figure 3L shows the comparison of unstained control cells to the shifted plot of SNA in which there are two distinct populations of cells present: a SSEA-1(+)/SNA(-) population containing the majority of cells, and a smaller but still distinct SSEA-1(+)/SNA(+) population indicated by the arrow. Lectins that bound in this way include WFL, SNA and AAL.
Carbohydrate analysis using immunocytochemical method
Both ES-D3 and ES-C57BL/6 mouse ES cell lines were analyzed by immunocytochemistry to determine the localization of carbohydrates and whether particular staining patterns were present in adherent colonies maintained in culture. Cells were either passaged mechanically or by trypsinization and we did not observe obvious differences in mouse ES cell colony staining patterns between these passage methods.
Immunocytochemistry results of all 14 carbohydrate Abs and lectins supported our flow cytometry analysis. Six lectins (PNA, DSL, JAC, GNL, PSA and AAL) bound throughout the colonies without any localized patterns of binding. They appeared to bind to cells that also expressed SSEA-1. Figure 4A-4C shows a mouse ES cell colony stained with DSL (red) and SSEA-1 (green). We also observed interesting patterns of carbohydrate expression for the Abs and lectins that showed two subpopulations of cells when analyzed using immunocytochemistry. WFL bound to distinct regions of a SSEA- 1 positive colony (Figure 4D-4E), in contrast to the more uniform binding described above. In Figure 4D, the arrow shows a region where there is no WFL binding, but this region is SSEA-1 positive, as shown in Figure 4E. In Figure 4F, in the peripheral part of the same mouse ES cell colony, the binding of SSEA-1 Ab and L5 Ab are strong, conversely, in the middle of the colony, cells are beginning to lose SSEA-1Ab binding (green) but still have strong L5 Ab binding (red).
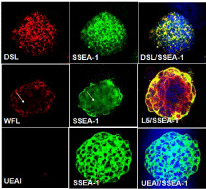
    Figure 4:  Carbohydrate expression determined by lectins and carbohydrate
Abs using immunocytochemistry method. Immunocytochemistry for DSL,
WFL or L5 (red) in SSEA-1 positive colony (green) indicates different
carbohydrate expression patterns.
Using immunocytochemistry, we also demonstrated that a small percentage of UEAI and MAA were bound to mouse ES cell colonies. Figure 4G-4I show a mouse ES cell colony which is SSEA-1 positive (green) and is stained with DAPI (blue) but show almost no UEAI binding (Table 1).
    Name
    Monosaccharide    specificity
    Inhibitors


    L3 Ab
    Man


    L4 Ab
    Man


    PSA    (Pisum sativum agglutinin)
      mixture
    Man
    methyl    mannoside and glucoside


    GNL    (Galanthus nivalis lectin)
    Man
    alpha-methyl    mannoside


    L5 Ab
    Fuc


    LTL    (Lotus tetragonolobus lectin)
    Fuc
    L-fucose


    UEAI    (Ulex europaeus agglutinin I)
    Fuc
    L-fucose


    AAL    (Aleuria aurantia lectin)
    Fuc
    L-fucose


    PNA    (Peanut agglutinin)
    Gal
    galactose


    Jacalin
    Gal
    galactose    or melibiose


    MAA    (Maackia amurensis lectin II)
    Sialic    acid
    human    glycophorin


    SNA    (sambucus nigra)
    Sialic    acid
    lactose


    DSL    (Datura stramonium lectin)
    lactosamine
    chitin    hydrolysate


    WFL    (Wisteria floribunda lectin) acid
    GalNAc
    N-acetylgalactosamine    or acetic
Table 1: Lectins and carbohydrate antibodies used in this study. Table 1 shows the chosen carbohydrate Abs and lectins, their commonly abbreviated names, the
specificity of these Abs and lectins to their respective monosaccharide’s and the competitive sugar that was used to verify its respective specificity.
Discussion
Undifferentiated mouse ES cells are commonly characterized by the presence of CD9, SSEA-1 and Forssman antigen on the cell surface [8,19,20]. Apart from these well-established markers, undifferentiated ES cells have also been characterized by the unique carbohydrate antigen profiles present on the cell surface. In the present study, SSEA-1-positive undifferentiated mouse ES cells were enriched and subsequently assessed for carbohydrate signatures on the cell surface by a panel of carbohydrate antibodies and lectins.
Mouse ES cells appeared to have high levels of mannose and galactose as depicted by the uniform and high expression of Gal β(1,3)-GalNAc (PNA and JAC), N-acetyllactosamine (DSL), α(1,3)- mannose (GNL) and α-D-mannose (PSA). In agreement to our data, Nand et al. [11] has shown that R1 mouse ES cells could be distinguished from mouse embryonic fibroblast stem cells by high lectin bindings of PNA, SNA and Dolichos Biflorus Agglutinin in mouse ES cells compared to fibroblast stem cells. Similarly, high levels of high mannose glycans have been detected on cell surface of human ES cells, in contrast to human somatic cell lines where high mannose glycans are minor components of the cells [21]. Additionally, human ES cells have been shown to highly express poly-N-acetyllactosamine and b-galactosyl residues [13].
Contrary to the uniform pattern observed, fucosylation, sialylation and N-acetylgalactosamine were only expressed in a partial of the ES cells as depicted by the staining patterns of N-acetylgalactosamine (WFL), α(1,6)-L-fucose (AAL) and α(2,6)-GalNAc (SNA). This gave rise to two sub-populations of cells - SSEA(+)/lectin(+) and SSEA(+)/ lectin(-). Changes in the pattern of Glycosylation are often observed during development and differentiation processes. For example, fucosylation has been implicated in embryonic development, having roles in early embryogenesis, embryo compaction and neurogenesis [22]. A shift from high mannose glycans to high fucosylated and sialylated glycans has also been observed at the cell surface of colorectal adenocarcinoma cells during differentiation [23].
In some mouse ES cell colonies, we also observed a strong staining of SSEA-1 at the periphery of the colony which gradually weakens as it approaches the middle of the colony. Interestingly, this is accompanied by relatively intense staining of L5 antibody which recognizes fucose residues [18]. As cells lose the expression of SSEA-1 and thus, start to differentiate, the carbohydrate presentation on cell surfaces might be altered. L5 is an oligosaccharide which has been found in many glycoprotein’s and cell recognition molecules, such as the L1 molecules [18]. L1 molecules are carbohydrate carrying molecules which have been shown to be glycan-binding molecules affecting glycosylation processes. For instance, glial CD24 regulates neurite outgrowth by α(2,3)-linked sialic acid and Lewis x transinteraction with L1 and TAG and Contact in [24]. L1 has also been shown to influence the expression of glycosyltransferases thereby modulating fucosylation and sialylation, which consequently, regulates ES cell survival and proliferation [25].
Low percentages of Neu5Ac α (2,3)Gal (MAA, MALII) and α(1,2) L-fucose (UEAI) were observed on the cell surface of the mouse ES cell lines studied. Previously, it has been shown that binding of MAA was increased in mouse embryonic fibroblast stem cells compared to ES cells while UEAI was found to be absent in mouse ES cells [11].
Lectins and carbohydrate antigens have been commonly used to characterize and enrich glycoprotein’s. The enrichment of glycoprotein’s by Concanavalin A, wheat germ agglutinin and PNA has allowed the discovery of glycoprotein’s responsible for the differentiation of glioblastoma stem cells [26]. Furthermore, lectins have also been successfully used to isolate glioma-derived stem cells in neurospheres cultured from a resected cerebellar glioblastoma patient [27]. Polylactosamine-specific DSL has been used for characterization of specific glycans as tumor markers in various cancers [28]. Increased fucosylation as detected by lectins such as AAL and UEA1 was observed in pancreatic cancer stem cells resistant to gemcitabine [29]. Lectins such as MAA, PSA, and UEA1 have been used to elucidate the N-glycan profile of human ES cells during its differentiation stage [30]. Taken together, using a panel of 14 carbohydrate antigens and lectins, the study has shown that mouse ES cells possess a wide range of carbohydrate antigens that can be used as surface markers.
Acknowledgements
This work was supported by grants to Y.L. Li from National Natural Science Foundation of China (31070728) and J.L. Hu from Shenzhen Govermental Basic Research Grant (JCYJ20140416122812008).
References
- Evans MJ, Kaufman MH. Establishment in culture of pluripotential cells from mouse embryos. Nature. 1981; 292: 154-156.
- Martin GR. Isolation of a pluripotent cell line from early mouse embryos cultured in medium conditioned by teratocarcinoma stem cells. Proc Natl Acad Sci U S A. 1981; 78: 7634-7638.
- Mak TW. Gene targeting in embryonic stem cells scores a knockout in Stockholm. Cell. 2007; 131: 1027-1031.
- Loh YH, Wu Q, Chew JL, Vega VB, Zhang W, Chen X, et al. The Oct4 and Nanog transcription network regulates pluripotency in mouse embryonic stem cells. Nat Genet. 2006; 38, 431-440.
- Cui L, Johkura K, Yue F, Ogiwara N, Okouchi Y, Asanuma K, et al. Spatial distribution and initial changes of SSEA-1 and other cell adhesion-related molecules on mouse embryonic stem cells before and during differentiation. J Histochem Cytochem. 2004; 52: 1447-1457.
- Henderson JK, Draper JS, Baillie HS, Fishel S, Thomson JA, Moore H, et al. Preimplantation human embryos and embryonic stem cells show comparable expression of stage-specific embryonic antigens. Stem Cells. 2002; 20: 329- 337.
- Solter D, Knowles BB. Monoclonal antibody defining a stage-specific mouse embryonic antigen (SSEA-1). Proc Natl Acad Sci U S A. 1978; 75: 5565-5569.
- Zhao W, Ji X, Zhang F, Li L, Ma L. Embryonic stem cell markers. Molecules. 2012; 17: 6196-6236.
- Wang YC, Nakagawa M, Garitaonandia I, Slavin I, Altun G, Lacharite RM, et al. Specific lectin biomarkers for isolation of human pluripotent stem cells identified through array-based glycomic analysis. Cell Res. 2011; 21, 1551- 1563.
- Venable A, Mitalipova M, Lyons I, Jones K, Shin S, Pierce M, et al. Lectin binding profiles of SSEA-4 enriched, pluripotent human embryonic stem cell surfaces. BMC Dev Biol. 2005; 5: 15.
- Nand A, Singh V, Wang P, Na J, Zhu J. Glycoprotein profiling of stem cells using lectin microarray based on surface plasmon resonance imaging. Anal Biochem. 2014; 465: 114-120.
- Toyoda M, Yamazaki-Inoue M, Itakura Y, Kuno A, Ogawa T, Yamada M, et al. Lectin microarray analysis of pluripotent and multipotent stem cells. Genes Cells. 2011; 16: 1-11.
- Wearne KA, Winter HC, O’Shea K, Goldstein IJ. Use of lectins for probing differentiated human embryonic stem cells for carbohydrates. Glycobiology. 2006; 16: 981-990.
- Khosravi-Farsani S, Amidi F, Habibi Roudkenar M, Sobhani A. Isolation and enrichment of mouse female germ line stem cells. Cell J. 2015; 16: 406-415.
- Toumadje A, Kusumoto K, Parton A, Mericko P, Dowell L, Ma G, et al. Pluripotent differentiation in vitro of murine ES-D3 embryonic stem cells. In Vitro Cell Dev Biol Anim. 2003; 39: 449-453.
- Kucherer A, Faissner A. Schachner M. The novel carbohydrate epitope L3 is shared by some neural cell adhesion molecules. J. Cell. Biol. 1987; 104: 1597-1602.
- Fahrig T, Schmitz B, Weber D, Kucherer-Ehret A, Faissner A, Schachner M. Two monoclonal antibodies recognizing carbohydrate epitopes on neural adhesion molecules interfere with cell interactions. Eur. J. Neurosci. 1990; 2: 153-161.
- Streit A, Yuen CT, Wendy Loveless R, Lawson AM, Finne J, Schmitz B, et al. The Lex carbohydrate sequence is recognized by antibody to L5, a functional antigen in early neural development. J. Neurochem. 1996; 66: 834-844.
- Oka M, Tagoku K, Russell TL, Nakano Y, Hamazaki T, Meyer EM, et al. CD9 is associated with leukemia inhibitory factor-mediated maintenance of embryonic stem cells. Mol Biol Cell. 2002; 13: 1274-1281.
- Wright AJ, Andrews PW. Surface marker antigens in the characterization of human embryonic stem cells. Stem Cell Re. 2009; 3: 3-11.
- An HJ, Gip P, Kim J, Wu S, Park KW, McVaugh CT, et al. Extensive determination of glycan heterogeneity reveals an unusual abundance of high mannose glycans in enriched plasma membranes of human embryonic stem cells. Mol Cell Proteomics. 2012; 11: M111 010660.
- Becker DJ, Lowe JB. Fucose: biosynthesis and biological function in mammals. Glycobiology. 2003; 13: 41R-53R.
- Park D, Brune KA, Mitra A, Marusina AI, Maverakis E, Lebrilla CB. Characteristic Changes in Cell Surface Glycosylation Accompany Intestinal Epithelial Cell (IEC) Differentiation: High Mannose Structures Dominate the Cell Surface Glycome of Undifferentiated Enterocytes. Mol Cell Proteomics. 2015; 14: 2910-2921.
- Lieberoth A, Splittstoesser F, Katagihallimath N, Jakovcevski I, Loers G, Ranscht B, et al. Lewis(x) and alpha2,3-sialyl glycans and their receptors TAG-1, Contactin, and L1 mediate CD24-dependent neurite outgrowth. J Neurosci. 2009; 29: 6677-6690.
- Li YL, Wu GZ, Zeng L, Dawe GS, Sun L, Loers G, et al. Cell surface sialylation and fucosylation are regulated by the cell recognition molecule L1 via PLCgamma and cooperate to modulate embryonic stem cell survival and proliferation. FEBS Lett. 2009; 583: 703-710.
- He J, Liu Y, Zhu TS, Xie X, Costello MA, Talsma CE, et al. Glycoproteomic analysis of glioblastoma stem cell differentiation. J Proteome Res. 2011; 10: 330-338.
- Tucker-Burden C, Chappa P, Krishnamoorthy M, Gerwe BA, Scharer CD, Heimburg-Molinaro J, et al. Lectins identify glycan biomarkers on glioblastoma-derived cancer stem cells. Stem Cells Dev. 2012; 21: 2374- 2386.
- Mitsui Y, Yamada K, Hara S, Kinoshita M, Hayakawa T, Kakehi K. Comparative studies on glycoproteins expressing polylactosamine-type N-glycans in cancer cells. J Pharm Biomed Anal. 2012; 70: 718-726.
- Terao N, Takamatsu S, Minehira T, Sobajima T, Nakayama K, Kamada Y, et al. Fucosylation is a common glycosylation type in pancreatic cancer stem cell-like phenotypes. World J Gastroenterol. 2015; 21: 3876-3887.
- Satomaa T, Heiskanen A, Mikkola M, Olsson C, Blomqvist M, Tiittanen M, et al. The N-glycome of human embryonic stem cells. BMC Cell Biol. 2009; 10: 42.