
Research Article
Adv Res Text Eng. 2016; 1(1): 1008.
Textile Dye Removal using Dried Sun Flower Seed Hull a New Low Cost Biosorbent: Equilibrium, Kinetics and Thermodynamic Studies
Oguntimein GB*
Department of Civil Engineering, Morgan State University, USA
*Corresponding author: Gbekeloluwa B. Oguntimein, Department of Civil Engineering, Morgan State University, USAt
Received: October 01, 2016; Accepted: November 11, 2016; Published: December 07, 2016
Abstract
The adsorption capacity of a neglected biosorbent, Dried Sunflower Seed Hull (DSSH), was investigated in this study for methylene blue dye removal. The influences of some operating variables including dye concentration and contact time on the dye biosorption were investigated in batch mode. Adsorption kinetics were examined by first and second order rate models, and intra particle diffusion models, while equilibrium studies were examined by Langmuir, Freundlich and Dubinin-Radushkevich isotherm models. D-R model fitted the data best with a biosorption capacity of 0.0365 mg/g. The standard Gibbs free energy change was also calculated to define the nature of biosorption process. These results revealed that the utilization of sunflower seed hull residues as dye biosorbent could be an interesting option from both environmental and economic point of view.
Introduction
Dyes are important compounds commonly used in various industries such as textile, paper, leather and plastic manufacturers [1]. The textile-dyeing industry consumes large quantities of water and produces large volumes of wastewater from different steps in the dyeing and finishing processes. Wastewater from printing and dyeing units is often rich in colour. The presence of even very low concentrations of dyes in the effluent is highly visible and undesirable. The effluent also contains residues of reactive dyes and harmful chemicals. Therefore, such wastewater needs to be properly treated before its release into the environment [2]. Many structural varieties of dyes exist, including acidic, basic, disperse, azo, diazo, anthraquinone based and metal complex dyes [3]. Annual dye production is estimated at about 100, 000 commercially available compounds with more than 7 × 10⁵ ton of dyestuff produced [4]. Consequently, textile industries produce vast amount of coloured wastewater due to low level of dye fiber fixation [5]. According to various dye classification, methylene blue is categorized as a highly toxic cationic dye [6]. Effluent dyes released from these industries constitute an important part of water pollution [7]. Disposal of untreated dye effluents has characteristics environmental effects due to the presence of toxic pollutants which are resistant to typical microbial biodegradation [8]. Most dyes are made recalcitrant compounds through their interaction with sunlight in the effluent wastewater and can transform to carcinogenic compounds under anaerobic conditions [9]. Such waste-water represents a large group of organic chemicals which could present health related risk to humans in excess amount [10]. Effluent dye wastewater is a large volume production which can supplement limited fresh water resources if properly treated [11].
Several treatment methods have been applied in the removal of dye such as chemical precipitation [12], reverse osmosis [13], ion exchange [14], solvent extraction [15] and ozonation [16]. However, these methods have significant drawbacks such as high capital and operational cost [17]. Adsorption method is an efficient and feasible wastewater treatment process which utilizes non-toxic, low cost and readily available adsorbents [18]. These adsorbents are effective against a wide range of pollutants and a potential alternative for costly processes. Adsorbents range from commercial to low cost materials such as activated carbon [19], peat [20], organoclay [21], peanut husk [22], peanut hull [23], pine sawdust [24], MIRHA [25, 26] and oil palm ash [27]. The environmental and cost advantages of non-conventional low cost adsorbents have prompted more research into this area. These advantages were summarized as follows:(i) Nonconventional adsorbent can compete favourably with conventional adsorbents in terms of efficiency depending on the characteristics and particle size of the adsorbents ,and the nature of the adsorbate. (ii) Non-conventional adsorbents are cost effective; require simple alkali treatment, less maintenance and supervision.
Materials and Methods
Preparation of Sunflower Seed Hull (SSH)
A 120 g packet of Sunflower seeds purchased from a local grocery was deshelled and the hull was milled in a coffee grinder. The milled hull was then separated into different particle seizes using with ASTM standard sieves with mesh seizes 60 (250μm aperture), 40 (425μm aperture) and 20 (850μm aperture). The fraction of the sunflower seed which is hull was determined by deshelling a known weight of seed and weighing the hull separated. The effect of acid and base treatment was studied using the fraction retained on the 40 mesh sieve. Three grams each of milled hull was soaked overnight in either 250 ml of 0.05M hydrochloric acid (HCl) or 250 ml of 0.05M sodium hydroxide (NaOH). The pHs of the supernatants were 1.36 and 12.66 respectively. The supernatant was removed and each fraction was washed thrice with 250 ml distilled water (dH2O). The pH of the acid treated Sunflower Seed Hull (SSH) was then adjusted to pH 5.0 with drops of 1M NaOH while the base treated SSH was adjusted to pH 5.5 with drops of 1 M HCl. The wet SSH was dried overnight at 70oC in a forced air drying oven to constant weight. The Dried Sunflower Seed Hull (DSSH) was used in the adsorption characteristics studies [28]. The sunflower plant is a native of North America. It was grown by the Indians for food in North Carolina before 1600 and by New England colonists for hair oil as early as 1615 [29]. The rising prominence of sunflower oil in world edible oil markets has stimulated increased interest in expanded U.S production for last decades. U.S acreage of sunflower planting has expanded rapidly in the 1970’s, reaching a peak at 5.5 million acres. The U.S sunflower production has declined in recent years. Currently U.S planted sunflower over 1.8 million acres in 2012 and approximately 1 million metric tons of sunflower seed were produced in 2011. 41% and 32.7 % of total sunflower planted acres were grown in the North Dakota and South Dakota in 2012, respectively [30]. Compared with soybean oil which currently dominates the US edible oils market, sunflower seed oil has a higher content of polyunsaturated fatty acids [29]. The world production of sunflower seed is 31.1 MT with the USSR being the largest producer producing 6.3MT, Ukraine 4.7MT, Argentina 3.7MT , China 1.9MT, India 1.9MT, USA 1.8MT [31]. The U.S produced around 6% of the world’s sunflower production and 85.1 % of total U.S sunflower production is for vegetable oils. In recent years, approximately 12 million acres of sunflowers have been grown in the world annually [32]. The hull accounts for 22 to 28% of the weight of sunflower seed and becomes a by product of the seed crushing operation. Large-seed varieties have higher proportion of hull than small-seed varieties. The most promising use for sunflower seed hulls appears to be as roughage ingredient for livestock feed. Sunflower hulls make coarse roughage, high in fiber but suitable for use in ruminant rations. Sunflower hull contains 11.5% moisture, 3.5% protein 3.4% fat and 22.1 % fiber [29].
The objectives of this study were to investigate the potential use of sunflower seed hull, as an effective biosorbent for the removal of methylene blue dye from aqueous solutions and study its thermodynamic and kinetic properties.
Preparation of dye solution
Methylene Blue (MB), the basic dye used as the model sorbate in the present study is a monovalent cationic dye. It is classified as C.I. Basic blue 9, C.I. solvent blue 8, C.I.52015. It has a molecular weight of 373.90. Methylene blue (MW 319.85 g/mole) was obtained from Sigma-Aldrich Milwaukee, Wisconsin USA. The chemical structure of MB is shown in Figure 1. A stock solution 1 mg/L was prepared by dissolving 0.05mg in 50 ml of distilled water. Various dilution of this stock solution was used for the batch studies. The experimental concentrations were obtained by dilution of this solution. 0.05M HCl or 0.05M NaOH was used for pH adjustment of the working solutions. The concentration of MB dye was measured at a wavelength of 664 nm using UV-Visible spectrophotometer (Gensys 5).

Figure 1: Chemical structure of Methylene blue.
Dye biosorption experiments
Batch biosorption experiments were performed in 50 ml plastic tubes containing 20 ml dye solution with vortex mixing 1ml aliquot were withdrawn every 15 min for absorbance measurement at 664nm using a Genesys 5 Scanning Spectrophotometer (Thermo Scientific, Madison, Wisconsin , USA) to determine the concentration of dye. The concentration of methylene blue dye was determined from a calibration plot of absorbance at 664nm versus concentration. The calibration plot was linear up to a methylene blue dye concentration of 1mM. The biosorption experiments were conducted in 50ml plastic tubes while the volume of the dye solution was kept at 20 ml in thermostatic water bath as describe in our earlier work [28,33]. All experiments were conducted at 39.50C while temperature studies were conducted between 24.5 and 54.50C.
The biosorption capacity, q (mg/g) and Percent Dye Biosorbed (PDB) were calculated using the following equations [33]
q= (C0−Ct)…… …………..1
qe=(C0−Ce)V/M……………………..2
PDB=[1−Ct/C0]*100%................................3
Where Co (mg/L) is the initial dye concentration, Ct (mg/L) is the residual dye concentration at time t (min), Ce (mg/L) is the concentration at equilibrium, V (L) is the volume of dye solution, and M (g) is the amount of biosorbent used. The q value is equal to qt and qe at time t and at equilibrium respectively. In this study each experiment was in duplicate and the average values obtained from these experiments were used to give results.
Result and Discussion
Effect of contact time and temperature
The effect of contact time and temperature on the biosorption of MB on DSSH is shown in Figure 2. As seen the figure, a contact time of about 20 min was generally sufficient to achieve equilibrium and the dye removal did not change significantly with further contact. The biosorption rate of dye was very fast in the first 10 min due to the surface biosorption. A rapid dye uptake and achieving equilibrium in short time implies the efficiency of biosorbent for dye removal from aqueous environment. It is apparent that the dye biosorbed is a function of contact time and temperature. The time profile for the biosorption of MB onto DSSH was smooth continuous leading to saturation and approached equilibrium around 120 min. It was also evident that almost 90% of MB was biosorbed during the first ten minutes at all temperature levels. Higher rate of dye removal was observed during the initial phase of biosorption due to availability of free sites on the upper surface of the biosorbent. First phase of higher removal rate was followed by a phase of slow dye removal [34,35]. The reason why low adsorption of MB subsequently occurred was perhaps that aggregation of MB molecules negated the influence of contact time as the micropores were filled up and started offering resistance to the diffusion of aggregated dye molecules in the adsorbents [35]. A rapid uptake of adsorbate by an adsorbent is especially important when applied to wastewater treatment by means of adsorption which signifies the efficacy of an adsorbent to be used in wastewater treatment [36].
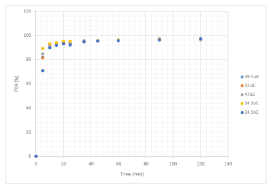
    Figure 2:  Effect if contact time on biosorption of Methylene blue on DSSH at
different temperatures.
Effect of pH on biosorption
One of the important parameters in biosorption is the effect of pH. The Percentage of MB biosorbed (PDB) increased with the increase of solution pH as the surface becomes progressively more negatively charged. The MB removal was nearly constant in the pH range of 6.0–10.0, while the biosorption capacity qe attained a maximum value between pH 6.0 and 8.0 Figure 3. Similar effect was also reported for other low-cost biosorbents such as breadnut peel [36]. MB is a cationic dye and therefore, as the pH decreases, the surface of the DSSH becomes more positively charged which results in an increase in the electrostatic repulsion between the positively charged adsorbate and the positively charged MB cations [36]. The low value of dye removal and biosorption capacity is due to the protonation of the functional groups which makes the surface of the biosorbent more positive and cause the repulsion between dye molecules and biosorbent [37]. According to [38] dye removal from solution by biosorbent could be governed by: (i) Polarization effects between the dye ions and the biosorbent surface sites, leading to physisorbed species due to weak electrostatic forces, and (ii) Diffusion limitations affecting the kinetic parameters, namely mass transfer of the dye molecules into the porous structure of the biosorbent.
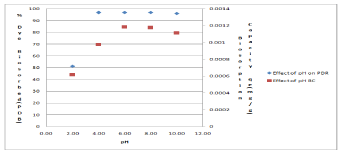
    Figure 3:  Effect of pH on Percent Dye Removal (PDR) and Biosorption
capacity at 39.5oC.
Effect of initial dye Concentration
The influence of varying the initial dye concentration from 0.005 to 0.025 mg/L was investigated and the results are shown in the Figure 4. As the initial methylene blue concentration increased the per cent dye removed increased to a maximum value while the biosorption capacity increased linearly. Similar results were reported for the biosorption of azure dye on DSSH [28]. This was due to the increasing driving force in the concentration gradient and increasing electrostatic interactions between surface sites and dye [39].
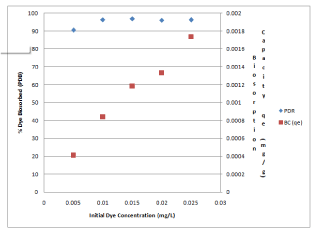
    Figure 4:  Effect of methylene blue concentration on Percent Dye Biosorbed
(PDB) and Biosorption Capacity (BC).
Effect of biosorbent dosage
Figure 5 shows the effect of biosorbent dosage on the dye removal and biosorption capacity. It was found that when the biosorbent dosage increased from 0.05 to 0.45 g, the per cent dye removed was maximum at 0.25g, while the biosorption capacity decreased from 0.00577 to 0.000423 mg/g. The number of sites available for biosorption depends upon the amount of the biosorbent. The increase in the percent dye biosorbed with increase in biomass dosage is due to increase in active sites on the biosorbent and thus making easier penetration of the dye to the sorption sites [40]. The decrease in the biosorption capacity at higher biosorbent concentration may be attributed to overlapping or partial aggregation of biosorption sites on the biosorbent surface. This fact results in a decrease in effective surface area of the biosorbent available to the dye molecules [41,42] Sites on the biosorbent surface. This fact results in a decrease in effective surface area of the biosorbent available to the dye molecules [41,42]. Further increase in the biosorbent concentration up to 0.45 g/L did not significantly change the PDR. This is due to the binding of almost all dye molecules to the biosorbent surface and the establishment of equilibrium between the dye molecules on the biosorbent and in the solution [43,44].
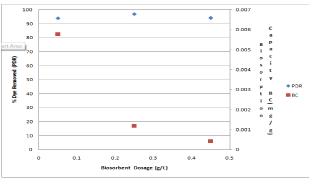
Figure 5: Effect of biosorbent dosage on the PDB and BC at 39.50C.
Biosorption equilibrium studies
Biosorption isotherms indicate how the dye molecules are distributed between the liquid and solid phases at a constant temperature under equilibrium state. There are several isotherm equations describing the biosorption equilibrium. These models provide valuable information on the possible biosorption mechanism, surface property, capacity and affinity of biosorbent. Thus, the isotherm data of dye biosorption onto DSSH were assessed using the models of Freundlich [45], Langmuir [46] and Dubinin- Radushkevich [47]. Freundlich isotherm is the earliest known relationship describing the non-ideal and reversible biosorption, not restricted to the formation of monolayer. This empirical model can be applied to multilayer biosorption, with non-uniform distribution of biosorption heat and affinities over the heterogeneous surface [48]. Non-linear equation of this model is given as:
qe= KfCe1/nF⁄……………1
Where qe (mg/g) is the dye biosorption capacity of biosorbent at the equilibrium. Ce (mg/L) is the dye concentration at equilibrium. KF (mg/g (L/mg)1/nF) and nF are Freundlich isotherm constants related to biosorption capacity and intensity, respectively. Langmuir model supposes that the biosorption process comes from the monolayer coverage of biosorbate over a homogenous biosorbent surface and that biosorption occurs on specific homogeneous sites within the biosorbent and all its biosorption sites are energetically identical [49,50]. The non-linear Langmuir equation is written by:
qe=qmKLCe/1+KLCe……………2
Where qm (mg/g) is the maximum biosorption capacity of biosorbent. KL (L/mg) is Langmuir equilibrium constant related to the biosorption energy. On the other hand, Dubinin-Radushkevich isotherm model is usually applied to distinguish the physical and chemical nature of biosorption process, with its mean free energy, E (kJ/mol) , inscribed as E = 1/(2B)1/2) per molecule of biosorbate (for removing a molecule from its location in the biosorption space to the infinity) [48]. Hence, the biosorption equilibrium data were further tested by the non-linear Dubinin-Radushkevich model representing as:
qe=qme−βε2…………3
where β (mol2 /kJ2) is a constant related to the mean free energy of biosorption, ε is the Polanyi potential which is equal to RT ln (1 + (1/Ce)). R (J/mol/ K) is the universal gas constant and T(K) is the absolute temperature. The calculated equilibrium parameters and statistical data are listed in Table 1. Based on the values of R2, the Dubinin-Radushkevich model was the best isotherm equation for this biosorption system. In addition, the maximum dye biosorption capacity for the biosorbent was found to be 0.0365mg/g. On the other hand, the values of nF and RL (the equilibrium parameter written as RL = 1/ (1 + KLCo) obtained from Freundlich and Langmuir models were calculated to be 1.12 and 0.430, respectively. The mean free energy defined from Dubinin-Radushkevich equation was found as 7.45 kJ/mol. The magnitude of E value characterize the type of the biosorption as chemical ion exchange (E = 8–16 kJ/ mole) [51], or physical sorption (E<8kJ/mole) [52]. The mean free energy of biosorption (E) is found between kJ/mole at different temperatures, which implies that, the biosorption of methylene blue on DSSH may be considered as physical biosorption.
    Model
    Parameter


    Freundlich
    KF(mg/g)(L/g)1/n
      nF
      R2
    0.964
      1.13
      0.9561


    Langmuir
    KL (L/mg)
      qm (mg/g)
      RL
      R2
    88.44
      0.0263
      0.430
      0.9493


    Dubinin-Radushkevich (D-R)
    qm (mg/g)
      β (mol/kJ)2
      E (kJ/mol)
      R2
    0.0365
      9E-09
      7.45
      0.9608
Table 1: Isotherm model parameters and constants with correlation Coefficient.
Analysis of biosorption kinetics
Kinetic models describe the dynamic behaviour of biosorption process operated under different experimental conditions. They are very useful for scale-up and process optimization studies [53]. In order to predict the mechanism involved during methylene blue biosorption on DSSH, various kinetic models namely, pseudo-firstorder, pseudo-second-order, and intra-particle diffusion model [54,55] were used to fit the experimental data. The pseudo-first-order is based on solid capacity. This model considers the rate of occupation of biosorption sites proportional to the number of unoccupied sites [49]. This model is expressed by:
qe= qe(1−e−k1t)..........…4
Where qt and qe (mg/g) are the biosorption capacity of dye at a time t and the equilibrium, respectively. k1(min-1) is the biosorption rate constant of pseudo-first-order model.
The pseudo-second-order kinetics is usually associated with the situation when the rate of direct biosorption/desorption process controls the overall biosorption kinetics and generally shown as:
qt=k2qe2t/1+ k2qet..........5
Where k2 (g/ mg. min) is the pseudo-second-order rate constant.
Since the above kinetic models cannot validate the diffusion mechanism, the experimental data were further tested by the intraparticle diffusion model and it is represented as:
qt=kpt1/2+C………6
Where kp (mg/g1 min1/2) is the intra-particle diffusion rate constant and C (mg/g) is a constant providing information about the thickness of boundary layer. The biosorption parameters of all models and statistical data are presented in Table 2. The best-fit model was selected on the basis of the correlation coefficient R2, and qe. Based on the high R2 values from the table, methylene blue biosorption onto DSSH was best described by the pseudo-second-order model. Figure 6 shows the plot of t/q versus time for the biosoption of methylene blue onto DSSH at different dye concentrations.
    Parameter values : dye concentration (mg/L)


    Models
    Parameters
    0.010
    0.015
    0.02
    0.025


    First order
    k1
      qe(calc) x 10-4
      R2
    0.0539
      0.0887
      0.7138
    0.0642
      2.67
      0.8381
    0.0722
      2.30
      0.7435
    0.0679
      3.07
      0.7356


    Second order
    k2 x 109
      qe(calc) x 103
      h x 103
      R2
    1.23
      0.842
      1.733
      1.00
    1.75
      1.185
      1.244
      1.00
    3.82
      1.341
      2.124
      1.00
    7.83
      1.748
      2.564
      1.00


    Intraparticle diffusion
    kiD
      Ci
      R2
Table 2:  Kinetic parameters of MB adsorption on DSSH: Condition 0.25 g DSSH
39.5oC.
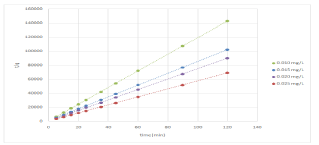
    Figure 6:  Pseudo-second order kinetic plots for the biosorption of various
methylene blue concentrations at pH 6.0 and 39.50C.
These results revealed that the rate of dye removal might be controlled largely by the ultimate interaction of dye molecules with the biosorbent [49]. Moreover, the solute transfer is characterized by the boundary layer diffusion, intra-particle diffusion, or both in a solid/liquid biosorption system [2]. In order to explain the diffusion mechanism, the intra-particle diffusion model was also applied to the kinetic data. If the regression of qt versus t1/2 is linear and the plot passes through the origin, then intra-particle diffusion plays the most important role in the biosorption process [55]. For this study, the regression of qt versus t1/2 given a multi-stage plot which was fitted to a fifth degree polynomial Figure 7. The initial curved region corresponds to the external surface sorption, in which the dye diffuses through the solution to the external surface of biosorbent. The second stage relates the gradual sorption reflecting intra-particle diffusion as the rate-controlling step. The final plateau region points out the surface sorption and the equilibrium stage, in which the intra-particle diffusion starts to slow down and level out. This situation suggested that both the boundary layer diffusion and the intra-particle diffusion were likely prominent in the transfer of dye onto the biosorbent [55,56].
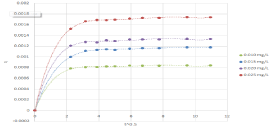
Figure 7: Intra particle diffusion mode plots.
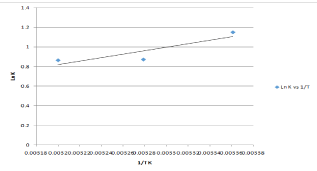
plote: ln KL versus reciprocal absolute Temperature.
Thermodynamic analysis of dye removal process
The equilibrium biosorption capacity of methylene blue onto DSSH was favored at lower temperatures. The thermodynamics constants are presented in Table 2. The equilibrium constant increased from 24.5 to 39.50C then decreased as the temperature was increased to 54.50C indicating a decrease in the biosorption capacity. In order to determine the temperature dependence of the dye removal process by DSSH, the changes in the thermodynamic parameters (free energy (ΔG*), enthalpy (ΔH*) and entropy (ΔS*)) were analyzed using the Langmuir equilibrium (KL). The following equations were used to calculate the thermodynamic parameters.
ΔG*=−RTlnKL……
lnKL=−ΔG*/RT=−ΔH*/RT+ΔS*/R………
The Van Hoff plot of ln KL as function of 1/T from 24.5 to 39.50C is shown in plot yields a straight line with a correlation coefficient of 0.782 from which ΔH* and ΔS* were calculated from the slope and intercept respectively Table 3. The negative value of ΔH* (-14.78 KJ/ mole) suggests the exothermic nature of the biosorption process. The negative entropy value of (-40.48 J/mole) and negatively decreasing value of Gibbs free energy indicate increased randomness at the solid/ liquid interface during the biosorption process while low value of ΔS indicates that no remarkable change on entropy occurs [57-60].
    Temp. (oC)
    KL
    ∆G*  (kJ/mol)
    ∆H* (kJ/mol)
    ∆S* (j/mol


    24.5
    3.16
    -2.85


    32
    2.40
    -2.22


    39.5
    2.38
    -2.25
    -14.78
    -40.48


    47
    2.01
    -1.85


    54.5
    2.57
    -2.57
Table 3:  Thermodynamic parameters from Langmuir constant (KL) for the
biosorption of MB onto DSSH at various Temperature.
Conclusions
The present study investigated the biosorption of methylene blue by dried sunflower seed hull from aqueous media. The kinetic data fit well with the pseudo-second-order model. The biosorption equilibrium was described by the Dubinin-Radushkevich isotherm model well. The values of ΔG° declared the spontaneous nature of dye biosorption. It was concluded that DSSH could be used as a promising alternative for methylene blue removal from aqueous solutions.
References
- Vieira AP, Santana SA, Bezerra CW, Silva HA, Chaves JA, Melo JC, et al. Removal of textile dyes from aqueous solution by babassu coconut epicarp (Orbignya speciosa). Chemical Engineering Journal. 2011; 173: 334-340.
- Sun L, Wana S, Luo W. Biochars prepared from anaerobic digestion residue, palm bark, and eucalyptus for adsorption of cationic methylene blue dye: Characterization, Equilibrium, and Kinetic studies. Bioresource Technology. 2013; 140: 406-413.
- El Haddad M, Regti A, Laamari MR, Slimani R, Mamouni R, Antri SE, et al. Calcined mussel shells as a new and eco-friendly biosorbent to remove textile dyes from aqueous solutions. Journal of Taiwan Institute of Chemical Engineers. 2014; 45: 533-540.
- Lee JW, Choi SP, Thiruvenkatachari R, Shim WG, Moon H. Evaluation of the performance of adsorption and coagulation processes for the maximum removal of reactive dyes. Dyes Pigments. 2006; 69: 196-203.
- Sadaf S, Bhatti H, Nausheen S, Noreen S. Potential use of low-cost lignocellulosic waste for the removal of direct violet 51 from aqueous solution: Equilibrium and Breakthrough studies. Arch Environ Contam Toxicol. 2014; 66: 557-571.
- Ghaedi M, Ansari A, Habibi M, Asghari A. Removal of malachite green from aqueous solution by zinc oxide nanoparticle loaded on activated carbon: kinetics and isotherm study. Journal of Industrial and Engineering Chemistry. 2014; 20: 17-28.
- Sadaf S, Bhatti H. Evaluation of peanut husk as a novel, low cost biosorbent for the removal of Indosol Orange RSN dye from aqueous solutions: batch and fixed bed studies. Clean Technologies Environmental Policy. 2014a; 16: 527-544.
- Otero M, Rozada F, Calvo L, Garcıa A, Moran A. Kinetic and equilibrium modelling of the methylene blue removal from solution by adsorbent materials produced from sewage sludges. Biochemical Engineering Journal. 2003; 15: 59-68.
- Chung KT, Stevens SE, Cerniglia CE. The reduction of azo dyes by the intestinal microflora. Crit Rev Microbiol. 1992; 18: 175-190.
- Roosta M, Ghaedi M, Daneshfar A, Darafarin S, Sahraei R, Purkait M. Simultaneous ultrasound-assisted removal of sunset yellow and erythrosine by ZnS: Ni nanoparticles loaded on activated carbon: optimization by central composite design. Ultrasonics Sonochemistry. 2014; 21: 1441-1450.
- Ezechi EH, Kutty SRM, Malakahmad A, Isa MH. Characterization and optimization of effluent dye removal using a new low cost adsorbent: Equilibrium, kinetics and thermodynamic study. Process Safety and Environmental Protection. 2015; 98: 16-32.
- Tan BH, Teng TT, Omar A. Removal of dyes and industrial dye wastes by magnesium chloride. Water Research. 2000; 34: 597-601.
- Al-Bastaki N. Removal of methyl orange dye and Na2SO4salt from synthetic waste water using reverse osmosis. Chemical Engineering Process Intensification. 2004; 43: 1561-1567.
- Karcher S, Kornmüller A, Jekel M. Anion exchange resins for removal of reactive dyes from textile wastewaters. Water Research. 2002; 36: 4717-4724.
- Lee DW, Hong WH, Hwang KY. Removal of an organic dye from water using a predispersed solvent extraction. Seperation Science and Technology. 2000; 35: 1951-1962.
- Konsowa A. Decolorization of wastewater containing direct dye by ozonation in a batch bubble column reactor. Desalination. 2003; 158: 233-240.
- Ravikumar K, Deebika B, Balu K. Decolourization of aqueous dye solutions by a novel adsorbent: application of statistical designs and surface plots for the optimization and regression analysis. Journal of Hazardous Materials. 2005; 122: 75-83.
- Asfaram A, Ghaedi M, Hajati S, Goudarzi A, Bazrafshan AA. Simultaneous ultrasound-assisted ternary adsorption of dyes onto copper-doped zinc sulfide nanoparticles loaded on activated carbon: optimization by response surface methodology. Spectrochimca Acta Part A: Molecular and Biomolecular Spectroscopy. 2015; 145: 203-212.
- Al-Degs YS, El-Barghouthi MI, El-Sheikh AH, Walker GM. Effect of solution pH, ionic strength, and temperature on adsorption behavior of reactive dyes on activated carbon. Dyes Pigments. 2008; 77: 16-23.
- Ho YS, McKay G. Batch lead (II) removal from aqueous solution by peat: equilibrium and kinetics. Process Safety and Environmental Protection. 1999; 77: 165-173.
- Elemen S, Akoca A, Kumbasar EP, Yapar S. Modeling the adsorption of textile dye on organoclay using an artificial neural network. Dyes Pigments. 2012; 95: 102-111.
- Sadaf S, Bhatti HN. Batch and fixed bed column studies for the removal of Indosol Yellow BG dye by peanut husk. Journal of the Taiwan Institute of Chemical Engineers. 2014b; 45: 541-553.
- Nawaz S, Bhatti HN, Bokhari TH, Sadaf S. Removal of Novacron Golden Yellow dye from aqueous solutions by low-cost agricultural waste: batch and fixed bed study. Chemistry and Ecology. 2014; 30: 52-65.
- Özacar M, Sengil IA. Adsorption of metal complex dyes from aqueous solutions by pine sawdust. Bioresource Technology. 2005; 96: 791-795.
- Faizal AM, Kutty SRM, Ezechi EH. Modelling of Adams–Bohart and Yoon–Nelson on the removal of oil from water using microwave incinerated rice husk ash (MIRHA). Applied Mechanics and Materials. Trans Tech Publication. 2004; 788-791.
- Kutty S, Ezechi E, Khaw S, Lai C, Isa M. Evaluation of copper removal using MIRHA as an adsorbent in a continuous flow activated sludge system. Water Pollution. 2014; 182: 233.
- Hasnain Isa M, Siew Lang L, Asaari FA, Aziz HA, AzamRamli N, Dhas JPA. Low cost removal of disperse dyes from aqueous solution using palm ash. Dyes Pigments. 2007; 74: 446-453.
- Oguntimein G, Hunter J, Kang D. Biosorption of azure dye with sunflower seed hull: Estimation of Equilibrium, thermodynamic and kinetic parameters. International Journal of Engineering Research and Development. 2014; 10: 26-41.
- Trotter WK, Doty, Jr HO, Givan WD, Lawler JV. Potential for Oil seed sunflowers in the United States. US Department of Agriculture Economic Research Service. 1973; 237.
- National Agricultural Statistics Service (NASS), 2012. Acreage report. Agricultural Statistics Board, United States Department of Agriculture (USDA). 2012.
- FAO United Nation Food and Agricultural Organization. Major food and Agricultural commodities and producers. FAO. 2005.
- North Dakota Agricultural Experiment Station (NDAES) and North Dakota State University Extension Service. Sunflower Production. Extension Publication. 2007; 1331.
- Oguntimein GB. Biosorption of Dye from Textile Wastewater Effluent onto Alkali Treated Dried Sunflower Seed Hull and Design of a Batch Adsorber. Journal of Environmental Chemical Engineering. 2015; 3: 2647-2661.
- Safa Y, Bhatti HN. Kinetic and Thermodynamic modelling for the removal of direct Red -31 and Direct Orange-26 dyes from aqueous solutions by rice husk. Desalination. 2011; 272: 313-322.
- Gao J, Kong D, Wang Y, Wu J, Sun S, Xu P. Production of Mesoporous Activated Carbon from Tea Fruit Peel residues and its evaluation of Methylene blue removal from Aqueous Solutions. BioResources. 2013; 8: 2145-2160.
- Lim LBL, Priyantha N, Tennakoon DTB, Chieng HI, Dahri MK Suklueng M. Breadnut peel as a highly effective low-cost biosorbent for methylene blue: Equilibrium, thermodynamic and kinetic studies. Arabian Journal of Chemistry. 2014.
- Ebrahimi A, Arami M, Bahrami H, Pajouotan E. Fish bone as a low cost adsorbent for dye removal from wastewater: Response Surface Methodology and classical method. Environmental Modeling and Assessment. 2013; 18: 661-670.
- De Oliveira Brito SM, Andrade HMC, Soares LF, De Azevedo RP. Brazil nut shell as a new biosorbent to remove methylene blue and indigo carmine from aqueous solutions. Journal of Hazardous Materials. 2010; 174: 84-92.
- Ozdemir S, Bekler FM, Okumus V, Dundar A, Kilinc, E. Biosorption of 2, 4-D, 2, 4,-DP, and 2, 4-DB from aqueous solution by using Thermophilic Anoxyybacillus Flavithermus and analysis by high performance thin layer chromatography: Equilibrium and kinetic studies. Environ. Prog. Sustain. Energy. 2012; 31: 544-552.
- Subbaiah MV, Vijaya Y, Subba Reddy A, Yuvaraja, G, Krishnaiah A. Equilibrium, kinetics and Thermodynamics studies on the biosorption of Cu (II) onto Trametes versicolor biomass. Desalination. 2011; 276: 310-316.
- Kiran I, Akara T, Safa Ozcan A, Ozcan A, Tunali S. Biosorption kinetics and isotherm studies of Acid Red 57 by dried Cephalosporium aphidicola from aqueous solutions. Biochemical Engineering Journal. 2006; 31: 197-203.
- Akar ST, Safa Ozcan A, Akara T, Ozcan A, Kaynak Z. Biosorption of a reactive textile dye from aqueous solutions utilizing an agro-waste. Desalinization. 2009; 249: 757-761.
- Kannan N, Sundaram MM. Kinetics and mechanism of removal of methylene blue by adsorption on various carbons- a comparative study. Dye and Pigments. 2001; 51: 25-40.
- Ho YS, McKay G. Sorption of dye from aqueous solution by peat. Chemical Engineering Journal. 1998; 70: 115-124.
- Freundlich HMF. Uber die adsorption in losengun. 1906; 57: 385-470.
- Langmuir I. The adsorption of gases on plane surfaces of glass, mica and platinum. JACS. 1908; 40: 1362-1403.
- Dubinin MM, Raduskhevich LV. The equation of the characteristic curve of the activated charcoal. Proc Acad Sci Phys Chem Sec. 55: 331 -337.
- Foo KY, Hameed BH. Insights into the modeling of adsorption isotherm systems. Chemical Engineering Journal. 2010; 156: 2-10.
- Tounsadi H, Khalidi A, Abdennouri M, Barka N. Journal of Environmental Chemical Engineering. 2015; 3: 822-826.
- Rangabhashiyam S, Anu N, Giri Nandagopal MS, Selvaraju NJ. Journal of Environmental Chemical Engineering. 2014; 2: 398-405.
- Helfferich F, McGraw-Hill. Ion Exchange. New York. 1962.
- Onyango MS, Kojima Y, Aoyi O, Bernardo EC, Matsuda H. Adsorption equilibrium modeling and solution chemistry dependence of fluoride removal from water by trivalent-cation-exchanged zeolite F-9. Journal of Colloids and Interface Science. 2004; 279: 341-350.
- Benyoucef S, Amrani M. Adsorption of phosphate ions onto low cost Aleppo pine adsorbent. Desalination. 2011; 275: 231-240.
- Witek-Krowiak A, Szafran RG, Modelski S. Biosorption of heavy metals from aqueous solutions onto peanut shell as a low cost biosorbent. Desalination. 2011; 265: 126-134.
- Xu S, Zhang S, Chen K, Han J, Liu H, Wu K. Biosorption of La3+and Ce3+by agrobacterium sp HN. Journal of Rare Earth Metals. 2011; 29: 265-269.
- Deniz F. Dye removal by almond shell residues: Studies on biosorption performance and process design. Material Sci Eng C Mater Biol Appl. 2013; 33: 2821-2826.
- Debnath, Ghosh. Kinetics, isotherm and thermodynamics for Cr (III) and Cr (IV) adsorption from aqueous solutions by crystalline hydrous titanium oxide. 2008.
- Kumar KV, Sivanesan S, Ramamurthi V. Adsorption of malachite green onto Pithophora p., a fresh water algae: Equilibrium and kinetic modeling. Process Biochemistry. 2005; 40: 2865-2872.
- Wang B, Hu Y, Xie L, Peng K. Biosorption behavior of azo dye by inactive CMC immobilized Aspergillus fumigatus beads. Bioresource Technology. 2008; 99: 794-800.
- Akar T, Safa Ozcan A, Tunali S, Ozcan A. Biosorption of a textile dye (Acid Blue 40) by cone biomass of Thuja orientalis: Estimation of equilibrium, thermodynamic and kinetic parameters. Bioresource Technology. 2008; 99: 3057-3065