
Special Article - Abdominal Aortic Aneurysms
Austin J Vasc Med. 2016; 3(1): 1014.
Correlation between Hemodynamic Stresses and Morphometric Indices as a Predictor Potential of Abdominal Aortic Aneurysm Rupture
Vilalta-Alonso JA1, Soudah-Prieto E2, Nieto- Palomo F3,4,7, Lipsa L3,7, Perez-Rueda MA4,7, Lopez-Aguilar BM1, Vaquero-Puerta C5,7 and Vilalta-Alonso G6,7*
1Department of Industrial Engineering, Instituto Superior Politécnico José Antonio Echeverria (Cujae), Cuba
2International Center for Numerical Methods in Engineering (CIMNE), Technical University of Catalonia, Spain
3Department of Mechanical Engineering, CARTIF Technological Center, Spain
4Department of Mechanical Engineering, University of Valladolid, Spain
5Angiology and Vascular Surgery Service, Clinic Hospital and University of Valladolid, Spain
6Department of Thermal Sciences and Fluid, Federal University of Sao Joao del-Rei, Brazil
7Institute for Advanced Production Technologies (ITAP), University of Valladolid, Spain
*Corresponding author: Vilalta-Alonso G, Thermal Sciences and Fluids Department, Federal University of Sao Joao del-Rei, Praca Frei Orlando 170, Centro, Sao Joao del-Rei, Brazil
Received: December 12, 2015; Accepted: January 29,2016; Published: February 01, 2016
Abstract
Nowadays, there is consensus that current criteria to assess the abdominal aortic aneurysm rupture risk (maximum transverse diameter and growth rate) cannot be considered as reliable indicators. Therefore, accurate prediction of the AAA rupture risk is one of the main challenges that vascular surgeon face up today. Taking into account the physical principle governing this complex phenomenon, i.e, the rupture it is associated with the balance between internal forces exerted by blood flow on artery wall aneurysm and their ability to withstand it, it is expected that relationship between hemodynamic stresses and aneurysm morphology can shed light on defining some rupture risk indices. To assess potential correlations between the main geometric parameters characterizing the AAA and hemodynamic stresses, in order to improve the insight about the rupture phenomenon, thirteen models of unruptured AAA have been reconstructed from patient-specific CT data. It has been made using a noninvasive user defined algorithm, which has been developed by using MeVisLab software. For the geometric characterization, twelve shape and size quantitative indices based on the lumen centreline were defined and computed by using VMTK software. The calculation of the temporal and spatial distributions of hemodynamic stress has been carried out by means of Tdyn, software based on Computational Fluid Dynamics. Pearson correlation coefficient has been used to evaluate the relationships between the hemodynamic stresses and the geometric indices here defined. Statistical analysis has confirmed that the length, asymmetry and the saccular index affect hemodynamic stresses. These results highlight the potential of statistical techniques to assess the significant geometric parameters for the hemodynamic stresses prediction and their relevance for obtaining a rupture risk predictor.
Keywords: AAA; Statistical techniques; Morphology; Rupture risk; Peak wall shear stress; Peak intraluminal pressure
Abbreviations
AAA: Abdominal aortic Aneurysm; CFD: Computational Fluid Dynamics; PWS: Peak Wall Stress; RPI: Rupture Potential Index; ILT: Intraluminal Thrombus; DICOM: Digital Imaging and Communications in Medicine; CT: Computed Tomography; VMTK: Vascular Modelling Tool Kit; STL: Stereo Lithography; FEM: Finite Element Method; WSS: Wall Shear Stress; PWSS: Peak Wall Shear Stress; PIP: Peak Intraluminal Pressure; FSI: Fluid-Solid Interaction
Introduction
Abdominal Aortic Aneurysm (AAA) is a localized and irreversible dilation of the abdominal aorta resulting from a multifactorial process that culminates in an irreversible pathological remodeling of the aortic wall. The overall result is a gradual imbalance between synthesis and degradation of tissue constituents leading to the loss of structural integrity of the aortic wall modifying the mechanical properties of arterial wall. Nowadays, the current clinical management of rupture risk is based on geometrical indices: transversal maximum diameter and diameter growth rate [1,2]. However, the use of these parameters as a guide to making decisions about the appropriate treatment in aneurismatic patients has faced strong challenge because of its inability to accurately predict rupture for all AAAs [3-5]. The AAA morphometry is recognized as a rupture predictor because determines the spatial-temporal distribution of hemodynamic stress and the aneurysm rupture is a manifestation of the balance between the forces exerted by the blood (the hemodynamic stresses) on the arterial wall and their ability to withstand these forces. Based on that, others mechanics-based indices have been proposed as improved predictors of AAA rupture: aneurysm asymmetry, effect of intraluminal thrombus, wall stiffness and thickness saccular index, mechanical stress [6-8]. Some of these indices have been more successful than others due to the difficulty for extracting in vivo and non-invasive information, difficulting its implementation in daily clinical management. Also, as these indices do not consider, for example, biological factors they have not been fully correlated with the pathogenesis of AAA.
In this sense and taking into consideration the physical principle governing the aneurysm rupture phenomenon, as mentioned above, a new approach is being proposed. This approach relies on determine the relations between the hemodynamic stresses (wall shear stress + intraluminal pressure) and the aneurysm morphology. Recent work [9] has reported the correlation between the AAA morphology defined by five geometrical parameters and the hemodynamic stresses. The authors highlight the strong relation between the intraluminal pressure and two shape indices: deformation rate and saccular index. The peak wall shear stress is better correlated with aneurysm length.
From these initial results, the present work follow the main idea of this approach trying to find how the AAA morphology correlate with the hemodynamic stresses acting on arterial wall. To do that, the aneurysm morphology was defined by mean of twelve shape and size indices and thirteen patient-specific AAA were utilized.
We hypothesize that the results obtained by using this new approach will allow, in future steps and with more theoretical basics, to face the accurate identification of rupture risk, which will improve the clinical management of aneurismatic patients.
Materials and Methods
AAA geometric
The procedure for AAA reconstruction consists in the following steps:
- Segmentation of the lumen of the AAA’s surface and geometric reconstruction
- Morphological characterization
The images stored in the files with. DICOM extension (the standardized type of file for medical images) were processed by using the MeVisLab® and Vmtk software, which are a multi-platform set of applications, specific for the medical images processing and visualization.
Lumen segmentation of the AAA surface and geometric reconstruction: To obtain the segmentation of the lumen we use a semi-automatic method executed with VMTK software where it is necessary to use CT scanning procedure that involves use of contrast medium.
The semi-automatic method is quite easy for the user, who has to select just two internal points in the lumen. The abdominal images were segmented from CT DICOM images combining two different segmentation procedures; thresholding and level set method (based on snakes). Thresholding is a nonlinear operation that converts a gray-scale image into a binary image where the two levels are assigned to pixels that are below or above the specified threshold value. The image snake operation creates or modifies an active contour/snake in a grey scale image. The operation iterates to minimize the snake’s energy which consists of multiple components including the length of the snake, its curvature, and image gradient.
Once obtained the segmentation of the lumen and of the external surface of the AAA, a smoothing process is applied through specific algorithms of the VMTK and MeVisLab software and it is stored in STL format. (Figure 1) shows the workflow used in the present work to AAA segmentation.
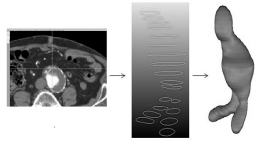
    Figure 1:  Workflow representing the 3D AAA segmentation of the lumen and
of the AAA surface through the annual method.
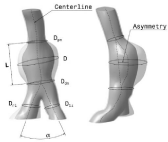
    Figure 2:  Schematic representation of the mean AAA geometric parameters
based on lumen center line.
Morphological characterization: Thirteen patients withinfrarenal aneurysm on follow up treatment at Clinical Hospital of Valladolid (Spain) were included in this study. The patients chosen for this study were randomly selected with different sized AAAs, in order to cover the different stages of the pathology. However, strategically, the AAAs was selected on its first phase of development, the smaller one.
To characterize the AAA shape and size, the geometrical AAA parameters were determined by means of user-defined algorithm based on lumen centerline. The premise adopted in the present work is that all size and shape indices could be calculated, in easily way, from the simplest geometrical parameters in the segmented CT images. Twelve size and shape indices were defined and computed for thirteen AAA patient-specific segmented and reconstructed models. (Figure 2) shows some of these parameters.
Seven size indices have been defined. The size indices represent those parameters that better describe and define the AAA size, that is, its morphometry. They are sorted in two kinds. 1D indices (in mm) and 3D index (in mm3).
The 1D size indices are defined as follows: Maximum Transverse Diameter (D), Neck Proximal Diameter (Dpn: smallest diameter of the infrarenal artery, just before the AAA) and Neck Distal Diameter (Ddn: smallest diameter of the aorta, just after the AAA), Aneurismal Length (L: length between proximal and distal necks), Left Iliac Diameter (Dii: left iliac diameter), Right Iliac Diameter (Dri: right iliac diameter). The 3D size index defined is the volume of the AAA sac (VAAA).
The shape indices characterize the morphology of AAA. It has been defined five shape indices, which were sorted in 2D and 0D indices.
The four 2D indices are: saccular index (γ: assesses the length of the AAA region, which is the region, affected by the formation and further development of the aneurysm. It is determined by the relationship between D and L), deformation rate (χ: characterizes the actual deformation of the aorta, therefore it constitutes a relation between the proximal neck diameter, Dpn, and the maximum diameter of the aneurysm, D), tortuosity (T: is the arc-chord ratio: the ratio of the length of the curve to the distance between the ends of it) and asymmetry (e: it is the result of the non-symmetry expansion of the aneurysm sac as a result of the expansion constraints introduced by the proximity to the spinal column. To calculate the asymmetry it is created a union line between the points generated by the centerline intersection with the proximal and distal neck sketches. The asymmetry is the distance between the points of intersection of this line and the centerline with the AAA maximum diameter sketch).
The 0D shape index is the bifurcation angle (a: angle between right and left iliac artery).
The quantification of the shape and size of patient-specific AAA has several benefits. Based on these indices and the wide clinical empirical evidence, there are several criteria to AAA ranking. However, at the moment, there is no clinical consensus to use it. (Table 1a, 1b & Table 2), show the values obtained for size and shape indices, respectively, for the thirteen patients in present study.
    Patient
    D
      (mm)
    Dpn
      (mm)
    Ddn
      (mm)
    L
      (m)
    Dli
      (mm)
    Dri
      (mm)


    1
    30,34
    19,77
    23,36
    80,42
    14,74
    12,50


    2
    33,07
    26,91
    29,70
    82,71
    15,73
    17,62


    3
    42,96
    20,90
    17,82
    102,19
    12,22
    11,85


    4
    41,39
    24,53
    33,56
    94,23
    18,27
    12,32


    5
    34,80
    20,88
    30,35
    109,71
    20,23
    15,16


    6
    33,51
    20,53
    23,92
    114,88
    15,50
    13,01


    7
    40,05
    32,18
    34,86
    104,16
    23,43
    15,67


    8
    50,99
    24,23
    39,33
    105,47
    14,81
    21,45


    9
    37,28
    23,45
    24,28
    89,19
    11,44
    11,45


    10
    40,88
    25,60
    25,90
    80,38
    9,90
    11,18


    11
    42,23
    22,02
    30,15
    85,50
    21,63
    19,94


    12
    29,81
    20,71
    19,00
    92,39
    15,70
    11,88


    13
    37,52
    33,39
    21,66
    99,12
    12,20
    14,80
Table 1 a: Morphological characterization of each AAA used in this study. Size
indices: a) 1D indices, b) 3D indices.
    Patient
    VAAA (mm3)


    1
    49223,2


    2
    43623,0


    3
    51862,0


    4
    55935,0


    5
    44386,1


    6
    32740,0


    7
    40608,0


    8
    83186,0


    9
    46676,0


    10
    45780,0


    11
    43130,0


    12
    30538,0


    13
    51388,0
Table 1 b:
    Patient
    g (-)
    c (-)
    T (-)
    e (-)


    1
    0,37727
    1,5335
    0,0389
    0,460


    2
    0,39983
    1,229
    0,0222
    0,600


    3
    0,42040
    2,056
    0,0140
    0,769


    4
    0,43924
    1,687
    0,0308
    0,529


    5
    0,31720
    1,667
    0,0660
    0,490


    6
    0,29169
    1,632
    0,0147
    0,380


    7
    0,38450
    1,245
    0,0383
    0,430


    8
    0,48345
    2,104
    0,0445
    0,748


    9
    0,41798
    1,590
    0,0645
    0,573


    10
    0,50858
    1,597
    0,0817
    0,642


    11
    0,49392
    1,918
    0,0409
    0,709


    12
    0,32265
    1,439
    0,0655
    0,505


    13
    0,37853
    1,124
    0,0343
    0,755
Table 2 a:  Morphometrical characterization of each AAA used in this study. Shape
indices: a) 2D indices, b) 0D index.
    Patient
    a (-)


    1
    56,70


    2
    57,20


    3
    50,62


    4
    66,27


    5
    61,87


    6
    64,33


    7
    54,67


    8
    43,01


    9
    38,67


    10
    27,56


    11
    48,96


    12
    43,77


    13
    40,58
Table 2 b:
Blood flow model and boundary conditions
After AAA segmentation, we get a 3D volume image useful to create a 3D computational model to analyze the blood flow behavior inside the AAA using CFD. A mesh sensitivity analysis was performed to ensure the accuracy of the simulations using steady test. Depending on the complexity of the AAA model, a 3D mesh consisted of 2.000.000-2.500.000 tetrahedral elements. Using the isosurface stuffing algorithm [10,11], we have obtained a smooth element and an aspect ratio for the whole of the meshes higher than 0.9 (ideal ratio = 1).
In this section we will limit to the essential description of mathematical considerations used in this work. We consider blood as a homogeneous, incompressible, constant-density of 1040 kg/m3 and Newtonian fluid with constant viscosity of 0,004 Pa.s. Vessels walls are modeled as non-permeable, rigid walls.
This choice was motivated by the fact that the patient-specific physiological parameters characterizing the arterial mechanical behavior of the AAA wall are difficult to estimate. The inlet velocity waveform was obtaining from quantitative measurements in the abdominal region. A transient blood flow was imposed in the abdominal aorta (approximately above the infra renal arteries). The velocity was calculated for each patient in order to obtain a total volumetric flow rate of 350 ml for an entire cardiac cycle [12]. The outlet boundaries were located at the common iliac arteries where the pressure follows pulsatile waveforms.
CFD analysis was performed using BioDyn [13], a friendly userinterface based on the commercial software Tdyn [14]. Tdyn is a fluid dynamics and multi-physics simulation environment based on the stabilized Finite Element Method that solved the Navier- Stokes equations. We start the simulation with 50 initial steps in order to stabilize the initial condition solution. Time integration method chosen was a Backward Euler, using a Bi Conjugate Gradient Non-symmetric solver in order to accelerate the calculation time performance. A pressure stabilization of 4th order and automatic velocity advection stabilization was used [15]. For each AAA the results analyzed were wall shear stress and the intraluminal pressure over the aneurysmatic sac and the velocity, obtained from the third cardiac cycle.
Statistical analyses
Pearson correlation coefficient was used to assess the correlation between the hemodynamic stresses (peak wall shear stress and peak intraluminal pressure) and predefined geometric indices (size and shape indices), as potential predictors of AAA rupture risk. The decision to use the aforementioned coefficient was based on the advantage posed by metric scale of the considered variables. Tested hypotheses also supported the statistical significance of the correlations (p-value = 0, 10 was considered significant). A software package, Minitab for Windows, release 17.0, standard version, was used to obtain these results.
Results
Relationships between geometrical indices and hemodynamic stresses
A total of 13 AAA models were simulated for this study. The correlation study and the results presented here, are based on obtaining the correlation coefficient of Pearson (r) and the execution of its corresponding test of hypothesis (H0: ?=0) to determine their statistical significance. To assess the correlation between hemodynamic stresses and AAA morphological indices, the p values were considered and scatter plots were analyzed looking for more accurate rates.
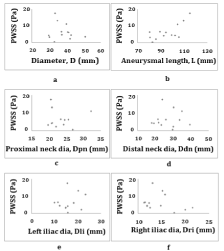
    Figure 3:  PWSS versus 1D indices. Figure 3: a) PWSS vs D, b) PWSS vs L,
c) PWSS vs Dpn, d) PWSS vs Ddn, e) PWSS vs Dli, f) PWSS vs Dri.
The PWSS values ranged between 0,414 and 17,60 Pa, and its mean value was 6,38 Pa. The PIP values ranged between 15815 and 16565 Pa, and its mean value was 16185 Pa. The highest correlations were observed between PWSS and aneurismal length (L), asymmetry (e) and saccular index (γ and also between PIP and aneurismal length (L), right iliac diameter (Dri), asymmetry (e) and saccular index (γ).
The most important results are presented.
Size indices
Peak wall shear stress (PWSS) versus 1D indices: The relationships between PWSS and the different 1D indices are illustrated in (Figure 3). A correlation assessment of the PWSS with these indices resulted in the following statistical parameter: L (r=0.722, p=0.005). The positive value of the correlations indicates that greater PWSS values are associated with higher L and vice versa. The rest of the geometric indices do not correlate significantly with PWSS. However, striking result is the lack of correlation between PWSS and D (r=-0.17, p=0.578). The maximum diameter is one of the main geometric parameters used to predict the rupture. All these conclusions are supported by scatter plots.
Peak intraluminal pressure vs 1D indices: The relationships between PIP and the different 1D indices are illustrated in (Figure 4). The PIP was best correlated with L (r=0.56, p=0.049) and the Dri (r=-0.5, p=0.08), which is significant at 10%. The positive value of the correlations indicates that greater PIP values are associated with higher L and vice versa and the negative value indicates that greater values of PIP are associated with lower Dri. However, the correlation of the PIP with the D was no significant (r=-0.088, p=0.775). The study of graphics corroborates these results.
Peak wall shear stress vs 3D indices: The relationship between PWSS and the 3D index is illustrated in (Figure 5), PWSS vs VAAA.
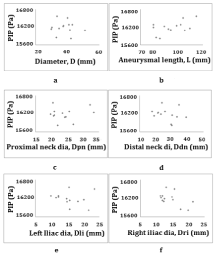
    Figure 4:  PIP versus 1D indices. Figure 4: a) PIP vs. D, b) PIP vs. L, c) PIP
vs. Dpn, d) PIP vs. Ddn, e) PIP vs. Dli, f) PIP vs Dri.
Figure 5: PWSS versus 3D index.
Figure 6: PIP versus 3D index.
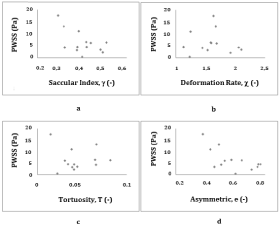
    Figure 7:  PWSS versus 2D indices. Figure 7: a) PWSS vs Saccular index
(γ), b) PWSS vs Deformation rate (χ), c) PWSS vs Tortuosity (T), d) PWSS
vs Asymmetry (e).
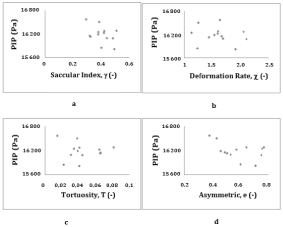
    Figure 8:  PIP versus 2D indices. Figure 8: a) PIP vs. Saccular index (γ), b)
PIP vs Deformation rate (χ), c) PIP vs Tortuosity (T), d) PIP vs Asymmetry (e).
This geometric parameter does not correlate significantly with PWSS.
Peak intraluminal pressure vs 3D indices: The relationship between PIP and the 3D index is illustrated in (Figure 6), PIP vs VAAA. The PIP does not correlate significantly with this parameter.

Figure 9: PWSS versus 0D index. Figure 9) PWSS vs. bifurcation angle (a).

Figure 10: PIP versus 0D index. Figure 10, PIP vs bifurcation angle (a).
Shape indices
Peak wall shear stress vs 2D indices: The relationships between PWSS and the different 2D indices are illustrated in (Figure 7). A significant negative correlation was observed between PWSS and saccular index (r=-0.579, p=0.038) and between PWSS and asymmetry (r=-0.64, p=0.019). The negative values indicate that greater values of PWSS are associates with lower asymmetry and saccular index.
Peak intraluminal pressure vs 2D indices: The relationships between PIP and the different 2D indices are illustrated in (Figure 8). The PIP is correlated with saccular index (r=-0.486, p=0.1) and with asymmetry (r=-0.501, p=0.09), which are significant at 10%.
Peak wall shear stress vs 0D index: The relationship between PWSS and the 0D index is illustrated in (Figure 9). These geometric parameters do not present significant correlations with PWSS.
Peak intraluminal pressure (PIP) vs 0D index: The relationship between PIP and the 0D index is illustrated in (Figure 10). The PIP does not correlate significantly with this parameter.
Discussion
Behavior of the blood flow within aneurismatic sac
The prevailing a etiology hypothesis is that AAA results from the coupling between structural changes in inner layers of the arterial wall and disturbed patterns of hemodynamics stresses acting on the vessel wall. As presented in previous works [16-18], it has been shown that the so-called disturbed flow conditions, that develop within the AAA, such as rapid decrease in the velocity and regions of very high (or low) hemodynamic stresses gradients, may all contribute in different ways to the vascular disease, primarily via their effects on the endothelium. Today, it is well established the behavior of the blood flow within the aneurysmatic sac. The mechanical stress is considered a fundamental parameter in the rupture risk prediction assessment, but has some limitation associated to clinical management. The statistical prediction could facilitate the determination of a numerical index to predict the rupture risk, quickly and with sufficient precision to be clinically relevant.
Size indices
The most significant results related to size indices are discussed below.
The main significant result is about the non-correlation between PWSS and D. We hypothesize that the result is coherent with the adopted strategy in the research. 70% of the assessed aneurysms have D < 40mm, therefore they can be considered as small aneurysms and consequently do not exist rupture risk in the next months. In all cases, PWSS values are smaller than the threshold value of Von Misses stress (criterion characterizing the material failure) of 20 N/cm2 as defined in [19]. In eleven cases the PWSS was located at anterior wall and at the distal neck. In all other cases, mainly those with higher maximum transverse diameter, the PWSS was located at the posterior AAA wall, which is consistent with the more likely place of rupture.

    Figure 11:  Morphology of some AAA, reconstructed by CT image
transformation, used in the study.
The literature reports some studies [20,21], on which are highlighted the high correlation between D, the Von Misses stress and the PWSS. In all these cases, the maximum transverse diameter is close to threshold value, which could indicate high rupture risk.
Other important simple geometrical parameter is the length of the aneurysm, L and the results here obtained show that the correlations between hemodynamic stresses and L are indicative of the weight of this variable as potential rupture risk predictor.
Shape indices
The most significant results related to shape indices are discussed below.
The saccular index (γ) reflects a very interesting ratio between two simple geometric parameters: the maximum diameter D and the length L of the aneurysm. Considering individual relationships between D and L with hemodynamic stresses above discussed, it is to be expected a significant weight of the saccular index on hemodynamic stresses prediction.
The negative correlation between γ and hemodynamic stresses is in agreed with the proposal presented in [22,23]. The hemodynamic stresses are higher when the values of γ tend to be smaller, with limit value of 0,60 [24]. In the (Table 2a, 2b), are shown the values of the saccular index corresponding to the thirteen AAA models here analyzed where it is possible to see that all of the values meet this criterion and, therefore, high mechanical load on arterial wall is to be expected.
More than the maximum diameter, D, the deformation rate (χ) has been proposed by some authors [17] as an appropriate index for rupture risk prediction, by the fact that this index take into account the real deformation of the aorta by considering the ratio between maximum diameter and proximal distal diameter. According [24,25] an AAA is in high risk of rupture (dangerous condition) when the value of χ is higher than 3,3; condition that indicates high hemodynamic stresses. The correlations here obtained show no significantly influence between deformation rate and PWSS and PIP. The apparent contradiction of the results can be justified by the fact that the values of χ for all AAAs studied are smaller than the threshold value, as shown in (table 2a).
According to our results, the correlations between the asymmetry and the hemodynamic stresses are negative, that means, those AAA with lower value of asymmetry (quantitative indicator tending to zero) have higher hemodynamic stresses. The fact that AAA are essentially asymmetric led some authors to propose this parameter as a representative morphological feature of aneurysm. The question is: Can the asymmetry, as a geometric representative, be an appropriate index for rupture risk prediction? To answer this question it is important to analyze the morphology of the aneurysm. Basically, there are two kinds of AAA: fusiform and saccular. In an autopsy study it is shown that ruptured aneurysms are more saccular than fusiform. Therefore, the extent to which an aneurysm deviates from a fusiform shape may be a good indicator of rupture risk. (Figure 11), shows some examples of aneurysm model studied in this work. Most of the AAA here studied may be considered as saccular, therefore it is to be expected they are subjected to high hemodynamic stresses, which is consistent with the correlations obtained.
The results here obtained are, in general sense, consistent with other published results and have strong theoretical basics. As pointed out by [20], it is unlikely that one of the proposed geometric indices, in isolation, would be a reliable index for rupture risk prediction and future studies can be directed to this end. The principal limitation of the results here discussed consists of the small sample size: 13 cases, in which there is high variability, in general, to represent the relationships between the parameters in study. The research group works on two aspects to improve the quality of the rupture risk prediction. The first one is the extension of the analysis (segmentation, geometric characterization of the AAA and computer simulation) to a greater number of cases in a way to make the results statistically more reliable. The second aspect is the study of bootstrap techniques to overcome the effect of the small sample size.
Conclusion
Numerical study using CFD analysis of pulsatile, incompressible, Newtonian and laminar blood flow in thirteen three-dimensional rigid models of aneurysm have been presented. The patient-specific AAA models, obtained from reconstruction of CT sets of images, were geometrically characterized by means of twelve shape and size indices which were defined based on lumen centerline. The shape and size indices were correlated with hemodynamic stresses by using statistical technique and regression analyses. Statistical analysis confirmed that the length, L, asymmetry and saccular index significantly influence PWSS and PIP, which highlight the weight of these variables on the rupture risk predictions. The result associated to the correlation between AAA maximum diameter and hemodynamic stresses could seem surprising and contradictory. No correlations were obtained as it should be expected. This finding is in agreement with the strategy adopted in the research, all AAAs are considered small with diameter less than 40 mm, and therefore the hemodynamic stresses and, consequently, rupture risk, are not significant. AAA rupture is a complex phenomenon involving a lot of factors. By the results it is possible to hypothesize that the correct and accurate characterization of AAA morphometry and its influence on the regional and temporal distribution of the hemodynamic stresses would be necessary for patient-specific assessment of rupture risk.
Statistical techniques have significant potential to be an efficient tool for improving the understanding about the phenomenon of rupture and its accurate prediction. The methodology here developed can correctly predict the hemodynamic stresses from size and shape indices. To improve the reliability of the results, now expands the number of cases in the study and is studying the possibility of applying other statistical tools that better respond to situations where the data number is small.
Changing the clinical management of this pathology is a very complex task. The use of the maximum diameter criterion is very easy to implement for the surgeon, in that the physician should simply measure the maximum diameter from CT scans. The results here obtained could be an indicative that other indices like, asymmetry, deformation rate, AAA length, saccular index, are important and could also be readily incorporated into surgeon’s decision making.
References
- Georgakarakos E, Ioannou CV, Kamarianakis Y, Papaharilaou Y, Kostas T, Manousaki E, et al. The role of geometric parameters in the prediction of abdominal aortic aneurysm wall stress. See comment in PubMed Commons below Eur J Vasc Endovasc Surg. 2010; 39: 42-48.
- Raut SS, Chandra S, Shum J, Washington CB, Muluk SC, Finol EA, et al. Biological, Geometric and Biomechanical Factors Influencing Abdominal Aortic Aneurysm Rupture Risk: A Comprehensive Review. Recent patents on Medical Imaging. 2013; 3: 44-59.
- Vorp DA. Biomechanics of abdominal aortic aneurysm. See comment in PubMed Commons below J Biomech. 2007; 40: 1887-1902.
- Fillinger MF, Raghavan ML, Marra SP, Cronenwett JL, Kennedy FE . In vivo analysis of mechanical wall stress and abdominal aortic aneurysm rupture risk. See comment in PubMed Commons below J Vasc Surg. 2002; 36: 589-597.
- Doyle BJ, David SM, Michael TW, Timothy MM. Abdominal aortic aneurysms: New approaches to rupture risk assessment. 1st edition. New York: Nova Science Publishers. 2010.
- Gasser TC, Auer M, Labruto F, Swedenborg J, Roy J . Biomechanical rupture risk assessment of abdominal aortic aneurysms: model complexity versus predictability of finite element simulations. See comment in PubMed Commons below Eur J Vasc Endovasc Surg. 2010; 40: 176-185.
- Vande Geest JP, Di Martino ES, Bohra A, Makaroun MS, Vorp DA. A biomechanics-based rupture potential index for abdominal aortic aneurysm risk assessment: demonstrative application. Ann. N. Y. Acad. Sci. 2006; 1085: 11-21.
- Bluestein D, Dumont K, DeBeule M, Ricotta J, Impellizzeri P, Verhegghe B, et al. Intraluminal thrombus and risk of rupture in patient specific abdominal aortic aneurysm - FSI modelling. Comput Methods Biomech Biomed Engin. 2009; 12: 73-81.
- Soudah E, Vilalta G, Bordone M, et al. Hemodynamic on abdominal aortic aneurysm: Parametric study (in Spanish). Rev. int. metodos numer. calc. diseno.ing. 2015; 31: 106-112.
- Soudah E, Bordone M, Perez JS. Gmed: a platform for images treatment inside GiD system, in Proceedings of the 5th Conference On advances and Applications of GiD, Barcelona, 2010, GiD-the personal pre and postprocessor.
- Lorensen WE, Cline HE, Marching cubes: a high resolution 3rd surface construction algorithm. In Proceedings of the 14th Annual Conference on Computer Graphics and Interactive Techniques (SIGGRAPH ’87). 2007; 163-169.
- Pedersen EM, Kozerke S, Ringgaard S, Scheidegger MB, Boesiger P. Quantitative abdominal aortic flow measurements at controlled levels of ergometer exercise. See comment in PubMed Commons below Magn Reson Imaging. 1999; 17: 489-494.
- Bordone M. Biodyn User Manual. TDYN: theoretical Background. COMPASSIS. 2012.
- COMPASSIS, Tdyn: Theoretical background. 2012.
- Barret R, Berry M, Chan T, James Demmel, June Donato, Jack Dongarra, et al. Templates for the Solution of Linear Systems: Building Blocks for Iterative Methods. Philadelphia, SIAM. 1994; 135.
- Scotti CM, Finol EA. Compliant biomechanics of abdominal aortic aneurysm: A fluid-structural interaction study. Computer and Structures. 2007; 85: 1097-1113.
- Vilalta G, Soudah E, Vilalta JA, et al. Prediction of the hemodynamic stresses in AAA based on its morphology (in Spanish). In proceeding of the XI Ibero-american Congress of Mechanical Engineering. 2013.
- Salsac AV, Spark S, Chomaz JM, Lasheras. Evolution of the wall shear stresses during the progressive enlargement of symmetric abdominal aortic aneurysms. J. Fluid. Mech. 2006; 560: 19-51.
- Kontopodis N, Metaxa E, Papaharilaou Y, Georgakarako, et al. Changes in the geometric configuration and biomechanical parameters of the rapidly growing abdominal aortic aneurysm may provide insight in aneurysms natural history and rupture risk. Theoretical Biology and Medical Modelling. 2013; 10: 67.
- Martufi G, Di Martino ES, Amon CH, et al. Three-dimensional geometrical characterization of Abdominal Aortic Aneurysms: Image-based wall thickness distribution. Journal of Biomechanical Engineering. 2009; 131.
- Mower WR, Baraff LJ, Sneyd J. Stress distributions in vascular aneurysms: factors affecting risk of aneurysm rupture. See comment in PubMed Commons below J Surg Res. 1993; 55: 155-161.
- Kleinstreuer C, Li Z. Analysis and computer program for rupture-risk prediction of abdominal aortic aneurysms. See comment in PubMed Commons below Biomed Eng Online. 2006; 5: 19.
- Vilalta G, Nieto F, Vaquero C, Vilalta JA, Perez MA, et al. Patient-specific clinical assessment of abdominal aortic aneurysm rupture risk based on its geometric parameters. Proceedings of the IASTED international conference Biomedical Conference-Biomed. 2011.
- Vilalta G, Nieto F, et al. Prediction for abdominal aortic aneurysm rupture risk. Method based on geometric biodeterminant (in Spanish). Dyna Ingenieria e Industria. 2012; 87: 66-73.
- Capeller WA, Engelann H, et al. Possible objectification of a critical maximum diameter for elective surgery in abdominal aortic aneurysms based on one and three dimensional ratios. J. Cardiovasc. Surg. 1997; 38: 623-628.