
Research Article
Austin J Vet Sci & Anim Husb. 2018; 5(1): 1037.
Mitochondrial Diversity and Phylogenetic Structure of Mahabadi Goat Population
Beigmohammadi S¹*, Afshari KP¹ and Seyedabadi HR²
¹Department of Animal Science, Abhar Branch, Islamic Azad University, Abhar, Iran
²Department of Animal Biotechnology, Animal Science Research Institute of IRAN (ASRI), Agricultural Research Education and Extension Organization (AREEO), Karaj, Iran
*Corresponding author: Sattar Beigmohammadi, Department of Animal Science, Abhar Branch, Islamic Azad University, Abhar, Iran
Received: February 02, 2018; Accepted: March 16, 2018; Published: March 23, 2018
Abstract
The genetic diversity and phylogenetic structure was analyzed in Mahabadi goat population by mitochondrial DNA sequences. Phylogenetic analysis was carried out using hyper variable region 1 (896bp) obtained form 30 animals. Mahabadi goat proved to be extremely diverse (average haplotype diversity of 0.999) and the nucleotide diversity values 0.022. A total of 30 Mahabadi goats were grouped into six haplotypes and the large majority of haplotypes were present in 15 animals. All Mahabadi haplotypes were classified into a haplogroup and revealed remarkably high genetic distances within the population when compared with other Asian goat populations, indicating high genetic variation in the Mahabadi goat. These results indicate high- divergence status of the Mahabadi goat and will influence breeding and conservation strategies adopted for this breed.
Keywords: Genetic diversity; Marghoz goat; mtDNA; phylogenetic
Introduction
The mitochondrial DNA (mtDNA) polymorphism, especially the displacement loop (D-loop) region, has been largely applied to understand phylogenetical relationships in many animal species, including cattle [1], pig [2], sheep [3], chicken [4], horse [5] and goat [6-8]. Previous studies on domestic goats identified at least four major mtDNA lineages [9-11]. Lineage A is the most diverse and widely distributed across all continents. Lineage B is confined to eastern and southern Asia, including Mongolia, Laos, Malaysia, Pakistan and India. Lineage C is present in low frequencies in Mongolia, Switzerland, Slovenia, Pakistan, India and Iran.
Finally, lineage D is rare and only observed in Pakistani and Indian local goats [12]. The time since divergence among these four lineages (more than 200000 years ago) far pre-dated the time of domestication around 10000 years ago [9-11]. The control region (D-loop) is the most variable and non-coding portion of the mitochondrial genome [13]. This region controls the mitochondrial DNA (mtDNA) replication by regulating the activities of various enzymes and proteins that are coded by the nuclear genes [14]. The sequences of the control region vary greatly in different mammalian species, however, preservation of several conserved regions indicate fundamental harmony in its function [15]. It contains the origin of heavy strand and the promoters for the light and heavy strand replication [16]. Because of their rapid evolution [17], the control region sequences are valuable for investigating the genetic diversity and evolutionary relationships among species [13]. The extent and pattern of genetic variability in livestock species will contribute to the conservation of livestock genetic resources. On the basis of the previously mentioned archaeological studies and bio-geography, it is likely that the molecular studies of diversity in Iranian goats will yield new understanding of the origin and process of goat domestication, and will contribute to the resolution of goat phylogeny. More than 20 breed of goats have been recognized in Iran but only breeds namely Marghoz and Raeni produces attractive and expensive Mo-hair and Kashmir fiber. These small breeds of goat are distributed over the western and north-west of Iran near to the Turkey and Iraqi borders. Marghaz goats are fertile animals with twin kidding over 30% [18]. It is believed the Angora goats are originated from this breed [18].
Angora goats appear in one color which is white to silver, but Mahabadi goats produce mohair in different natural colors which are a unique character of this breed. Keeping above in view in present study, the current phylogenetic status and genetic diversities of Mahabadi goat has been investigated in order to understand the genetic basis of this breed.
Phylogenetic reconstruction
The sequences obtained were compared by alignment to the international Gene Bank data-base in 1 Chinese (KM 360063), 1 Switzerland (KR059147), 1 Italy (KR059205), 1 Jordan (KR059160), 1 Iran (KR059191), 1 Spain (KR059156), 1 Austria (KR059180), 1 Egypt (KR059159), 1 Turkey (KR059200), 1 Cyprus (KR059163), 1 Saudi Arabia (KR059154), 1 Romania (K059198), 1 Albania (KR059146), 1 Kyrgyzstan (059122) and 1 Malaysia (KR059220) using the BioEdit software program version 7.2 [19]. To investigate genetic relationship between mitochondrial sequences, an unrooted neighbor-joining phylogeny [20] was constructed using the Tamura–Nei distance method [21]. The distance computation and phylogenetic tree construction are incorporated in the MEGA package version 5.1 [22]. Haplotype diversity (h), nucleotide diversity (p) and d average number of nucleotide were calculated using DnaSP software version 4.2 [23].
Results and Discussion
mtDNA variation in marghoz goat
In the present study, we analyzed the mtDNA control region sequences of 30 Mahabadi goats to further elucidate its diversity. There were no insertions/deletions in 30 sequences of HVRI of the control regions. The HVRI sequences were highly polymorphic. Our 30 sequences gave 7 different haplotypes with 44 variable sites defined. The two largest haplotype groups consisted of 6 individuals, two haplotype groups included 3 individuals, and three haplotypes included 4 individuals (Table 1).
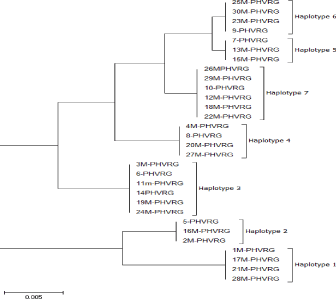
Figure 1: Average base composition of the HVR1 region sequences in Mahabadi goat.
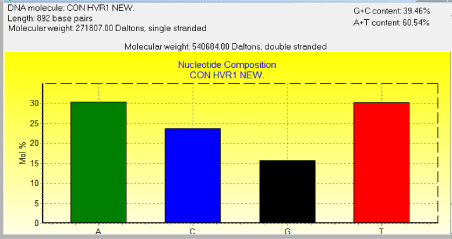
    Table 1:  Haplotype diversity phylogeny tree bead on HVR1 sequence within
Mahabadi goat population.
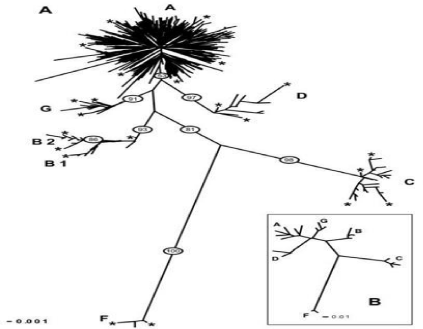
Table 2: The frequency of haplotype groups goat species around the world.
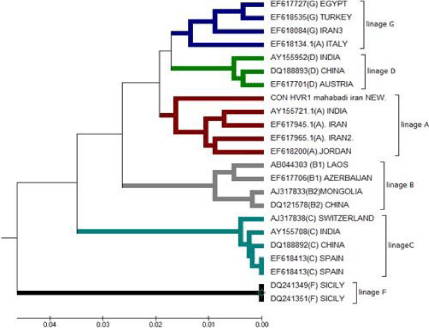
    Table 3:  Haplotype phylogeny tree of the six group based on compare HVR1
of Mahabadi goat by other.
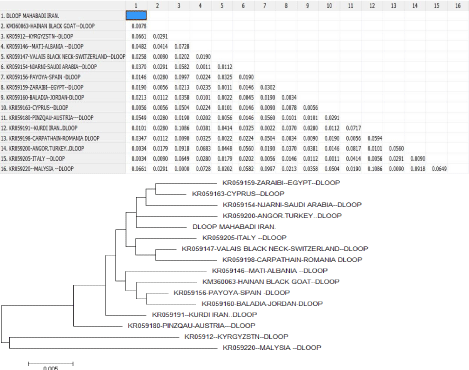
    Table 4:  Phylogenetic relationship among 12 GenBank accession number of
HVR1 region from goat breeds.
The average base composition of the control region sequences was as follows; A: 30.38%, C: 23.77%, G: 15.70% and T: 30.16% and the molecular weight of single this sequence was 271807.00 Daltons and the molecular weight of pairs was 540684.00 Daltons (Figure 1). This indicates that the caprine mtDNA control region has high A/T contents as well as in all artiodactyls (cattle, sheep, goat and pig) and other mammalian species such as mouse [24], donkey [25] and whale [26]. However, in the case of primates [27], seal [28] and rabbit [29], the control region is rich in A/C contents. This is attributed to the species-specific variations that exist in the control regions among different mammalian species.
Naderi et al. [12] investigated 2430 goats from different countries and shows six very different groups according to mitochondrial haplogroup are referred to as A, B, C, D, F and G. The results of the research show that the haplogroup A is at most at 53%. A haplogroup spread almost all over the world and is the first haplogroup. Haplogroup B is found throughout most of Asia and a small portion coming from Sub-Saharan Africa and goat Europe from Greece. Goats of haplogroup C are present in central Asian, Middle East, Iran and haplogroup D is present throughout Asia and northern Europe. Group F goat came from Sicily and the group G is present in the Middle East and North Africa. The results were in general agreement with the pattern described in previous study [12]. However more detailed molecular studies are required in near future. It is urgent to take measures that promote a sustainable management of these genetic resources [30]. We also estimated haplotype diversity for the six haplogroups .In a study carried out on samples obtained from different countries. We found that A, B, C have identified. We found that A had the highest distribution in the samples. We found that A had the highest distribution in the samples.
We found that in countries like China and Pakistan, Laos, India and Malaysia were observed only in the countries of Switzerland and Slovenia. We found that C is also observed in small populations.
We found that A belongs to group analysis every 5 samples. Goat Farm has six haplotype groups A, B, C, D, F, G, has been detected [12] haplotypes between haplotype other Group A is most frequent (Table 2).
By comparing the sequence obtained from district HVR1-ofbreed goats Mahabad sequences of these six groups of haplotypes as a sequence of reference in the study by Nader et al in 2009 took the form of a table in the study that Mahabadi goats belonging to haplotype group A is based on the analysis (Table 3).
Mahabadi goat the haplotype diversity was 0.8759. This haplotype diversity is in accordance with the previously described values in Albanian and Turkish goat breeds [6,8]. The level of haplotype diversity of 18 goat breeds (0.7121- 0.9804) by Chen et al. [31] is closed to Mahabadi goat (0.8759) in our study. Haplotype diversity of mtDNA is important indices for assessing population polymorphism and genetic differentiation. High values of haplotype indicate high polymorphism of the population [32]. Mahabadi goats are compared of 21 species goats from different countries by drawing phylogenetic that is showed in below (Table 4).
Distribution of the samples between the groups was made in accordance with the cluster obtained. Apparently, the longest distance separated the KR059220 (Malaysia) from the others and Mahabadi goat has shortest genetic distance with Angora Turkey goat (KR059200), and also has longest genetic distances with Malaysia (KR059220), Kyrgyzstan (kr059122). This is possible because of geographical distance and distributed.
Acknowledgement
The authors acknowledged the three reviewers for constructive comments on the manuscript. We gratefully acknowledge all farmers who took part in the present study, giving access to the animals.
References
- Ilie DE, Cean A, Cziszter LT, Gavojdian D, Ivan A and Kusza S. Microsatellite and mitochondrial DNA study of native eastern European cattle populations: the case of the Romanian Grey. PLoS One. 2015; 10: 1-18.
- Li KY, Li KT, Cheng CC, Chen CH, Hung CY and Ju YT. A genetic analysis of Taoyuan pig and its phylogenetic relationship to Eurasian pig breeds. Asian-Australas J. Anim. Sci. 2014; 28: 457-466.
- Agaviezor BO, Adefenwa MA, Peters SO, Yakubu A, Ade-bambo OA, Ozoje MO, et al. Genetic diversity analysis of the mitochondrial D-loop of Nigerian indigenous sheep. Anim Gen Resour. 2012; 50, 13-20.
- Hoque MR, Choi NR, Sultana H, Kang BS, Heo KN, Hong SK, et al. Phylogenetic analysis of a privately-owned Korean Native chicken population using mtDNA D-loop variations. Asian-Australas J. Anim. Sci. 2013; 26: 157-162.
- Zernekova C, Kott T and Majzlik I. Mitochondrial D-loop sequence variation among Hucul horse. Czech J. Anim. Sci. 2013; 58: 437-442.
- Hoda A, Bicoku Y and Dobi P. Genetic diversity of Al-banian goat breeds revealed by mtDNA sequence variation. Biotechnol. Biotec. Equip. 2014; 28: 77-81.
- Pakpahan S, Tunas Artama W, Widayanti R and Suparta G. Genetic variations and the origin of native Indonesian goat breeds based on mtDNA D-Loop sequences. Asia J. Anim. Sci. 2015; 9: 341-350.
- Çinar Kul B and Ertugrul O. mtDNA diversity and phy-logeography of some Turkish native goat breeds. Ankara Üniv. Vet. Fak. Derg. 2011; 58: 129-134.
- Joshi MB, Rout PK, Mandal AK, Tyler-Smith C, Singh L and Thangaraj K. Phylogeography and origin of Indian domestic goats. Mol. Biol. Evol. 2004; 21: 454-462.
- Luikart G, Gielly L, Excoffier L, Vigne JD, Bouvet J and Taberlet P. Multiple maternal origins and weak phy- logeographic structure in domestic goats. Proc. Nat. Acad. Sci. USA. 2001; 98: 5927-5932.
- Sultana S, Mannen H and Tsuji S. Mitochondrial DNA diversity of Pakistani goats. Anim. Genet. 2003; 34: 417-421.
- Naderi S, Rezaei HR, Taberlet P, Zundel S, Rafat SA, Na-ghash HR, et al. Large-scale mitochondrial DNA analysis of the do-mestic goat reveals six haplogroups with high diversity. PloS One. 2007; 2: 1-10.
- Wilson AC, Cann RL, Carr SM, George M, Gyllensten UB, Helm-Bychowski KM, et al. Mitochon-drial DNA and two perspectives on evolutionary genetics. Biol. J. Linn. Soc. 1985; 26: 375-400.
- Ghivizzani SC, Madsen CS and Hauswirth WM. In organello footprinting: analysis of protein binding at regula-tory regions in bovine mitochondrial DNA. J. Biol. Chem. 1993; 268: 8675-8682.
- Saccone C, Pesole G and Sbisa E. The main regulatory region of mammalian mitochondrial DNA: structure function model and evolutionary pattern. J. Mol. Evol. 1991; 33: 83-91.
- Anderson S, DeBruijin MHL, Colson AR, Eperon IC, Sanger F and Young IG. Complete sequence of bovine mito- chondrial DNA conserved features of the mammalian mito-chondrial genome. J. Mol. Biol. 1982; 156: 683-717.
- Brown WM, George MJ and Wilson AC. Rapid evolu-tion of animal mitochondrial DNA. Proc. Nat. Acad. Sci. USA. 1979; 76: 1967-1971.
- Moradi MH, Rostamzadeh J, Rashidi A, Vahabi K and Farah-mand H. Analysis of genetic diversity in Iranian mo-hair goat and its color types using Inter Simple Sequence Re-peat (ISSR) markers. Agric. Commod. 2014; 2: 55-62.
- Hall T.A. Bio edit: a user-friendly biological sequence alignment editor and analysis program for Windows 95/98/NT. Nucleic Acids. Symp. Ser. 1999; 41: 95-98.
- Saitou N and Nei M. The neighbor-joining method: a new method for reconstructing phylogenetic trees. Mol. Biol. Evol. 1987; 4: 406-425.
- Tamura K and Nei M. Estimation of the number of nu-cleotide substitutions in the control region of mitochondrial DNA in humans and chimpanzees. Mol. Biol. Evol. 1993; 10: 512-526.
- Kumar S, Tamura K, Jakobsen IB and Nei M. MEGA3.1: Molecular Evolutionary Genetics Analysis Soft-ware. Arizona State University Press, Tempe, USA. 2004.
- Rozas J, Sachez-Delbarrio JC, Messeguer X and Rozas R. DnaSP, DNA polymorphism analyses by the coales-cent and other methods. Bioinformatics. 2003; 19: 2496-2497.
- Ameur A, Stewart JB, Freyer C, Hagstro E, Ingman M, Ran N. Ultra-deep sequenc-ing of mouse mitochondrial DNA: mutational patterns and their origins. PLoS Gent. 2011; 7: 1-15.
- Xu X, Gullberg A and Arnason U. The complete mito-chondrial DNA (mtDNA) of the donkey and mtDNA compari- sons among four closely related mammalian species pairs. J. Mol. Evol. 1996; 43: 438-446.
- Arnason U, Gullberg A and Widegren B. The complete nucleotide sequence of the mitochondrial DNA of the ¢n whale Balaenoptera physalus. J. Mol. Evol. 1991; 33: 556-568.
- Foren DR, Hixson JE and Brown WM. Comparisons of ape and human sequences that regulate mitochondrial DNA transcription and D-loop DNA synthesis. Nucleic Acids. Res. 1988; 16: 5841-5861.
- Arnason U, Gullberg A, Johnson E and Ledje C. The nucleotide sequence of the mitochondrial DNA molecule of the grey seal, Halichoerus grypus and a comparison with the mitochondrial sequences of other true seals. J Mol Evol. 1993; 37: 323-330.
- Mignotte F, Gueride M, Champagne AM and Mounolou JC. Direct repeats in the non-coding region of mitochondrial DNA. Involvement in the generation of intra and inter-individual heterogeneity. European J. Biochem. 1990; 194: 561-571.
- Taberlet P, Valentini A, Rezaei HR, Naderi S, Pompanon F, Negrini R et al. Are cattle, sheep, and goats endangered species. Mol. Ecol. 2008; 17: 275-284.
- Chen SY, Su YH, Wu SF, Sha T and Zhang YP. Mi-tochondrial diversity and phylogeographic structure of Chi-nese domestic goats. Mol. Phylogenet. Evol. 2005; 73: 804-814.
- Liu ZG, Lei CZ, Luo J, Ding C, Chen GH, Chang H, et al. Genetic variability of mtDNA sequences in Chinese native chicken breeds. Asian-Australas J. Anim. Sci. 2006; 17: 903-909.