1Environmental and Analytical Chemistry Division, School of Advanced Sciences, Vellore Institute of Technology University, India
2Organic Chemistry Division, School of Advanced Sciences, Vellore Institute of Technology University, India
*Corresponding author: Annamalai Senthil Kumar, Environmental and Analytical Chemistry, Division, School of Advanced Sciences, Vellore Institute of Technology, Tamil Nadu.
Received: October 14, 2014; Accepted: November 20, 2014; Published: November 29, 2014
Citation: Shanmugam R, Sornambikai S, Karthikeyan NS, Sathiyanarayanan K and Kumar AS. A Simple Colorimetric Screening of Nitrite Using Iodide in an Acidic pH Solution. Austin J Anal Pharm Chem. 2014;1(6): 1026.
Nitrite (NO2-) is a hazardous chemical often coupled with food sample as a preservative. Azo dye based colorimetric nitrite detection approaches were quite commonly reported method for colorimetric nitrite analysis. Unfortunately, the above one found to has serious interferences from amine, carboxylic, thiol and carbonyl functional group bearing organic compounds. Here in we found a selective formation of colored product when milli-molar solution of nitrite is reacted with equal concentration of iodide in an acid pH<3. No such coloration was noticed if the iodide is coupled with various biochemicals such as ascorbic acid, citric acid, catechol, cysteine, dopamine, glucose, thiourea, urea and industrial compounds such as nitrite, nitrate, sulfide and chloride. Basic mechanism was probed by using cyclic voltammetry. Iodine was liberated upon the reaction of nitrite with iodide that showed a reddish-yellow colored solution for further nitrite screening. Finally, a simulated fish real sample analysis for screening of nitrite was successfully demonstrated.
Keywords: Nitrite; Iodide; Acidic pH; Screening; Colorimetric
Nitrite (NO2-) is one of the important nitric oxide species involved in many biological, clinical, water and food processing systems [1]. For instance, sodium nitrite is commonly added to cured meats, bacon, sausage, ham and smoked fish etc, as a food additive [2]. It serves a dual role, since it alters both the color of preserved fish and meats and also prevents growth of Clostridium botulinum bacteria, which causes serious paralytic illness (botulism) [3]. In the European Union nitrite may be used as a mixture with salt containing at most 0.6% sodium nitrite. Nevertheless, when the nitrite containing food materials are exposed to high temperature its leads to formation of carcinogenic nitrosamines and to various types of cancer in children, pregnant women and adults [2-5]. Consequently high concentration of organic compounds, such as alpha-tocopherol (Vitamin E), ascorbic acid and erythorbic acid were used as an inhibitor to the nitrosamine formation [2, 6]. Recently, sodium nitrite has been found to be an effective means to increase blood flow by dilating blood vessels, acting as a vasodilator [7]. Hence, the Food and Drug Administration (FDA) has established guidelines to limit the amount of nitrites that can be used in foods. Therefore, simple, rapid and selective screening for the dangenereous nitrite could greatly aid the individuals and in evaluating quality of their various day-to-day life nitrite contaminated products including water and food materials.
Several indirect methods were reported for nitrite detection and determination, including those based on organic chromospheres [8, 9, 10] and fluorophores [11, 12]. Unfortunately, the use of these methods requires complicated and expensive procedures with time consuming analysis. Separation technique is further required to selectively detect the nitrite in presence of other organic compounds. Meanwhile, Miura and Hamada used ion chromatography based photometric analysis for the detection of nitrite from various metal ion interferences using KI solution [13]. Here in, we report a simple and easy screening methodology for nitrite based on its selective chemical reaction with iodide in an acidic solution that liberates colored iodine in solution. We extend this work for the detection of nitrite in a fish real sample. This reaction is not interfered by common bio and organic chemicals. To the best of our knowledge such organic selectivity for nitrite screening is not been reported in the literature so for.
Optical density (OD) measurements were carried out with the colorimeter, Sys-electronics, India. Voltammetric measurements were carried out with CHI Model 660C electrochemical workstation, USA. The three-electrode system consists of glassy carbon (GCE) as working electrode of geometrical surface area 0.0707 cm2, an Ag/AgCl 3M KCl as reference electrode and a platinum wire as the auxiliary electrode. The BAS polishing kit was used for polishing the GCE. Well water real samples were collected from local area. And Food samples were purchased from local market in Vellore.
NaNO2 and KNO3 were purchased from SD fine chemicals, India. Ascorbic acid, Uric acid, L-Cysteine chemicals of ACS grade samples was purchased from Merck, India. Other chemicals used in this work were all of ACS-certified regent grade and used without further purification. Deionized and alkaline KMnO4 distilled water (DD water) was used throughout the experiment. Unless otherwise stated, a pH 2 KCl-HCl buffer solution of I = 0.1 M was used as supporting electrolyte in this study. Experiments were all carried out under normal dissolved oxygen (DO) condition.
Interaction of nitrite using iodide was rarely explored in the literature [13, 14]. Figure 1 shows typical picture for the equimolar mixture solution of nitrite and iodide in various pH solutions of range 1-7. As can be seen, reddish-yellow color was appeared for the solutions in the pH window of 1-3, where as it was colorless in the pH 4-7 ranges. Formation of the reddish-yellow color was highly rapid. Key species involved in the coloration is nitrous acid, HNO2, since NO2- is having a acid-dissociation constant, pKa value of 3.3 [14]. It has been reported that in acidic solution the nitrous acid selectively react with iodide to form iodine, which can give rise to reddish-yellow colored solution [13, 15].
2NO2- + 2I- + 4H+ ⇔ 2NO + I2 + 2H2O (fast chemical reaction) (1)
Important observation of this present work is selectivity. The above reaction found is to be highly selective which is not found with common biological and other organic & inorganic compounds containing functional groups such as amine (-NH2), carboxylic acid (-COOH), thiol (-SH), sulfide (S2-), carbonyl (-CHO), hydroxy (-OH), Nitrate (NO3-) and chloride (Cl-) etc., by testing with potassium nitrate, potassium chloride, ascorbic acid, uric acid, catechol, cysteine, dopamine, glucose, sulfide, thiourea and urea. As in Figure 2, none of the organic and biological compounds can give rise to any coloration in the mixture. Note that the organic chromophores and fluorophores based detection approaches were limited to amino, carboxyl and thiol containing organic compounds.
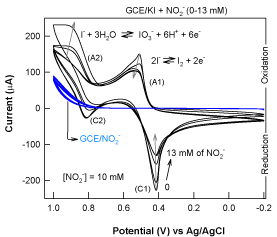
Regarding to the mechanism, initially it is expected that the iodide/ iodine redox couple might directly mediate the nitrite oxidation (direct electron-transfer). In order to verify the expectation, cyclic voltammetric (CV) experiments were carried out with and without NO2- in dilute KI solution. In general, a redox system mediated oxidation or reduction reaction could be identified through marked increased in the oxidation or reduction current response where the electrochemical redox peaks exist. As can be shown in first CV scan in Figure 3 (without NO2-), iodide dissolved pH 2 KCl-HCl buffer solution shows two redox peaks centered (E°’) at 0.45 V (A1/C1) and 0.9 V (A2/C2) vs Ag/AgCl due to the I2/I- and iodate (IO3-,/)/I- redox reactions [15] as below.
A1/C1: 2I- ⇔ I2 + 2e- E°’ = 0.45 V vs Ag/Cl (2)
A2/C 2: I- + 3H2O ⇔ IO3- + 6H
Unexpectedly, upon first spike of NO2- to the bulk iodide solution result to a decrease (inhibition) in the A1/C1 redox peak current, while unaltered behaviors with the A2/C2 redox peak current response (2nd CV scan in the Figure 3) were noticed. Meanwhile, immediate formation of the reddish-yellow color was observed each timing when NO2- is mixed with I-. Upon successive spikes of NO2- to the iodide solution, systematic decrease in the cathodic reduction peak and catalytic type of increase in the anodic peak responses were noticed respectively with A1/C1 and A2/C2 systems (3rd and further CV scans in the Figure 3). Based on these observations following conclusions were drawn: (i) reduced form of the species, I- is not involving in any electro-catalytic mediation towards NO2- oxidation, (ii) the I2 formed in the reaction (reaction 1) may further involved in oxidation of water slowly to generate additional IO3- species (reaction 4), rather than any NO2- mediation:
I2 + 6 H2O ⇔ IO3- + 12 H+ + 10e- (4)
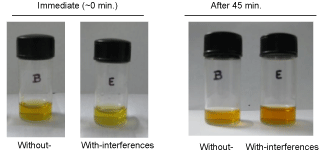
Since the reaction (4) is slow and hence occurs at high positive applied potential, it is expected that it wouldn’t be found to occur at normal conditions. In order to further confirm this observation, freshly prepared KI+NO2- mixture in pH 2 solutions was kept ideal for 45 minutes in room temperature (Figure 4, bottles named B). There is no marked alteration in the color was noticed, which particularly supports the previous conclusion and also to the good stability of the detection approach.
In order to validate the protocol, known amount of interferencing chemicals such as 10 mg each of ascorbic acid, oxalic acid, sodium nitrate, manganese (II) carbonate, magnesium nitrate, ferrous ammonium sulphate and D-glucose mixed nitrite sample was tested as real sample analysis to validate the approach (Figure 4, bottle named E in first). A fixed amount of iodide was spiked to the real sample and further used for screening. The immediate qualitative color appearances appreciably same and not interfering with any of the above said organic chemicals were noted. The selectivity observed in this work is excellent and highly suitable for screening the nitrite samples. Some of the secondary complication, like interaction of the iodine product with other organic compounds present in the real sample may be expected in this detection methodology. However, since the iodine base reaction follows coupled chemical electron-transfer pathways [17] with slow kinetics, under prescribed timing of few minutes (∼5 min.) it is possible to screen the nitrite without any marked above secondary complications.
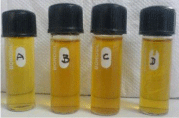
Finally, a raw fish muscle real sample (fresh) was tested for nitrite screening analysis. Since, there is no nitrite in the sample, a simulated fish sample in which 50 g of fish muscle homogenized in 100 mL pH 2 kept in refrigerator for 24 hours was subjected to real sample analysis as in Figure 5. Prior the screening, the above sample is filtered and subjected to addition of 20 mM KI and 20 mM of NO2- in pH 2 solutions at different ratios. As can be seen in Figures 5A-C upon addition of 5+0; 4.75+0.25; 4.5+0.5 and 4.25+0.75 ml of KI+KNO2 to 5 mL of real sample, total volume 10mL, resulted to immediate appearance of reddish-yellow color. This experiment validates the usefulness of the present protocol for practical applications.
Mixing of diluted solutions of nitrite with iodide in an acidic solution of pH <3, result to a rapid reddish-yellow color appearance, which was highly selective and not observed with any of the biological and industrially important compounds having functional groups such carboxylic, hydroxyl, thiol, carbonyl and other chemicals like sulfide, nitrate and chloride etc in the working condition. Such selectivity is unique for the fast screening of nitrite. Since the basic idea discussed in this work is of fundamental interest and simple, it can be used as a first aid to qualitatively screen the nitrate present in the real samples.
The Authors gratefully acknowledge financial support from the Department of Science and Technology, Technology Development System (DST-TSD), India. We also acknowledge the valuable discussion with Professor Jyh-Myng Zen, National Chung Hsing University, Taiwan.
Photographs of mixture of 10 mM each of iodide and nitrate (1.5 + 1.5 mL) in various pH buffer solutions (Deionized distilled water).

Photographs of mixture of 10 mM each of nitrite with various analytes (1.5 mL + 1.5 mL) in pH 2.06 KCl-HCl buffer solutions. AA = ascorbic acid; CA = catechol; CySH = cysteine; DA = dopamine; Glu = glucose; TURA = thiourea; UA = uric acid and URA = Urea.

(A) Cyclic voltammetry response of a glassy carbon electrode with 10 mM of KI without and with various nitrite (0-13 mM) in pH 2 KCl-HCl buffer solution at a scan rate of 50 mV/s.

Photographs of 10 mM each of KI+NO2- in a pH 2 KCl-HCl buffer solution (Deionised water) of total volume 3 mL without (bottle named B) and with (bottle named E) interference systems (10 mg each of ascorbic acid, oxalic acid, sodium nitrate, manganese(II)carbonate, magnesium nitrate, ferrous ammonium sulphate & D-glucose dissolved system) under timings.

Photographs of 10 mL (pH 2 KCl-HCl) of a simulated fish muscle real sample (50g/100mL) after addition of (A) 5+0; 4.75+0.25; 4.5+0.5 and 4.25+0.75 ml of KI+KNO2.
