Research Article
Ann Hematol Oncol. 2021; 8(5): 1345.
Quantitative Predictions of Neoadjuvant Chemotherapy Effects in Breast Cancer by Individual Patient Data Assimililation
Castorina P1,2*, Carco D1, Colarossi C1, Mare M1,5, Memeo L1, Pace M2,3,4, Puliafito I1 and Giuffrida D1
1Department of Experimental Oncology, Mediterranean Oncology Institute, Italy
2National Institute of Nuclear Physics, Italy
3Department of Medical Physics, University of Catania,Italy
4Sicilian Center for Nuclear Physics and Structure of Matter, Italy
5Department of Biomedical and Dental Sciences of Morphological and Functional Images, University of Messina, Italy
*Corresponding author: Castorina Paolo, Department of Experimental Oncology, Mediterranean Oncology Institute, 95029 Viagrande, Italy
Received: February 15, 2021; Accepted: April 14, 2021; Published: April 21, 2021
Abstract
Neoadjuvant chemotherapy has been used for breast cancer aiming at downgrading before surgery. In this article we propose a new quantitative analysis of the effects of the neoadjuvant therapy to obtain numerical, personalized, predictions on the shrinkage of the tumor size after the drug doses, by data assimilation of the individual patient. The algorithm has been validated by a sample of 37 patients with histological diagnosis of locally advanced primary breast carcinoma. The biopsy specimen, the initial tumor size and its reduction after each treatment were known for all patients. We find that: a) the measure of tumor size at the diagnosis and after the first dose permits to predict the size reduction for the follow up; b) the results are in agreement with our data sample, within 10% to 20%, for about 90% of the patients. The quantitative indications suggest the best time for surgery. The analysis is patient oriented, weakly model dependent and can be applied to other cancer phenotypes.
Introduction
In the era of personalized oncology, mathematical models are a useful tool for a better understanding of the clinical effects of therapy.
The expected individual response to tumor therapies is generally based on a set of indices, defined with large quantitative variability. For example, for neoadjuvant chemotherapy for locally advanced breast cancer, aiming at downgrading before surgery, one usually considers the subtypes classification according to the expression of hormone receptors, Estrogen (ER) and Progesterone (PR), of the Human Epidermal Growth Factor Receptor 2 (HER2), the proliferation index ki67, the inizial tumor size and cellularity. Indeed, these clinical informations may have a prognosis value similar to that of multigene prognostic score [1].
The tumor progression during neoadjuvant chemotherapy [2,3], described by previous (and others) predictive factors, gives direct informations on the response to the therapy. By those analyses one gets semi-quantitative results following the standard classification: tumor size (median and range), T stage, Node stage, JACC stage, Lymphovascular invasion and other parameters.
A complementary strategy could be obtained by more quantitative informations, based on numerical approaches which, by single patient data assimilation, enhance the level of reliability of forecasts on the individual response.
Here we discuss an algorithm which, starting from the measure of the tumor size (radius) at the diagnosis and after the first dose, is able to predict, essentially without free parameters, the shrinkage of the tumor in the sequence of treatments. The proposed method is, by itself, patient oriented since the first size reduction and the initial cellularity take into account the specific initial condition.
The numerical predictions agree, within 10% to 20%, for more than 90% of the observed data of our sample of 37 patients.
Mathematical Formulation of the Diagnostic Algorithm
The breast tumor growth is described by the Gompertz law [8,9], solution of the differential equation
(1/ N)dN / dt = - k ln(N / N8 ), (1)
where N is the cell number at time t, k is a constant and N8 is the maximum number of cells (N8=3.1×10¹², according to ref. [9]).
The modification of the specific growth rate due to chemotherapy, during the time interval of a single treatment, is obtained by introducing a function c(t) in the previous equation [10-13], i.e.
(1/ N)dN / dt = - k ln(N / N8 ) c(t), (2)
where c(t) has a negligible value after the interval, t, between two timeline doses (t=3 weeks). In other terms, chemoterapy effects start, periodically, at the beginning of each drug dose but almost completely decline after t=3 weeks and, therefore, the function c(t) has a discontinuity on the days of treatment. By solving the previous eq. (2) (see appendix A) for homogeneous, spherical symmetric configurations, the size reduction after n doses is given by
where Rn+1 is the tumor radius after n+1 doses and, for each patient, the constant k is determined by the initial cellularity (the second term in the growth law in eq. (1) is the fraction of duplicating tumor cells).
In the final result, (eq. 3), the function c(t) does not explicitely appear: its contribution is hidden in the (measured) size after the first dose R1(t). In this respect, the approach is independent on the model describing the chemotherapy effects.
Validation
Validation: Patients and Therapy
Patients: This is a retrospective single centre study. Thirtyseven women, aged 36 years to 78 years, with histolog- ically proven operable breast cancer were evaluated. All tumours were tested for Estrogen Receptor (ER), Progesterone Receptor (PgR), HER 2 and ki 67. Thirty-six patients showed positivity for ER (range 2% to 90%) and PgR (range range 2% to 90%), HER2 3+ was present in 5/37 patients. Ki 67 was variable from 5 to 30%. Median diameter of tumour, defined by imaging, was 43, 5 mm (range 21 mm to 72 mm). Four patients had clinical positivity for axillary nodes. Pregnant women were ex-cluded. ECOG-PS of all patients was 0 or 1. All patients had adequate haematological, renal and haepatic function. All patients had a normal left ventricular ejection fraction (LVEF >50%).
Treatment
Neoadjuvant chemotherapy corresponds to the use of a systemic treatment applied before locore- gional treatment (surgery and / or radiotherapy) in order to obtain a more frequent conservating surgery, downgrading the tumour size. Major drugs used for breast cancer patients included anthra- cyclines and taxanes [4]. Patients evaluated in our study received a median of five cycles (range 4 to 6) of every -3-week (q3w) ET (epirubicin 80 mg/m², paclitaxel 175 mg/m²) [5,6]. Seven patients having HER2 3+ received integrate treatment with trastuzumab 6 mg/kg (8 mg/kg as loading dose). At the first follow up, after one chemotherapy administration, all patients had a tumour diameter reduction variable from 10% to 70%. At the second follow up, after second chemotherapy administration, all patients showed a further diameter reduction included between 10% and 30%. At the third follow up, 14/37 patients continued to respond to treatment while the others showed a stable disease. At the fourth follow up, only one patient showed a futher tumour diameter reduction, the others continued to have a stabilization of disease and this was persisting at the remaining follow up [7].
Results and Discussion
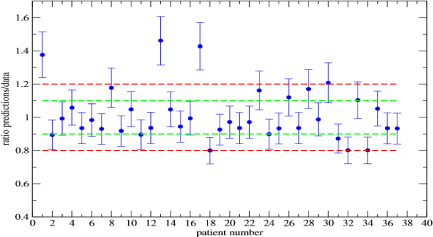
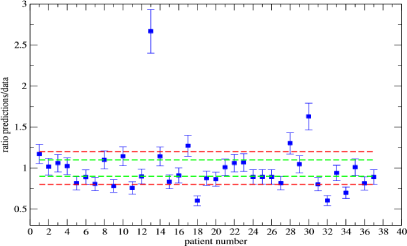
The estimate of the tumor shrinkage in the dose sequence follows immediately from eq.(3) and from the determination of R1(t). In Figure 1,2 the numerical results are compared with data for the second and the third treatment for all patients. The radius measurements had a 2% to 3% statistical error and the error propagation has been taken into account. For the second dose, the ratio between predictions and data is within the prudential interval 1 ± 0.1 (1 indicates a perfect agreement) for 31 patients of the entire sample (84%) and the agreement is within 1 ± 0.2 (Figure 1) for 34/37 (92%). For the third dose, in 29/37 and 32/37 cases the agreement is within the fiducial 1 ± 0.1, 1 ± 0.2 intervals (Figure 2) respectively.

    Figure 1: Predictions to data ratio on the tumor radius after the second dose.
The green (red) line indicates the 1 ± 0.1 (1 ± 0.2) interval.

    Figure 2: Predictions to data ratio on the tumor radius after the third dose.
The green (red) line indicates the 1 ± 0.1 (1 ± 0.2) interval.
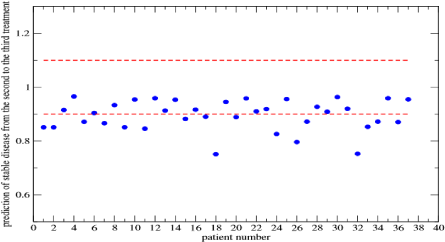
The results in Figure 2 have been obtained by assuming an almost constant tumor size for stable disease. On the other hand, one can ask if the diagnostic algorithm can give quantitative indications on the stability of the disease, i.e. if there is only a small reduction of the size after the treatment. If a further reduction less than 10% defines the stable disease condition, by applying the proposed algorithm, one gets that after the third treatment, 17/34 patients continued to respond to the therapy (i.e. the tumor size decreases more than 10%) to be compared with the clinical result of our sample, 14/37 cases (Figure 3).

Figure 3: Predictions of stable disease after the third dose. The red lines indicate the 1 ± 0.1 interval.
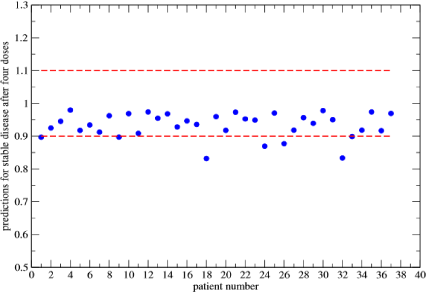
In Figure 4 analogous results are reported for the fourth dose, giving 4/37 patients still responding to the treatment (1/37 is the clinical result). A homogeneous and spherical tumor is assumed in the previous sections, however these constraints can be easily removed and the diagnostic algorithm can be improved in many directions, taking into account, for example, different geometrical tumor shapes or inhomogeneities. The proposed approach can be applied in the clinical practice as follows. Initially the tumor size, R0 and the cellularity are evaluated by usual methods and, after the first dose, one measures the Radius (R1). By those input data, one then estimates the shrinkage of the tumor size due to the following treatments, i.e the values R2, R3,.., according to eq. (3). If the tumor shrinkage observed after the second dose (and before the third one) turns out to be in agreement with or larger than the estimated results, R2, then the predictions should be considered clinically reliable. In particular, a forecast of stable disease (defined by a reduction of the tumor radius less than 10%) suggests to stop the neo-adjuvant therapy and to proceed with surgery: there is a clear signal that other drug doses are not effective to further reduce the size [4,14-19].

Figure 4: Predictions of stable disease after the fourth dose. The red lines indicate the 1 ± 0.1 interval.
A computational code can be easily implemented.
Conclusion
The good agreement between predictions and data for the treatment sequence suggests that the proposed method is a reliable starting point for a more quantitave description of neo-adjuvant chemotherapy effects and for an optimal management of patients, permitting to avoid unnecessary treatments and reducing economic costs. It should be further clarified that it has to be considered as a complementary tool to the standard chemotherapy response evaluation criteria in solid tumors and that it does not give any information on the overall survival probability, but a quantitative evaluation of the tumor size depletion.
Acknowledgment
The authors thank the Fondazione IOM. The work is partially supported by the project “DiOncoGen Diagnostica Innovativa”, Codice CUP: G89J18000700007, Azione 1.1.5 del PO FESR SICILIA 2014/2020.
References
- Cuzik J. Prognostic value of a combined ER, PgR, Ki67, HER2 Immunohistochemical (IHC4) score and comparison with GHI recurrence score-results from TransATAC, Cancer Res. 2009; 69: 503s.
- Claude AS, Gonzalez-Angulo AM, Hunt KK, Liu P, Pusztai L, Symmans WF, et al. Predictors of tumor progression during neoadjuvant chemotherapy in breast cancer, J. Clin. Oncol. 2010; 28: 1821-1828.
- Fukuda I, Araki K, Kobayashi K, Shibayama T, Takahashi S, Gomi N,et al. Pattern of tumor shrinkage during neoadjuvant chemotherapy is associated with prognosis in low grade luminal early breast cancer, Radiology 2018; 286: 49-57.
- Gompertz B. On the nature of the function expressive of t he law of human mortality and a new mode of determining life contingencies”. Phil Trans R Soc. 1825; 115: 513.
- Norton L. A Gompertzian model of human breast cancer gro wth”. Cancer Res. 1988; 48: 7067-7071.
- Norton L, Simon R. Tumor size, sensitivity to therapy and the design of treatment protocols. Cancer Treat Rep. 1976; 61: 1307-1317.
- Norton L. Conceptual and practical implications of breast cancer geometry: toward a more effective, less toxic therapy. Oncologist. 2005; 10: 370-381.
- Norton L, Simon R. The Norton-Simon hypothe-sis: designing more effective and less toxic chemo- therapeutic regimens. Nat Clin Pract Oncol. 2006; 3: 406-407.
- Castorina P, Carco D, Guiot C, Deisboeck TS. Tumor Growth Instability and Its Implications for Chemotherapy. Cancer Res 2009; 69: 8507-8515.
- Pathak M, Dwivedi SN, Deo SVS, Thakur B, Sreenivas V, Rath GK. Neoadjuvant chemotherapy regimens in treatment of breast cancer: a systematic review and network meta-analysis protocol Systematic Reviews. 2018; 7: 89.
- von Minckwitz G. Docetaxel, Anthracycline combinations for breast cancer treatment. Expert Opin Pharmacother. 2007; 8: 485-495.
- Zaheed M, Wilcken N, Willson ML, O Connell DL, Goodwin A. Sequencing of anthracyclines and taxanes in neoadjuvant and adjuvant therapy for early breast cancer. Cochrane Database Syst Rev. 2019; 2: CD012873.
- Caitlin Murphy, et al. Tailored NEOadjuvant epirubicin, cyclophosphamide and Nanoparticle Albumin- Bound paclitaxel for breast cancer: The phase II NEONAB trial-Clinical outcomes and molecular determinants of response. PLOS ONE. 2019.
- Viale G, Regan MM, Maiorano E, et al. Prognostic and predictive value of centrally reviewed expression of estrogen and progesterone receptors in a randomized trial comparing letrozole and tamoxifen adjuvant ther- apy for postmenopausal early breas cancer: BIG 1-98. J Clin Oncol. 2007; 25: 3846- 3852.
- Colleoni M, Viale G, Zahrieh D, Bottiglieri L, Gelber RD, Veronesi P, et al. Expression of ER, PgR, HER1, HER2, and response: a study of preoperative chemotherapy. Ann Oncol. 2008; 19: 465-472.
- Mittendorf EA, Vila J, Tucker SL, Chavez-MacGregor M, Smith BD, Symmans WF, et al. The Neo-Bioscore Update for Staging Breast Cancer Treated with Neoadju-vant Chemotherapy-Incorporation of Prognostic Biologic Factors Into Staging After Treatment. JAMA Oncology. 2016; 2: 929.
- Therasse P, Arbuck SG, Eisenhauer EA, Wanders J, Kaplan RS, Rubinstein L, et al. New guidelines to evaluate the response to treatment in solid tumors. European Orga- nization for Research and Treatment of Cancer, National Cancer Institute of the United States, National Cancer Institute of Canada. J Natl Cancer Inst. 2000; 92: 205-216.
- Eisenhauer EA, Therasse P, Bogaerts J, Schwartz LH, Sargent D, Ford R, et al. New response evalua- tion criteria in solid tumors: revised RECIST guideline (version 1.1). Eur J Cancer. 2009; 45: 228-247.
- Choi H, Charnsangavej C, Faria SC, Macapinlac HA, Burgess MA, Patel SR, et al. Correlation of computed tomography and positron emission tomography in patients with metastatic gastrointestinal stromal tumor treated at a single institution with imatinib mesylate: proposal of new computed tomography response criteria. J Clin Oncol. 2007; 25: 1753-1759.