Review Article
Ann J Materials Sci Eng. 2014;1(1): 11.
A Generalized Lattice-Point Method for Reconstructing Heterogeneous Materials from Lower-Order Correlation Functions
Jiao Y*
Department of Materials Science and Engineering, Arizona State University, USA
*Corresponding author: Jiao Y, Department of Material Science and Engineering, Arizona State University, Tempe, 85287, USA
Received: April 10, 2014; Accepted: May 05, 2014; Published: May 22, 2014
Abstract
The versatile physical properties of heterogeneous materials are intimately related to their complex microstructures, which can be statistically characterized and modeled using various spatial correlation functions containing key structural features of the material’s phases. An important related problem is to inversely reconstruct the material microstructure from limited morphological information contained in the correlation functions. Here, we present in details a generalizedlattice-point (GLP) method based on the lattice-gas model of heterogeneous materials that efficiently computes a specific correlation function by updating the corresponding function associated with a slightly different microstructure. This allows one to incorporate the widest class of lower-order correlation functions utilized to date into the Yeong-Torquato stochastic reconstruction procedure, and thus enables one to obtain much more accurate renditions of virtual material microstructure, to determine the information content of various correlation functions and to select the most sensitive micro structural descriptors for the material of interest. The utility of our GLP method is illustrated by modeling and reconstructing a wide spectrum of random heterogeneous materials, including “clustered” RSA disks, a metal-ceramic composite, a two-dimensional slice of Fontainebleau sandstone and a binary laser-speckle pattern, among other examples.
Introduction
Heterogeneous materials (or random media) are those composed of domains of different materials or phases or the same material in different states. Such materials are ubiquitous in nature and in man-made situations; examples include sandstones, concrete, animal and plant tissue, gels and foams and distribution of galaxies [1-9]. Their versatile macroscopic (e.g., transport, mechanical and electromagnetic) properties which are of great interest in various engineering applications are intimately related to the complex material microstructure [1-3,10-12]. Accordingly, a larger number of statistical morphological descriptors have been devised to quantify the key structure features of different material systems [13- 18]. One family of such descriptors includes the standard n-point correlation functions Sn(x1; . . . ; xn) [1]. In particular, Sn gives the probability of simultaneously finding n points with positions x1; . . . ; xn, respectively, in one of the phases of the media. Of particular interest are the lower-order Sn (such as S1, S2 and S3), which have been computed for various models of heterogeneous materials and, as a result, excellent estimations of the effective properties of these mediahave been obtained under certain situations [1]. Recently, lower order correlation functions have been also been employed in computational material design schemes [19-21].
In the study of heterogeneous materials, an intriguing and important inverse problem is the reconstruction of these media from a knowledge of limited microstructural information (a set of lowerorder correlation functions) [22-35]. An effective reconstruction procedure enables one to generate accurate digitized representations (images) of the microstructure from lower-order correlation functions obtainable in experiments or from theoretical considerations, and subsequent analysis can be performed on the images to obtain macroscopic properties of the material without damaging the sample. Reconstruction of a three-dimensional medium using information extracted from two-dimensional plane cuts through the material is another application of great practical value, especially in petroleum engineering, biology and medicine, because in many cases only twodimensional information such as a micrograph is available. One can also determine how much information is contained in the correlation functions by comparing the original and reconstructed media. Construction often refers to generating realizations of heterogeneous materials from a set of hypothetical correlation functions, which enables one to test the realizability of various types of hypothetical functions, which is an outstanding theoretical question [36,37]. Recently, the (re)construction techniques have been employed to identify and categorize heterogeneous materials based on their correlation functions [26,27] and to model a wide spectrum of engineering materials, including sandstone [38,39], porous metal/ ceramics composite [40], alloys [41-44], and textile composites [45,46].
A significant number of reconstruction studies focus on the standard two-point correlation function S2(r), which gives the probability of finding two points separated by a displacement vector r in the phase of interest. This statistical descriptor can be obtained in small-angle X-ray scattering experiments [47]. As pointed out in Reference [48], S2 alone does not provide sufficient information to uniquely determine the microstructures in general; and it is not clear at all that including higher order n-point correlation functions such as S3, S4 etc. would lead to better reconstructions, since these quantities only introduce local information about n-point polygons (polyhedra). As noted in Reference [1], one can never reconstruct the target microstructure perfectly using limited information, i.e., such a reconstruction is generally non-unique. Thus, the objective here is notthe same as that of data decompression algorithms which efficiently restore complete information, but rather to generate realizations of random microstructure with the key morphological features depicted by the correlation functions. Instead of the aforementioned natural and obvious extension to higher-order versions of S2, one could look at additional lower-order correlation functions other than the standard S2 for a better signature of the microstructure.
In Reference [48], we introduced a novel reconstruction procedure called the Generalized Lattice-Point (GLP) method, which enables one to incorporate the widest class of lower-order correlation functions examined to date. The GLP method allows one to generate the accurate renditions of the media of interest using various combinations of the correlation functions and to determine the most sensitive statistical descriptors for the materials of interest. Moreover, we showed through several illustrative examples in [48] that the two-point cluster function C2(r), which gives the probability of finding two points separated by a displacement vector r in the same cluster [49] of the phase of interest, is a superior statistical descriptor to a variety of “two-point” quantities besides S2, including surface correlation functions Fss and Fsv, the pore-size function F, linealpath function L and the chord-length density function p [1] (all of which are defined precisely in Sec. 2). However, the details of the GLP method were not provided in Reference [48]. In this paper, we present the algorithmic details of the generalized lattice-point method. In particular, the discretized heterogeneous material is considered as a lattice-gas system [27], in which pixels with different local states are “molecules” of different “gas” species, or a point process on a lattice. The correlation functions of interest can be obtained by binning the separation distances between the selected pairs of molecules from particular species. For simplicity we only provide the formalism for binary random media here. The generalization of the methodology to multi-phase microstructures is straightforward. The GLP method is combined with the Yeong-Torquato stochastic reconstruction technique [22,23] to evolve a trial microstructure to match the specific target correlation functions as accurately as possible. The GLP method is necessary to efficiently update the correlation functions of the system during the reconstruction process to make it computationally feasible to incorporate those functions into the reconstruction: direct re-sampling is too computationally expensive to implement in practice.
To demonstrate its utility, we apply the GLP method to reconstruct a wide spectrum of random systems from a wide range of correlation function, including “clustered” RSA disks, a metalceramic composite, a two-dimensional slice of a Fontainebleau sandstone and a binary laser-speckle pattern, among other examples. To quantitatively ascertain the accuracy of a reconstruction, correlation functions other than the targeted ones are measured and compared to those of the original medium and the lineal-path function L(r) is used here. Except for the laser-speckle pattern, which processes a multi-scale structure with percolating phases, reconstructions incorporating C2 always produce the most accurate renditions of the target microstructures. This is consistent with our conclusion in Reference [48] that incorporation of C2 significantly reduces the number of compatible microstructures, even superior to certain higher order n-point correlation functions. Statistical descriptors that could be used to characterize multi-scale structures are also suggested.
The rest of the paper is organized as follows: In Sec. 2, we define and discuss various correlation functions used in the reconstructions. In Sec. 3 and 4, we provide the details of the GLP method and how to incorporate it into the general stochastic reconstruction procedure. In Sec. 5, we apply the methodology to reconstruct a variety of random media. In Sec. 6, we make concluding remarks.
Definition of Correlation Functions
Consider a d-dimensional two-phase (binary) microstructure in which phase i has volume fraction φi (i = 1; 2) and is characterized by the indicator function I(i)(x) defined as
The two-point correlation function is defined as
S2(i)(x1 ,x2 ) =< I(i)(x1)I(i)(x2)>
where <> denotes ensemble average. This correlation function is the probability of finding two points x1 and x2 both in phase i. hence forth, we will drop the superscript “i” and only consider the correlation functions for the phase of interest. For statistically homogeneous and isotropic microstructures, which is the focus of the rest of the paper, two-point correlation functions will only depend on the distance r = | x1 - x2| between the points and hence S2(x1; x2) = S2(r). In the absence of long-range order, which is the most common occurrence, S2 rapidly decays to Á2, i.e., the probability of finding two points independently in the phase of interest.
The surface-void and surface-surface correlation functions are respectively defined as
Fsv(r) = <M(x1)I(x2)> ; Fss(r) = <M(x1)M(x2)> ;
where M(x) =|∇I (x) | is the two-phase interface indicator function. By associating a finite thickness with the interface, Fsv and Fss can be interpreted, respectively, as the probability of finding x1 in the “dilated” interface region and x2 in the void phase and the probability of finding both x1 and x2 in the “dilated” interface region but in the limit that the thickness tends to zero [1].s
The lineal-path function L(r) is the probability that an entire line of length r lies in the phase of interest, and thus contains a coarse level of connectedness information, albeit only along a lineal path [1,50]. The chord-length density function p(r) is the probability density function associated with finding a “chord” [51] of length r in the phase of interest and is directly proportional to the second derivative of L(r) [52]. The pore-size function F(r) is related to the probability that a sphere of radius r centered at a random point can lie entirely in the phase of interest [1], and therefore is the “spherical” version of the lineal measure L.
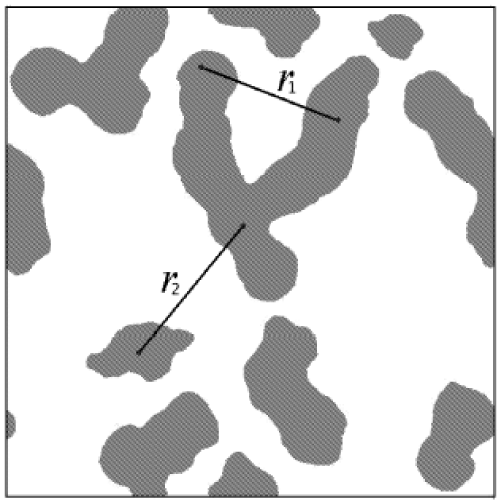
The two-point cluster function embodies a greater level of connectedness information than either L or F. In particular, C2(r) is defined to be the probability of finding two points separated by a distance r in the same cluster of the phase of interest [49,53], as schematically shown in Figure 1. When the phase is not percolating, C2 is short ranged and decays to zero rapidly. As the size of the clusters in the systems increases, C2 becomes a progressive longer-ranged function such that its volume integral diverges at the percolation threshold [1]. Thus C2 is extremely sensitive to topologically connectedness information and it takes into account all possible connecting paths, not only the “lineal” and “spherical” ones.
Figure 1: Probability interpretation of C2 and S2. The point pair separated by r1 contributes to both C2 and S2; the point pair separated by r2only contributes to S2.
Sampling the Correlation Functions: The Generalized Lattice-Point Method
The aforementioned probabilistic interpretations of the correlation functions enable us here to develop a general sampling method for reconstruction of statistically homogeneous and isotropic digitized microstructures using the “lattice-gas” formalism described in detail in Reference [27]. In the “lattice-gas” formalism, the pixels have two local states, i.e., they are either hard “lattice-gas molecules” or unoccupied lattice sites. Here we generalize the formalism to include multiple local states and “gas” species: different pixel values correspond to distinct local states and pixels with the same value are considered to be “molecules” of the same “gas” species [54,55]. The correlation functions of interest can be obtained by binning the separation distances between the selected pairs of molecules from particular species.
Standard Two-Point Correlation Function
We denote the number of lattice-site separation distances of length r by NS(r) and the number of molecule-pair separation distances of length r by NP(r). Thus, the fraction of pair distances with both ends occupied by the phase of interest, i.e., the two-point correlation function, is given by S2(r) = NP(r)/NS(r).
Two-Point cluster function
To obtain C2, one needs to partition the “molecules” into different subsets τi (“species”) such that any two molecules of the same species are connected by a path composed of the same kind of molecules, i.e., molecules that form a cluster, which is identified using the “burning” algorithm [56]. The number of pair distances of length r between the “molecules” within the same subset τi is denoted by NiP(r). The two point cluster function is then given
by C2(r) = ΣiNiP(r)/NS(r).
Surface correlation functions
The calculation of Fss and Fsv requires partitioning the “molecules” into two subsets: the surface set τS containing only the “molecules” on the surfaces of the clusters and the volume set τV containing the rest. In a digitized medium, the interface necessarily has a small but finite thickness determined by the pixel size. Thus, the surface-surface and surface-void correlation functions can be regarded as probabilities that are given by Fss = Nss(r)/NS(r) and Fsv = Nsv(r)/NS(r), respectively; where Nss(r) gives the number of distances between two surface molecules with length r and Nsv(r) is the counterpart for pairs with one molecule on the surface and the other inside the cluster.
Pore-size Function and Lineal-Path Function
The pore-size function F(r) can be obtained by integrating the pore-size probability density function f(r), which provides the distribution of the maximal distance from a randomly selected point in the “pore” phase to the two-phase interface. We note here that “pore” phase is just used to refer a generic phase which is necessarily to be void. To compute the probability density function f (and thus the pore-size function F), the pixels are again partitioned into the surface set τS and the volume set τV. Then the maximal distance from each pixel in τV to the associated boundary pixel in τS is computed and a histogram is generated to obtain f. A numerical integration of f will lead to the pore-size function F.
The lineal path function L (and hence the chord-length density p) is computed by only sampling along orthogonal directions consistent with the underlying lattice of the digitized microstructure. This method has been well documented in literature [22,23,54,55], and hence will not be elaborated here.
Stochastic Microstructure Reconstruction
The Yeong-Torquato Procedure
The stochastic optimization reconstruction procedure introduced by Yeong and Torquato [22,23] is ideally suited here because it can incorporate any types of statistical descriptors. The Yeong-Torquato procedure has become a popular reconstruction technique [57-61] because it is both robust and simple to implement. Consider a given set of correlation functions of the phase of interest that provides partial information on the microstructure of the medium. The superscript a denotes the type of correlation functions, and the subscript n denotes the order. The information contained in could be obtained either from experiments or it could represent a hypothetical medium based on simple models. In both cases we would like to recover or generate the underlying microstructure. In the former case, the formulated inverse problem is frequently referred to as a “reconstruction” procedure, and in the latter case as a “construction”. The (re)construction problem can be formulated as an optimization problem in which the discrepancies between the statistical properties of the generated structure and the imposed ones are minimized. This is achieved by introducing the “energy” function E, defined as a sum of squared differences between target correlation functions which we denote by and those calculated from generated structures, i.e.,
For every generated structure (configuration), there is a set of corresponding If we consider every structure (configuration) as a “state” of the system, E can be considered as a function of the states. The optimization technique suitable for the problem at hand is the method of simulated annealing, the concept of which is based on a well-known physical fact: if a system is heated to a high temperature T and then sufficiently slowly cooled down to absolute zero, the system equilibrates to its ground state. At a given temperature T, the probability of being in a state with energy E is given by the Boltzmann distribution P(E) ~ exp(-E/T ). At each annealing step k, the system is allowed to evolve long enough to equilibrate at T(k). The temperature is then lowered according to a prescribed annealing schedule T(k) until the energy of the system approaches its ground state value within an acceptable tolerance. It is important to keep the annealing rate slow enough in order to avoid trapping in some metastable state.
For our problem, the discrete configuration space includes the states of all possible pixel allocations. Starting from a given state (current configuration) with energy Eold, a new state (trial configuration) can be obtained by randomly moving an arbitrarily selected pixel (“gas molecule”) of the phase of interest. This simple evolving procedure preserves the volume fraction of all involved phases and guarantees ergodicity in the sense that each state is accessible from any other state by a finite number of steps. However, in the later stage of the procedure, biased and more sophisticated pixel (“molecule”) selection rules, i.e., surface optimization, could be used to improve the efficiency [23]. Then the correlation functions of the trial configuration are computed to obtain the energy Enew of this new state. Whether the trial configuration will be accepted or rejected is based on the Metropolis criterion: the acceptance probability P is given by
The temperature T is initially chosen so that the initial acceptance probability of trial configurations with Enew > Eold averages approximately 0.5. An inverse logarithmic annealing schedule which decreases the temperature according to T(k) ~ 1/ln(k) would in principle evolve the system to its ground state. However, such a slow annealing schedule is difficult to achieve in practice. Thus, we will adopt the more popular and faster annealing schedule T(k)/T (0) = λk, where constant λ must be less than but close to unity. This may yield suboptimal results, but, for practical purposes, it will be sufficient. The convergence to an optimum is no longer guaranteed, and the system is likely to freeze in one of the local minima if the equilibration and annealing rate are not adequately chosen.
Cluster and Surface Events: Efficient Updating Correlation Functions
The aforementioned stochastic reconstruction procedure requires generating and sampling a large number of configurations. The efficient and isotropic sampling method introduced in Sec. 3.A also enables one to quickly re-compute the desired correlation functions of the new configuration based on the old ones, and thus make the incorporation of those functions feasible: direct re-sampling is too computationally expensive to implement in practice. In this section, we present the details for efficiently updating the correlation functions.
A distance matrix Dij storing the separation distances of all “molecule” pairs is established when the system is initialized and the “molecules” are partitioned into different “species” depending on their positions. The quantities NP, NiP, Nss, and Nsv can be obtained by binning the distances of corresponding pairs. For NP one simply bins the distances of all “molecule” pairs. For example, for NiP one needs to consider only the distances between two “molecules” belonging to the same cluster; for Nsv and Nss the distances between “molecule” pairs in which one “molecule” belongs to the surface set and the other belongs to the volume set, and the distances between “molecules” on the surface, respectively, are considered. The motion of the randomly chosen “molecule” could result in changes of the distances between it and all the other “molecules” as well as two kinds of “species” events. The first kind involves breaking and combining clusters: if the chosen “molecule” happens to be the “bridge” between two sub-clusters, removing the “bridge” would make the original single cluster break into two pieces, i.e., a new “species” is generated; similarly, the reverse of the above process would lead to combination of clusters and annihilation of “species”. The other kind of “species” event is the transition of “molecules” between surface and volume “species”: if a surface “molecule” is removed, certain volume “molecules” would now constitute the new surface and vice visa; the chosen “molecule” could also undergo such transitions depending on its original and new positions, e.g., an volume “molecule” originally inside a cluster could be moved outside and becomes a surface “molecule”.
The old contributions of the number of distance pairs to NP, NiP, Nss, and Nsv from the “molecules” undergone the “species” transitions due to the moved “molecule” are computed and subtracted accordingly; the new contributions can be obtained by binning the distances of “molecule” pairs belonging to particular new “species” and are added to the corresponding quantities. This method only requires operations on a finite small number of “molecules”, including retrieving and binning their separation distances and updating the “species” sets. The distance matrix Dij would speed up the former process; however, for very large systems (including millions of “molecules”) storing Dij requires very large memory space on a computer. An alternative is to re-compute the distances involving the “molecules” undergone the “species” transitions for every trial configuration instead of explicitly storing all distances. This may slightly slow down the process but make it easy to handle very large systems. Correlation functions of the new configuration could be obtained by dividing updated NP, NiP, Nss, and Nsv by NS, as discussed in Sec. 3.A. The complexity of the algorithm is linear in the total number of “molecules” within the system.
Applications
The generalized lattice-point method has been employed to reconstruct a wide spectrum of statistically homogeneous and isotropic random media, including both theoretical model microstructures [1] and digitized representations of real materials. Each of the two-point functions considered depends only on scalar distance. In the following, we will present in details several reconstruction examples to illustrate the utility of the GLP method, which include “clustered” RSA disks (explained below), a metal-ceramic composite [62], a two-dimensional slice of a Fontainebleau sandstone [54,55] and a laser-speckle pattern [27].
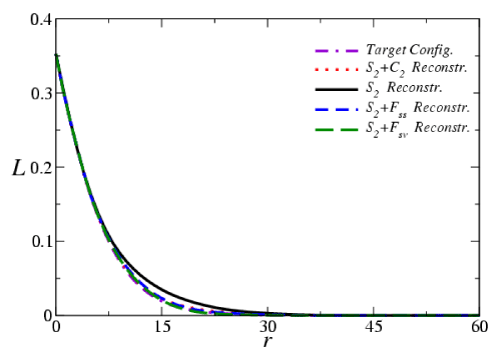
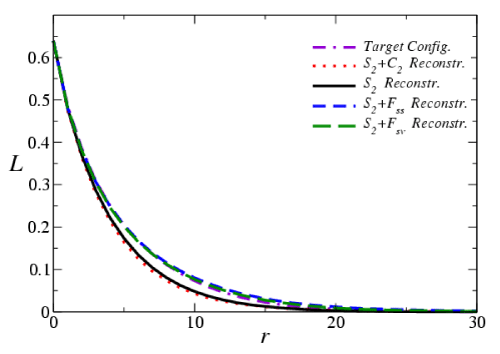
Reconstructions from various combinations of the standard two-point correlation function S2(r), the surface correlation functions Fss(r) and Fsv(r) and the two-point cluster function C2(r) are shown here. (Since the pore-size function F(r) only contains partial connectedness information, reconstructions based on F are expected to be inferior to those incorporated C2.) For any target configuration, one must choose different cooling schedules for different choices of the set of target correlation functions in order to achieve the same final energy E (or error), which is of order 108-1011, depending on the example. The accuracy of a reconstruction can be ascertained quantitatively by measuring correlation functions other than the targeted ones and comparing the other correlation functions to those of the original medium. Here we measure the lineal-path function L(r) of each reconstruction and compare with that sampled from the target media. We will see the results clearly indicate that when the phase of interest is not percolating, C2(r) not only contains appreciable more microstructural information than S2, but more than a variety of other “two-point” quantities.
“Clustered” RSA Disks
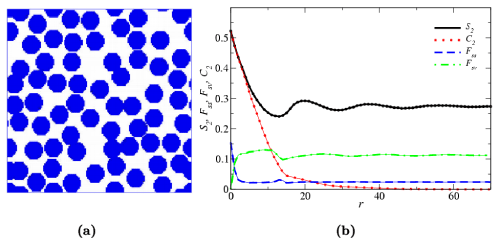
Figure 2 shows a two-dimensional realization of packing circular disks and the target correlation functions of the particle phase (shown in blue). To obtain the target system in Figure 2(a), a random sequential addition (RSA) distribution of hard disks is generated [1] and then several randomly chosen disks are brought into proximity with one another to form complex “clusters”, and thus are called “clustered” RSA disks.
Figure 2: (a) Target configuration: a “clustered” RSA disk system as described in the text. The volume fraction of the particle phase (shown in blue) is 0.523 and the volume fraction of the void phase (shown in white) is 0.477. (b) The correlation functions of target and reconstructed systems: various tick curves correspond to the target functions; the thin solid curves correspond to the reconstructed functions.
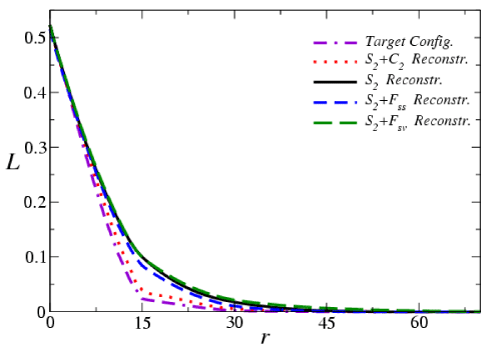
Figure 3 shows that the reconstruction using S2 alone overestimates clustering in the system and incorrectly yields a percolating “particle” phase. Thus, although S2 of the “particle” phase of the reconstructed realization matches that of the target one with very small error (E~109), such information is insufficient to get a good reconstruction. Incorporating both S2 and surface correlation functions Fss(r) or Fsv(r) leads to better renditions of the target system but the reconstructions still overestimate the degree of clustering. On the other hand, incorporating C2 of the particle phase yields the best reconstruction. Although the latter is still not perfect, it is clear that it has the essential features of the actual dispersion, such as the presence of individual circular disks as well as small clusters. The lineal-path functions of the target and reconstructed systems are shown in Figure 4. Again, L of the S2-C2 hybrid reconstruction matches the target lineal-path function (unconstrained in the reconstruction) much better than the others.
Figure 3: Reconstructed “clustered” RSA disk systems: (a)S2-alone reconstruction. (b)S2-Fss reconstruction. (c)S2-Fsv reconstruction. (d)S2-C2 reconstruction.
Figure 4: The lineal-path function L(r) of the target and reconstructed systems.
Metal-Ceramic Composite
A two-dimensional digitized image of a boron-carbide/ aluminum (B4C/Al) interpenetrating composite and the target correlation functions of the aluminum phase (shown in white) are shown in Figure 5 [23,56]. Figure 6 shows the reconstructions, which all well match the target image visually. However, the reconstruction incorporating C2 has the minimum sum of absolute discrepancies between the measured and target lineal-path functions (Figure 7), indicating it is superior to other statistical descriptors utilized. The S2- alone reconstruction again overestimates the clustering in the system, leading to larger values of L for intermediate range of r.
Figure 5: (a) Target configuration: a digitized image of a boron-carbide/aluminum composite. The black phase is boron carbide with volume fraction 0.647 and the white phase is aluminum with volume fraction 0.353. (b) The correlation functions of target and reconstructed configurations: various tick curves correspond to the target functions; the thin solid curves correspond to the reconstructed functions.
Figure 6: Reconstructed configurations of the boron-carbide/aluminum composite: (a) S2-alone reconstruction. (b) S2-Fss reconstruction. (c) S2-Fsv reconstruction. (d) S2-C2 reconstruction.
Figure 7: The lineal-path function L(r) of the target and reconstructed configurations.
Fontainebleau Sandstone
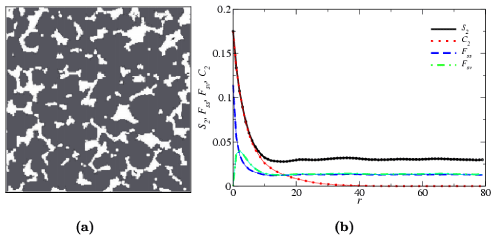
Figure 8(a) shows a tomographic image of a two-dimensional (2D) slice of Fontainebleau sandstone [54,55,63]. Sandstone is a porous material that has important applications in geophysical science and petroleum engineering. The volume fraction (porosity) and the topology of the pore phase (shown in white) are crucial to the physical properties of the sandstone, such as fluid permeability and relaxation times. The correlation function of the pore phase is shown in Figure 8(b).
Figure 8: a) Target configuration: a microstructural image of a slice of a Fontainebleau sandstone. The volume fraction of the rock phase (shown in gray) is 0.825 and the volume fraction of the porous phase (shown in white) is 0.175. (b) The correlation functions of target and reconstructed configurations: various tick curves correspond to the target functions; the thin solid curves correspond to the reconstructed functions.
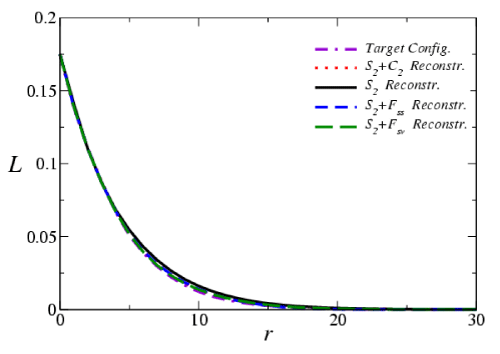
The reconstructions are shown in Figure 9. In two dimensions, the pore phase corresponds to topologically disconnected regions enclosed by complicated concave contours. This feature is best captured in the S2-C2 reconstruction. Although the average size of the pore regions in other reconstructions also match the target well, as can be seen from the comparison of the lineal-path functions (Figure 10), their shapes are not very satisfactory. Note that even the discrepancies of the S2-alone reconstructions of the metal-ceramic composite and the Fontainebleau sandstone are not that significant as in the first two examples, which is consistent with our conclusion in Reference [27] that S2 is able to model the structures the two materials to a high accuracy.
Figure 9: Reconstructed configurations of the slice of the Fontainebleau sandstone: (a) S2-alone reconstruction. (b) S2-Fss reconstruction. (c) S2-Fsv reconstruction. (d) S2-C2 reconstruction.
Figure 10: The lineal-path function L(r) of the target and reconstructed configurations.
Laser-Speckle Pattern
In all the aforementioned examples, the phases of interest are not percolating so that C2 could provide essential connectedness information and lead to the best reconstructions. When percolating clusters appear in the system, C2 will become long ranged and contain less additional structural information. In the limit that all pixels belong to a single percolating cluster, C2 and S2 become identical.
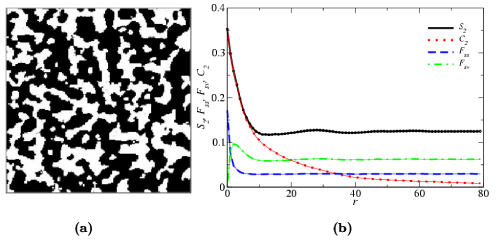
In this section, we study a binary laser-speckle pattern exhibiting a multi-scale structure, in which both phases are percolating [64]. In Reference [27] we pointed out that the structural information contained in S2 is averaged out over the several length scales of the pattern and the S2-alone reconstruction produced a typical Deybe-random microstructure (containing clusters of “random shapes and sizes”) [26] associated with the exponentially decreasing S2, instead of generating a multi-scale pattern.
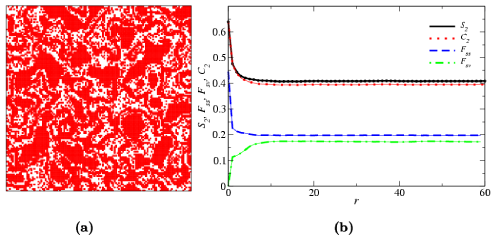
Figure 11(b) shows the target correlation functions of the red phase. It can be seen that C2 is long-ranged and almost identical with S2 except for large r values. This indicates that the medium contains a single large cluster composing most of the pixels; the discrepancies between C2 and S2 are due to the “background noise”, i.e., individual pixels dispersed in the white phase. Also the information in C2 is averaged over the length scales. These could all make C2 less efficient than in the other examples.
Figure 11: (a) Target configuration: a digitized image of a binary laser-speckle pattern. The volume fraction of the red phase is 0.639, and the volume fraction of the white phase is 0.361. (b) The correlation functions of target and reconstructed configurations: various tick curves correspond to the target functions; the thin solid curves correspond to the reconstructed functions.
Indeed as we can see in Figure 12, S2-alone and S2-C2 reconstructions produce similar microstructures of Debye-random type. The reconstructions using surface correlation functions are better in the sense that they contain compact regions of similar sizes with those in the target medium, as can be seen from the sampled lineal-path functions (Figure 13). In other words, in the best reconstruction of the laser-speckle pattern we obtained, only the structures on the largest length scale could be resolved; the filamentary structures connecting the compact clusters in the target medium seem to mix up with the “noise” pixels in the reconstructed media and are not observed.
Figure 12: Reconstructed configurations of the laser-speckle pattern: (a) S2-alone reconstruction. (b) S2-Fss reconstruction. (c) S2-Fsv reconstruction. (d) S2-C2 reconstruction.
Figure 13: The lineal-path function L(r) of the target and reconstructed configurations.
We emphasize that the failure of C2 in producing accurate renditions of the target medium here is due to two reasons: percolation of the phases and average of the length scales. The former could be possibly resolved by defining different pixel-connectivity rules. However, it is the latter makes the medium extreme difficult to reconstruct. To efficiently characterize multi-scale media, descriptors carrying non-trivial information on different length scales are necessary.
Conclusion
In this paper, we provide the algorithmic details of the generalized lattice-point method for heterogeneous material reconstruction. The GLP method based on the lattice-gas model of digitized random media enables one to incorporate the widest class of lower-order correlation functions utilized to date into the Yeong-Torquato stochastic reconstruction technique. Thus one could use various combinations of those correlation functions to generate renditions of the microstructures of interest with high accuracy and determine the most sensitive statistical descriptors for the material of interest. To illustrate its utility, we apply the GLP procedure to reconstruct a wide spectrum of random media, including “clustered” RSA disks, a metal-ceramic composite, a two-dimensional slice of a Fontainebleau sandstone and a binary laser-speckle pattern, among other examples. Except for the laser-speckle pattern with a multi-scale microstructure with percolating phases, reconstructions incorporating C2 always give the best renditions of the target medium. We note that a few past investigations have recognized the need to use descriptors containing connectedness information, such as the lineal-path function L [22,23] and the pore-size distribution function F [57]. Those quantities only crudely reflect this crucial topological information and the reconstructions using C2 are always found to be much more accurate than those involving L or F.
As we pointed out in [48], C2 is a superior microstructural signature because it is extremely sensitive to topologically connectedness information and becomes a progressively longer-ranged function as clusters increase in size in the system. By contrast, the quantities S2, L, F, Fss and Fsv are insensitive to crossing the percolation threshold. Thus, for statistically homogeneous and isotropic media in which the phase of interest was below its percolation threshold and contains essentially compact clusters of that phase, incorporation of C2 in reconstructions of such media could provide renditions of the target structure with heretofore unattained accuracy.
The unsuccessful reconstructions of the laser-speckle pattern are mainly because that structural information on different length scales are averaged out, and currently only the structures on the largest scale can be resolved. To capture the salient features of the multi-scale structures, statistical descriptors containing information on different length scales are necessary. The fluctuations of local properties, such as local volume fraction [65-67] or surface area are possible candidates, which give the fluctuations of local properties for different sized observation windows. Interestingly, our preliminary calculations show that these quantities could indeed capture structural features on different length scales.
Although we focused on the reconstruction problems here, the potential applications of the new method in the constructions should not be underestimated. Besides S2, the properties of other “two-point” function are less well studied. The conditions (both necessary and sufficient) for a hypothetical correlation function to be realizable, i.e., whether it corresponds to a particular microstructure, have not been systematically considered. Progress in these related topics would open new doors for many fruitful applications. Our reconstruction technique is ideally suitable to explore the nature of these “two-point” functions and would lead to a better understanding of their properties. Moreover, given a particular correlation function such as the two-point correlation function, one could generate a family of microstructures with identical S2 but different C2 or Fsv, etc., which could lead to development of new schemes to model complex microstructures.
Acknowledgement
This work was supported by the Division of Materials Research at the National Science Foundation under award No. DMR-1305119 (Dr. Diana Farkas, program manager). Y. J. also thanks Arizona State University for the generous start-up funds.
References
- Torquato S. Random Heterogeneous Materials: Microstructure and Macroscopic Properties. New York: Springer-Verlag. 2002.
- Sahimi M. Heterogeneous Materials I: Linear Transport and Optical Properties. New York: Springer-Verlag. 2003.
- Sahimi M. Heterogeneous Materials II: Nonlinear and Breakdown Properties and Atomistic Modeling. New York: Springer-Verlag. 2003.
- Lindquist WB, Venkatarangan A, Dunsmuir J, Wong T. Pore and throat size distributions measured from synchrotron X-ray tomographic images of Fontainebleau sandstones. J. Geophys. Res. 2000; 105: 21509-21527.
- Peebles PJE. Principles of Physical Cosmology. Princeton University Press. Princeton. New Jersey. 1993.
- Gabrielli A, Sylos Labini F, Joyce M, Pietronero L. Statistical Physics for Cosmic Structures. New York: Springer-Verlag. 2005.
- Pommerening A, Stoyan D. Reconstructing spatial tree point patterns from nearest neighbour summary statistics measured in small subwindows. Can J For Res. 2008; 38: 1110-1122.
- Kherlopian AR, Song T, Duan Q, Neimark MA, Po MJ, Gohagan JK, et al. A review of imaging techniques for systems biology. BMC Syst Biol. 2008; 2: 74.
- Askeland DR, Phule PP. The Science and Engineering of Materials. Cengage Learning. 2005.
- Torquato S. Exact Expression for the Effective Elastic Tensor of Disordered Composites. Phys. Rev. Lett. 1997; 79: 681.
- Torquato S. Effective stiffness tensor of composite media: II. Applications to isotropic dispersions. J. Mech. Phys. Solids. 1998; 46: 1411-1440.
- Rechtsman MC, Torquato S. Effective dielectric tensor for electromagnetic wave propagation in random Media. J. Appl. Phys. 2008; 103: 084901.
- Niezgoda SR, Kanjaria RK, Kalidindi SR. Novel microstructure quantification framework for databasing, visualization, and analysis of microstructure data. Inter Mater Manu Innov. 2013; 2: 3.
- Callahan PG. Quantitative characterization and comparison of precipitate and grain shape in Ni-base superalloys using moment invariants [Dissertation]. Carnegie Mellon University, 2012. /a>
- Frary ME, Schuh CA. Correlation-space description of the percolation transition in composite microstructures. Phys Rev E Stat Nonlin Soft Matter Phys. 2007; 76: 041108.
- Wilding SE, Fullwood DT. Clustering metrics for two-phase composites. Comput Mater Sci. 2011. 50: 2262-2272. /a>
- Groeber M, Ghosh S, Uchic MD, Dimiduk DM. A framework for automated analysis and simulation of 3D polycrystalline microstructures. Part 1: Statistical characterization. Acta Mater. 2008; 56: 1257-1273.
- Cooper WO, Cheetham TC, Li DK, Stein CM, Callahan ST, Morgan TM, et al. Brief report: Risk of adverse fetal outcomes associated with immunosuppressive medications for chronic immune-mediated diseases in pregnancy. Arthritis Rheumatol. 2014; 66: 444-450.
- Fullwood DT, Niezgod SR, Adams BL, Kalidindi SR. Microstructure sensitive design for performance optimization. Progress in Materials Science. 2010; 55: 477-562.
- Mikdam A, Belouettar R, Fiorelli D, Hu H, Makradi A. A tool for design of heterogeneous materials with desired physical properties using statistical continuum theory. Mater Sci Eng A. 2013; 564: 493.
- Liu Y, Greene MS, Chen W, Dikin DA, Liu WK. Computational microstructure characterization and reconstruction for stochastic multiscale material design. Computer-Aided Design. 2013; 45: 65.
- Yeong CLY, Torquato S. Reconstructing random media. II. Three-dimensional media from two-dimensional cuts. Phys. Rev. 1998; E 57: 495.
- Yeong CLY, Torquato S. Reconstructing random media. II. Three-dimensional media from two-dimensional cuts. Phys. Rev. 1998. E 58: 224.
- Cule D, Torquato S. Generating random media from limited microstructural information via stochastic optimization. J Appl Phys. 1999; 86: 3428.
- Sheehan N, Torquato S. Generating microstructures with speci?ed correlation functions. J Appl Phys. 2001; 89: 53.
- Jiao Y, Stillinger FH, Torquato S. Modeling heterogeneous materials via two-point correlation functions: Basic principles. Phys Rev. 2007; E 76: 031110.
- Jiao Y, Stillinger FH, Torquato S. Modeling heterogeneous materials via two-point correlation functions. II. Algorithmic details and applications. Phys Rev. 2008; E 77: 031135.
- Rozman MG, Utz M. Uniqueness of reconstruction of multiphase morphologies from two-point correlation functions. Phys Rev Lett. 2002; 89: 135501.
- Roberts AP. Statistical reconstruction of three-dimensional porous media from two-dimensional images. Phys. Rev. 1997; E 56: 3203.
- Fullwood DT, Kalidindi SR, Niezgoda SR, Fast A, Hampson N. Gradient-based microstructure reconstructions from distributions using fast Fourier transforms. Mater Sci Eng. 2008; 494: 68-72.
- Fullwood DT, Niezgoda SR, Kalidindi SR. Microstructure reconstructions from 2-point statistics using phase-recovery algorithms. Acta Mater. 2008; 56: 942-948.
- Hajizadeh A, Safekordi A, Farhadpour FA. A multiple-point statistics algorithm for 3D pore space reconstruction from 2D images. Advances in Water Resources. 2011; 34: 1256-1267.
- Tahmasebi P, Sahimi M. Cross-Correlation Function for Accurate Reconstruction of Heterogeneous Media. Phys. Rev. Lett. 2013; 110: 078002.
- Jiao Y. Three-Dimensional Heterogeneous Material Microstructure Reconstruction from Limited Morphological Information via Stochastic Optimization. AIM Materials Science. 2014; 28.
- Jiao Y, Chawla N. Three dimensional modeling of complex heterogeneous materials via statistical microstructural descriptors. Integrating Materials and Manufacturing Innovation. 2014; 3: 3.
- Torquato S. Exact conditions on physically realizable correlation functions of random media. J Chem Phys. 1999; 111: 8832.
- Torquato S. Necessary Conditions on Realizable Two-Point Correlation Functions of Random Media. Ind. Eng. Chem. Res. 2006; 45: 6923.
- Tahmasebi P, Sahimi M. Reconstruction of three-dimensional porous media using a single thin section. Phys Rev E Stat Nonlin Soft Matter Phys. 2012; 85: 066709.
- Chen D, Teng Q, He X, Xu Z, Li Z. Stable-phase method for hierarchical annealing in the reconstruction of porous media images. Phys Rev E Stat Nonlin Soft Matter Phys. 2014; 89: 013305.
- Baniassadi M, Garmestani H, Li DS, Ahzi S, Khaleel M, Sun X. Three-phase solid oxide fuel cell anode microstructure realization using two-point correlation functions. Acta Materialia. 2011; 59: 30-43.
- Singh S, Williams JJ, Jiao Y, Chawla N. Modeling Anisotropic Multiphase Heterogeneous Materials via Directional Correlation Functions: Simulations and Experimental Verification. Metallurgical and Materials Transactions. 2012; 43: 4470-4474.
- Jiao Y, Chawla N. Modeling and characterizing anisotropic inclusion orientation in heterogeneous material via directional cluster functions and stochastic microstructure reconstruction. Journal of Applied Physics. 2014; 115: 093511.
- Guo EY, Chawla N, Jing T, Torquato S, Jiao Y. Accurate modeling and reconstruction of three-dimensional percolating filamentary microstructures from two-dimensional micrographs via dilation-erosion method. Materials Characterization. 2014; 89: 33.
- Jiao Y, Padilla E, Chawla N. Modeling and predicting microstructure evolution in lead/tin alloy via correlation functions and stochastic material reconstruction. Acta Materialia. 2013; 61: 3370.
- Blacklock M, Bale H, Begley MR, Cox BN. Generating virtual textile composite specimens using statistical data from micro-computed tomography: 1D tow representations for the Binary Model. J Mech Phys Solids. 2012; 60: 451-470.
- Rinaldi R, Blacklock M, Bale H, Begley MR, Cox BN. Generating virtual textile composite specimens using statistical data from micro-computed tomography: 3D tow representations. J Mech Phys Solids. 2012; 60: 1561-1581.
- Debye P, Anderson HR, Brumberger H. Scattering by an Inhomogeneous Solid. II. The Correlation Function and Its Application. J Appl Phys. 1957; 28: 679.
- Jiao Y, Stillinger FH, Torquato S. A superior descriptor of random textures and its predictive capacity. Proc Natl Acad Sci. 2009; 106: 17634-17639.
- A cluster of phase i is defined as the part of phase i that can be reached from a point in phase i without passing through phase j? i.
- Lu B, Torquato S. Lineal-path function for random heterogeneous materials. Phys Rev A. 1992; 45: 922-929.
- Chords are the line segments between the intersections of an in¯nitely long line with the two-phase interface.
- Torquato S, Lu B. Chord-length distribution function for two-phase random media. Phys Rev E Stat Phys Plasmas Fluids Relat Interdiscip Topics. 1993; 47: 2950-2953.
- Torquato S, Beasley JD, Chiew YC. Two-point cluster function for continuum percolation. J Chem Phys. 1988; 88: 6540.
- Coker D, Torquato S. Extraction of morphological quantities from a digitized medium. J Appl Phys. 1995; 77: 6087.
- Coker DA, Torquato S, Dunsmuir J. Morphology and physical properties of Fontainebleau sandstone via a tomographic analysis. J Geophys Res. 1996; 10: 17497.
- Stauffer D, Aharony A. Introduction to Percolation Theory. London: Taylor & Francis. 1994.
- Manwart C, Hilfer R. Reconstruction of random media using Monte Carlo methods. Phys Rev E Stat Phys Plasmas Fluids Relat Interdiscip Topics. 1999; 59: 5596-5599.
- Wu K, Dijke MIJ, Couples GD, Jiang Z, Ma J, Sorbie KS, et al. 3D stochastic modelling of heterogeneous porous media - Applications to reservoir rocks.Transport in Porous Media. 2006; 65: 443-467.
- Ansari MA, Stepanek F. Design of granule structure: Computational methods and experimental realization. AlChE Journal. 2006; 52: 3762-3774.
- Basanta D, Miodownik MA, Holm EA, Bentley PJ. Using genetic algorithms to evolve three-dimensional microstructures from two-dimensional micrographs. Metall Mater Trans. 2005; 36: 1643-1652.
- Kumar H, Briant CL, Curtin WA. Using microstructure reconstruction to model mechanical behavior in complex microstructures. Mech Mater. 2006; 38: 818-832.
- Torquato S, Yeong CLY, Rintoul MD. Milius DL, Aksay IA. Elastic Properties and Structure of Interpenetrating Boron Carbide/Aluminum Multiphase Composites. J Am Ceram Soc. 1999; 82: 1263.
- Manwart C, Torquato S, Hilfer R. Stochastic reconstruction of sandstones Phys Rev E Stat Phys Plasmas Fluids Relat Interdiscip Topics. 2000; 62: 893-899.
- The pixels are considered connected if they meet at the corners. Thus it is possible to have bi-percolation even in two dimensions.
- Lu B, Torquato S. Local volume fraction fluctuations in heterogeneous media. J Chem Phys. 1990; 93: 3452.
- Quintanilla J, Torquato S. Local volume fraction fluctuations in random media. J Chem Phys. 1997; 106: 2741.
- Quintanilla J, Torquato S. Local volume fraction fluctuations in periodic heterogeneous media. J Chem Phys. 1999; 110: 3215.
