
Research Article
Austin J Nutr Metab. 2023; 10(1): 1130.
Fatty Acid Metabolism is Associated with Immune Microenvironment Variation in Bladder Cancer, and FN1 May Mediate PD-L1 Expression through the IL6-STAT3 Pathway
Kexin Bai2#; Kai Zhao1#; Zhonglei Deng1#; Jingyuan Tang1; Qiang Song2*; Yan Xu1*; Jie Han1*
¹Department of Urology, Jiangsu Province Hospital of Chinese Medicine, Affiliated Hospital of Nanjing University of Chinese Medicine, Nanjing 210029, PR China
²Department of Urology, The First Affiliated Hospital of Nanjing Medical University, Nanjing 210029, PR China
*Corresponding author: Yan Xu & Jie Han Department of Urology, Jiangsu Province Hospital of Chinese Medicine, Affiliated Hospital of Nanjing University of Chinese Medicine, Nanjing 210029, PR China;
Qiang Song, Department of Urology, The First Affiliated Hospital of Nanjing Medical University, Nanjing 210029, PR China. Tel: +86 25 86528546; Fax: +86 25 86528546 Email:qiangsong121@163.com; xuyan3615@sina.com; 867262505@qq.com
#These authors contributed equally to this work.
Received: October 12, 2023 Accepted: November 15, 2023 Published: November 22, 2023
Abstract
Background: Fatty acid metabolism plays an important role in many biological activities, such as cell membrane formation, energy storage, and signal molecule generation in tumorigenesis. Lipid metabolism affects the progression and treatment of Bladder Cancer (BLCA). Therefore, it is imperative to explore the function and prognostic value of lipid metabolism-related genes in BLCA patients.
Methods: In this study, we collected gene expression profiles and clinical information in The Cancer Genome Map (TCGA) database and two independent Group on Earth Observations (GEO) datasets. Gene interaction information was obtained from ENCORI database. Based on these databases, we analyzed the expression patterns of genes and proteins involved in fatty acid metabolism and their matching clinicopathological features. Further, the gene for fatty acid metabolism, FN1, was screened for cellular function science experiments to validate our findings.
Results: Analysis in the TCGA database identified 310 fatty acid metabolism-related mRNAs, 91 of which were differentially expressed in BLCA patients. Based on the correlation of Differentially Expressed Genes (DGEs) with patient characteristics, we developed a clinical prognostic correlation model and validated the accuracy of the model based on information from the GEO database. Survival analysis and clinical correlation analysis showed that elevated FN1 levels were highly correlated with shorter survival, higher staging, higher grading, and lower infiltration of immune cells in BLCA. Furthermore, we experimentally verified that FN1 can activate the IL6 -JAK - STAT3 pathway and further promote PD-L1 expression, which would serve as a potential factor for immune escape in bladder cancer. Finally, our experimental results were consistent with the bioinformatics analysis.
Keywords: Bladder cancer; Fatty acid metabolism; Immunotherapy; fn1
Abbreviations: BLCA: Bladder Cancer; FA: Fatty Acids; TCGA: The Cancer Genome Map; GEO: Group on Earth Observations; GO: Gene Ontology; KEGG: Kyoto Encyclopedia of genes and genomes
Background
BLCA is one of the most common malignant tumors, particularly in the middle-aged and elderly [1]. Although a variety of treatment methods have been developed in recent years, such as surgery, chemotherapy, and targeted therapy, most patients relapse after treatment, resulting in high medical costs and low quality of life [2]. In addition, BLCA is a disease with relatively high treatment cost, which causes a considerable disease burden to individuals and society [3]. Therefore, it is very important to explore new therapeutic targets and develop new prognostic models in BLCA [4].
Metabolic disorder is one of the characteristics of cancer [5]. Lipid metabolism reprogramming is one of the most significant metabolic changes observed in cancer cells and has attached more and more attention [6]. Fatty Acids (FA) are required for energy storage, membrane proliferation and signal molecule generation [7]. FA are important components of lipid metabolism, and their accumulation can meet the needs of lipid synthesis signal molecules and membranes [8]. Therapies targeting deregulated fatty acids in cancer may slow tumor growth and have synergistic effects with immune checkpoint inhibitors [9]. More than this, the prognostic value of fatty acid metabolism-related genes and their relationship with BLCA immunotherapy remain largely unknown. The gene set related to fatty acid metabolism in BLCA has not been systematically studied. Therefore, we think it is necessary to further explore the mechanism of fatty-acid metabolism genes involved in the tumorigenesis and development of BLCA.
In this study, we comprehensively evaluated the metabolic pattern of fatty acids by analyzing the genomic information of 433 BLCA samples. Combining the TCGA database and two independent GEO datasets, we analyzed the sequencing data of BLCA and constructed a fatty acid prognostic risk score model. The prognostic risk score model can independently predict the survival outcome of BLCA patients. We investigated the relationship between the prognostic risk score model and the characteristics of TME cell infiltration. Prognostic risk scoring model can effectively distinguish whether patients are sensitive to BLCA immunotherapy. Therefore, fatty acid metabolism is crucial in forming individual TME characteristics. We found that FN1 was significantly high expressed in tumor tissues of BLCA patients compared with tumor-adjacent tissue. In addition, the results of clinical correlation analysis showed that the expression of FN1 was related to the clinical stage, tumor invasion, and immune invasion of BLCA patients. By further exploring the possible molecular mechanism of FN1 in BLCA, we found that it is involved in immune escape. Recently, increasingly people pay attention to the role of CD8+T cells in tumor immunity [10-13]. Our analysis results indicate that FN1 may participate in tumor immune checkpoint blocking (PD-L1 and CTLA4). Finally, we detected the expression of FN1 in BLCA tissue samples and verified its potential significance. These findings provide a new perspective for exploring the metabolic mechanism and treatment of BLCA.
Methods
Data Collection and Processing
TCGA database (https://portal.gdc.cancer.gov/) was used to obtain transcriptome analysis data of BLCA tumors and tumor-adjacent tissue. Then, 19 normal samples and 433 BLCA samples were obtained. At the same time, the clinical information of the samples was obtained from TCGA database, and other BLCA related datasets were downloaded from GEO database (https://www.ncbi.nlm.nih.gov/geo/). The overview design of this study is displayed (Figure 1). We used the annotation platform to convert the entrez gene ID of each sample into the corresponding gene symbol. If the same entrez gene ID is targeted by multiple probes, the average value is used. We also downloaded the matched clinical and survival data from the TCGA queue, including gender, age, pathological stage, AJCC-TNM classification (TNM) stage, and prognosis information. Finally, 412 BLCA samples were included to form a training set of TCGA data. The original readings of the above data are processed and standardized in R software.
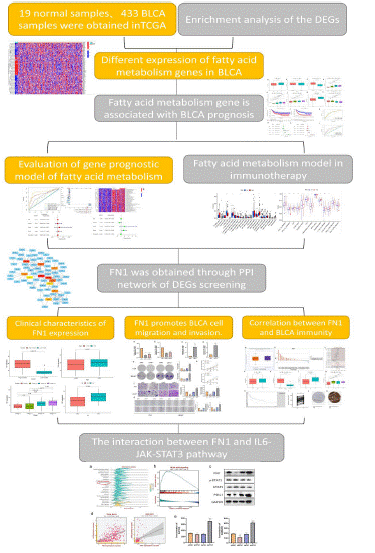
Figure 1: The overview design in this study.
Enrichment Analysis of the DEGs in Normal and Cancer Tissue Samples
We used "limma" R package to analyze genes related to fatty acid metabolism differentially expressed in normal and cancer tissue samples. The gene p<0.05 was statistically significant. The "clusterProfiler" R package was used for Gene Ontology (GO) and Kyoto Encyclopedia of Genes and Genomes (KEGG) pathway enrichment analysis of DEGs in BLCA tissues to determine the main biological characteristics and cellular functional pathways (p<0.05). Finally, we used the "enrichment map" and "ggplot2" R package to visualize the enrichment analysis results.
Development and Verification of a Prognostic Risk Score Mode
TCGA queue samples are classified as training sets for the development and validation of predictive risk scoring models, and GEO queue samples are used as test sets. First, we used the sample ID to combine the expression level of fatty acid metabolism related genes differentially expressed in each sample with the corresponding prognosis results. By univariate Cox regression analysis in the training set, genes related to prognosis were screened from DGEs related to lipid metabolism. Finally, the genes with p<0.05 were obtained. The "maftools" R package is used to analyze the mutation and correlation of genes in the BLCA samples of the training set. Prognostic related genes were further processed by "glmnet" R software package and LASSO Cox regression analysis. Based on these genes, we can develop a prognostic risk scoring model to predict OS of BLCA samples. The following formula can calculate the risk score of each sample:
The "Coef" represents the non-zero regression coefficient calculated by LASSO Cox regression analysis, and "Exp Gene" is the gene expression value from the prognostic risk scoring model. All samples were divided into low and high-risk scoring groups according to the median risk score. Kaplan Meier analysis and log-rank test were used to compare the OS difference between high and low risk scoring groups. The "survival ROC" R was used to draw the time-dependent ROC curve to evaluate the prediction accuracy of the prognostic risk scoring model. Finally, the reliability and applicability of the prognostic risk scoring model were further verified in the test set.
Principal-Component Analysis (PCA) Comparison Before and After Prognostic Risk Score Model
We used the “Limma” package to perform PCA on the gene expression profile before and after the prognostic risk scoring model in the training set to understand the significant difference between the high and low risk scoring groups. Firstly, PCA was performed on the expression profiles of all DGEs related to fatty acid metabolism. The gene expression profile from the prognostic risk score model was then analyzed using PCA. Finally, we used the “ggplot2” package to display the PCA results on a two-dimensional graph.
Correlation Analysis between Risk Score and Clinical Characteristics
In the TCGA queue, the “CMS caller” R package was used to classify all samples into CMS according to their characteristics, and then we combined the risk score of each sample with the clinical characteristics according to the sample ID. “limma” package was used to explore the relationship between risk scores and clinicopathological characteristics of BLCA patients, including gender, age, pathological stage, AJCC-TNM stage and CMS. In addition, the immune cell infiltration level obtained from TCGA database, was divided into high and low risk groups based on the median value. The difference of immune cell infiltration between the two groups was compared. Collected clinical information related to BLCA in GEO queue to determine the correlation between risk score and clinical characteristics. According to the clinical characteristics, the samples were divided into high risk and low risk groups to compare the difference of risk scores. Wilcoxon rank sum and Kruskal Wallis (K-W) test were used to compare two groups and more than two groups, respectively (p<0.05).
GSVA Analysis
GSVA is carried out on the gene spectrum through "GSVA" R package to compare the difference of biological processes between high and low rating groups. GSVA is a nonparametric and unsupervised method that can evaluate pathway changes or biological processes by expressing matrix samples. The gene set in the molecular signature database (https://www.gsea-msigdb.org/gsea/msigdb) is used as the reference gene set. FDR<0.05 indicates a statistically significant enrichment pathway.
PPI Network
Use STRING online database (https://cn.string-db.org//) to analyze DEGs to generate PPI network data with an interaction score >0.40 (median confidence). Then, the PPI network data is further processed and displayed using the Cytoscape software (version 3.7.2). Then the DGEs in para-carcinoma tissue and BLCA tissues were collected. The “cluster Profiler” R package was used for GO and KEGG enrichment analysis of genes. Finally, all samples were divided into low expression group and high expression group according to the median value of central gene expression. Kaplan Meier analysis was used to determine whether there was a difference in survival between the two groups. Comparison of immune cell infiltration in central genes related to prognosis.
Development of a Nomogram for Predicting OS
According to TCGA, "Rms" R package was used to build a nomogram with age, sex, pathological stage, and prognosis risk score model for the prediction of BLCA-OS. We respectively drawed calibration curves (1 year, 3 years, 5 years) to predict the accuracy of the nomogram. In addition, multivariate Cox regression analysis was used to verify whether the prognostic risk scoring model can be used as an independent indicator of BLCA-OS prediction. Then the AUC was calculated, and the predicted value of the nomogram was represented by the online ROC curve.
Bioinformatic Analysis of the Target Gene
The TIMER 2.0 database (http://TIMERgenomics.org.com) showed the differential expression of FN1 between BLCA tumors and para-carcinoma tissue. After analysis, it was found that FN1 in BLCA was significantly increased compared with the normal bladder tissues, and the paired differential expression analysis was conducted. We used TIMER2.0 to explore the distribution of tumor infiltrating CD8+T immune cells. In addition, it also proves the correlation between FN1 and immune checkpoints for cancer treatment (such as CTLA4 and PD-L1).
Cell Culture
BLCA cell lines (T24, BIU87) were purchased from the Typical Culture Collection Center of the Chinese Academy of Sciences (Shanghai, China), and 10% fetal bovine serum (FBS; Biological Industries, Israel) and 1% penicillin/streptomycin (Gibco, Thermo Fisher Scientific, USA) were included in the study. All cell lines were cultured at 37 in a humidified incubator containing 5% CO2.
Transfection
In order to reduce the expression of FN1 in T24 and BIU87 cells, the transfection was constructed by HANBIO (Shanghai, China) and produced three independent siRNAs targeting FN1 and a negative control siRNA. The targeted sequence follows si-FN1 # 1 (5'-CAGUCAAAGCAAGCCCGGUUGUUAU-3') or si-FN1 # 2(5 'CCAGAGUACGACUGUATT-3'). The control siRNA sequence was (5 ' UUCUCCGAACGUGUCACGUTT-3'). According to the manufacturer's scheme, siRNA was transfected by using Lipofectamine 3000 reagent (Invitrogen, Thermo-Fisher Scientific, USA). Then the lentivirus particles were transfected into the T24 and BIU87 cells. (Shanghai, China), and according to the manufacturer's instructions, it was transfected using Lipofectamine 3000 (Invitrogen, Carlsbad, CA, USA) to increase the expression of FN1. Detection was performed 48 hours after transfection.
Clinical Specimens
Bladder cancer tissues and their matched para-carcinoma tissue were taken from BLCA patients who underwent surgery in the Affiliated Hospital of Nanjing University of Chinese Medicine (Jiangsu Province Hospital of Chinese Medicine) from 2015 to 2022. The deadline for follow-up is June 2022. All patients signed the informed consent form before using the clinical materials. The Jiangsu Province Hospital of Chinese Medicine proved the organization used in this study.
RNA isolation and qRT PCR
Total RNAs were used to extract from bladder cancer tissues and cell lines using TRIzol-reagent (Invitrogen, Thermo-Fisher Scientific, USA) according to the manufacturer's instructions. Use HiScript II (Vazyme, China) to synthesize cDNA. qRT-PCR of mRNA was performed on StepOne Plus real-time PCR system (Applied Biosystems, USA). Each sample was repeated three times, and the data were analyzed by comparing CT values. Primer sequences include: FN1: " F: 5'-GAGAATAAGCTGTACCATCGCAA-3' "and" R: 5'-CGACCACATAGGAAGTCCCAG-3'; β-Actin: "F:GGAGATTACTGCCTGGCTCCA" and " R:GACTCATCGTACTCCTGCTTGCTG" , purchased from TSINGKE Biological Technology (Beijing, China). We calculated multiple changes in mRNA expression by 2-ΔΔCT method.
Cell Proliferation and Colony Formation Assay
For cell proliferation assay, cells were evenly spread in a 96-well plate with the density of 2000 cells/well. At 24, 48, 72 and 96 hours after inoculation, the cells were incubated in 10μl /well CCK-8 diluted for 1 hour. We use a microplate reader (Tecan, Switzerland) to measure the absorbance of cells at 450nm. For colony formation assay, cells were inoculated on 6-well plates at the rate of 1000 cells/well (T24), and incubated in 5% CO2 at 37°C for 2 weeks. After fixed with methanol, the cells were stained with 0.1% crystal violet for 30 minutes, and then the colonies were imaged and counted.
Wound Scratch Assay
To determine the effect of FN1 on cell migration. We uniformly inoculate the transfected T24 cells in a 6-well plate. When the cell density reaches 90-95%, using 200 μl tip of the pipette draws a straight wound through the cell layer. The cells were washed with Phosphate Buffered Saline (PBS) to remove the isolated cells and kept at 37°C in a humidified incubator containing 5% CO2. The digital camera system (Olympus, Tokyo, Japan) was used to take images of wound closure at 0 and 24 hours.
Protein Extraction and Western Blot
Tissues or cells are lyzed by RIPA buffers (Sigma, USA). The concentration of total protein extract was determined by BCA assay (Beyotime, China). The proteins were isolated and transferred to Polyvinylidene Fluoride (PVDF) membrane (Millipore, USA) by SDS-PAGE. The PVDF membranes were incubated with primary (Cell Signaling and Technology, USA) and secondary antibodies (Protech, USA) after blocking with 5% skim milk. The protein levels were evaluated using Chemiluminescence (Bio-Rad, USA) and Image Lab Software.
Enzyme-Linked Immunosorbent Assay (ELISA)
FN1 were mock-infected or infected with lentivirus to express the FN1 gene, followed by collection of cell culture media at 2 days and analysis for IL-6 protein levels by Enzyme-Linked Immunosorbent Assay (ELISA) according to the manufacturer’s instructions (R&D Systems, Minneapolis, MN, USA, #Q6000B).
Statistical Analysis
Rank sum test was used to compare the differences between the two groups. K-W test was performed to compare three or more groups. Kaplan Meier analysis was used to evaluate the survival difference between low rating group and high rating group. Multivariate Cox regression analysis was performed to determine independent indicators for predicting BLCA-OS, ROC curve was drawn to evaluate the predictive effect of the prognostic risk scoring model and nomograph. All statistical analyses were performed using R 4.1.2 (p<0.05).
Results
Enrichment Analysis of Normal and Cancer Tissue Samples
We identified DEGs between normal and BLCA samples in the TCGA database. Taking p value <0.05 as the critical criterion, a heat map (Figure 2a) was drawn to visualize the expression difference of DEGs in TCGA database in tumor samples and normal samples. In addition, by comparing the differences in gene expression between tumor samples and normal samples, a volcano map (Figure 2b) was drawn to visualize the changes in DEGs expression in TCGA database. Then, GO enrichment analysis was performed on DEGs. Fatty acid metabolism, fatty acid catabolism, and nucleoside diphosphate metabolism processes are highly enriched in GO terms in biological processes (Figure S1 a-c). The results of enrichment analysis of KEGG show that fatty acid degradation, metabolism, biosynthesis, and elongation are highly enriched KEGG terms (Figure S1 d-f). These results indicate that fatty acid metabolism plays an important role in the development of BLCA.
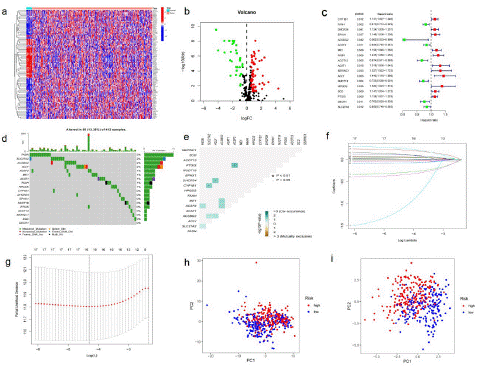
    Figure 2: Different expression of fatty acid metabolism genes in BLCA.

(a) A Heat map of DEGs related to fatty acid metabolism. (433 BLCAs and 19 para-carcinoma tissues from TCGA database) Red to blue bars indicate high to low gene expression. (b) Volcanic map of DEGs in TCGA-BLCA cohort. The red dot represents the upregulated gene, and the green dot represents the downregulated gene. (c) Forrest plot of 18 fatty acid metabolism-related genes related to prognosis. (d) Mutation frequency of 18 fatty acid metabolism related genes in 433 BLCA patients from TCGA cohort. (e) Analysis of co-occurrence and exclusion of mutations in 17 fatty acid metabolism-related genes. Co-occurrence: green; Exclude: brown. (f) LASSO coefficients of 17 genes related to fatty acid metabolism. (g) Identification of genes for the development of a prognostic risk score model. (h) Principal component analysis based on all fatty acid metabolism-related genes BLCA. (i) Principal component analysis based on fatty acid metabolic risk score to distinguish between tumor and normal samples in TCGA cohort. The groups marked red represent high-risk patients, and the groups marked blue represent low-risk patients.
Prognostic Risk Score Model Development in the Training Set
Samples from the TCGA cohort were classified into training sets. Univariate Cox regression analysis was performed on 91 differentially expressed fatty acid metabolism related genes. A total of 18 genes related to prognosis were identified, with a p value <0.05 (Figure 2c). The somatic mutation spectrum of 18 fatty acid metabolism-related genes related to prognosis was summarized. A total of 55 of the 412 BLCA samples had fatty acid metabolism-related gene mutations, with a frequency of 13.35%. A waterfall chart (Figure 2d) was drawn according to the mutation frequency and mutation type of patients, showing the gene mutations of metabolism-related deg. Gene mutations occur in BLCA patients, and FASN shows the highest mutation frequency. It is noteworthy that missense mutations are the main mutation type. In addition, the top 10 mutated genes are: FASN, SLC27A2, ACSBG2, ACLY, ACSF2, ME1, ACAT1, FAAH, HPGDS, CYP1B1. In BLCA samples, there was a mutation co-occurrence positive correlation between ACSF2 and PTGIS, ACLY and DHCR24, SLC27A2, and CYP1B1 (p<0.05) (Figure 2e). The minimum absolute shrinkage and selection algorithm (lasso) Cox regression analysis was then used to narrow the number of genes. Finally, 11 genes (CYP1B1, FAAH, ACSBG2, ACSF2, ME1, FASN, ACAT1, ACIY, HPGDS, PTGIS, and SLC27A2) were used to construct the prognostic risk scoring model (Figure 2f-g). The risk score of each sample was calculated using the following formula:
Risk score = (0.0560435202144054)×CYP1B1+(-0.0154535814114674)×FAAH+(-1.07303447229439) ×ACSBG2+(0.0329125914816619)×ACSF2+(0.0165131211400006)×ME1+(0.216902277328225)×FASN+(0.0169430515663676)×ACAT1+(0.251261830518137)×ACLY+(0.116126373391904)×HPGDS+(0.049187062817117) ×PTGIS+(-0.0709584697172027)×SLC27A2. The risk scoring model was used to completely distinguish BLCA samples (low-risk or high-risk) (Figure 2h and Figure 2i).
The Relationship between Risk Score and Clinical Features
The critical value is the median value of the risk score in the training set. According to the above cut-off values, the risk scores of the samples were sorted and divided into low-risk score group (and high-risk score group). The risk score distribution of the age, sex, pathological stage, and TNM stage of the American Joint Committee on Cancer (AGCC) of the corresponding samples was analyzed. Although there was no significant difference between risk scores and gender, higher risk scores were associated with higher age, high grade, advanced pathological stage, and AGCC-T (tumor invasion) stage, AGCC-N (lymphatic metastasis), AGCC-M (distal metastasis) (Figure 3a-g). In addition, we found that the risk score was related to the immune classification (p<0.05; Figure 3h). The prognosis of samples in the high-risk group was worse than that in the low-risk group (P<0.001; Figure 3i), indicating that the prognostic risk score model can predict the Overall Survival rate (OS) of BLCA (P=0.001; Figure 3j). The time-dependent subject operating characteristics (ROC) at 1, 3 and 5 years were plotted (Figure 3k) to verify the sensitivity of the prognostic risk scoring model (Figure 3l). For the validation of the prognostic risk score model, the test group samples from GEO were divided into low and high-risk score groups according to the threshold determined by the training set. Among the factors related to OS in univariate analysis, including age, pathological stage, and risk score (p<0.001; Figure 3m). Nevertheless, in multivariate analysis, risk score and pathological stage were independent predictors of OS (p<0.001; Figure 3n).
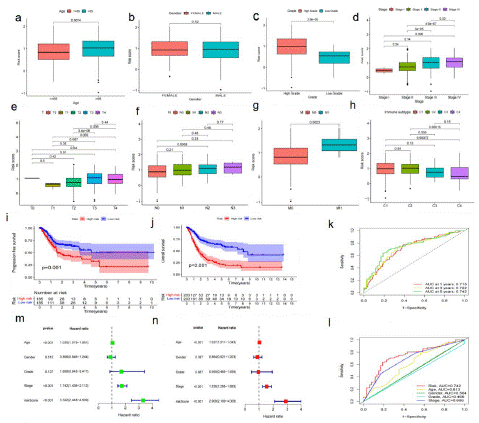
    Figure 3: The predictive value of fatty acid metabolism score model for the survival status of patients with bladder cancer.

(a-h) The relationship of risk score and clinicopathological features, including age (a), gender (b), tumor invasion (c), stage (d), AGCC-T (tumor invasion) stages (e), AGCC-N (f), AGCC-M (g), immune subtype (h). (i) The comparison progression-free survival (PFS) between low- and high- risk score groups in the training set and the test set, p value <0.05. (j) The comparison of OS between low- and high- risk score groups in the training set and the test set, p value <0.05. (k) The predictive values of the risk score measured by ROC curves in the training set. The AUC are 0.718 and 0.559. (l) The predictive value of the risk score measured by ROC curves. The test set, The AUC are 0.718 and 0.559. (m) The forest plot of the univariate Cox regression analysis in TCGA cohort. (n) The forest plot of the multivariate Cox regression analysis in TCGA cohort.
Construction of a Nomogram for Predicting the Survival of BLCA Patients
The Nomogram integrating age, sex, pathological stage, clinical grade, AGCC -T, N, M level, and prognostic risk score model was used for OS prediction of BLCA samples (Figure 4a).The calibration curves at 1, 3, and 5 years proved that the nomogram integrating age, sex, pathological stage, clinical grade, AGCC-T, N, M level and prognostic risk score model is used for OS prediction of BLCA samples (Figure 4b). Uniforest showed that clinicopathological stage (p<0.001) and Nomogram (p<0.001) were independent prognostic indicators (Figure 4c). The results of multiforest analysis show that Nomogram is a prognostic target (p<0.001; Figure 4d). The Area Under ROC Curve (AUC) shows that Nomogram (AUC=0.840) has better prognostic value than single indicators, such as age (AUC=0.609), stage (AUC=0.674) and prognostic risk scoring model (AUC=0.775) (Figure 4e-f). Gsva enrichment was performed using the "c2.cp.kegg.v7.2" gene set downloaded from the molecular characterization database (MSIGDB) to explore the biological behavior of the two groups. We found that most metabolic pathways, including fatty acid metabolism, were enriched in the high-risk score (Figure 4g). The enrichment pathway of the high-risk population was positively correlated with the tumor progress and immune biological processes, such as the WNT signaling pathway, B cell receptor signaling pathway, and Mammalian Target of Rapamycin (mTOR) signaling pathway.
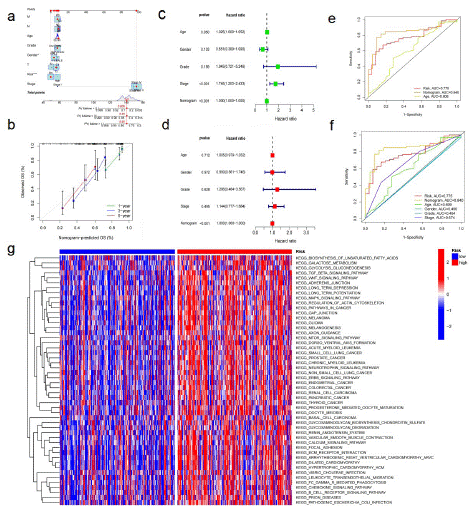
    Figure 4: The predictive value of fatty acid metabolism score in combination with clinical pathological characteristics in OS of patients from TCGA cohort.

(a) Nomogram predicting OS of patients from TCGA cohort. (b) The calibration-plots of the nomogram. The x axis is nomogram-predicted survival, and the y axis is actual survival. (c) Univariate Cox regression analysis of the nomogram. (d) Multivariate Cox regression analysis of the nomogram. (e) ROC curves for fatty acid metabolism score and the nomogram. (f) ROC curves for fatty acid metabolism score and clinical pathological characteristics. (g) The heatmap of GSVA enrichment between low- and high-risk score groups.
Immune-Related Characteristics in the Low- and High-Risk Score Groups
The correlation between risk characteristics and immune classification of BLCA was evaluated. The risk scores were different for different immune classifications. The risk scores of C1 and C2 were higher than those of C3 and C4 (Figure 3h). Through analysis, it was found that the expression of genes related to fatty acid metabolism in bladder tumor tissue was correlated with immune cell infiltration. The genes with high expression of multiple immune cell infiltration in bladder tumor tissue were ACTA2, COL5A1, CXCL12, DCN, TPM2, and so on. In the analyzed genes related to fatty acid metabolism, it can be seen that B cells, Plasma cells, T cells CD4 memory resetting, mono-cells, macrophages M2, and Mast cells resetting are infiltrating immune cells in the high-risk group, and naive B cells, CD4 memory resetting, CD4 memory resetting, macrophages M2, Mast cells resetting, and neutrophils are enriched higher than those in the low-risk group (Figure 5a). In addition, APC co inhibitory response, APC co stimulatory response, CCR, checkpoint, cytolytic activity, para-inflammation, inflammation-promoting, T cell co-stimulation, T_ cell_ Co-inhibition and para-inflammation were also activated in the high-risk group, which indicated that patients in the high-risk group with immunosuppression could respond to immunotherapy (Figure 5b). CIBERSORT analysis showed that in BLCA, the correlation between the level of immune cell infiltration and differential gene expression was significant (Figure 5c-g). Quantification of fatty acid metabolism risk score is a new and reliable biomarker used to evaluate the prognosis and clinical response of immunotherapy.
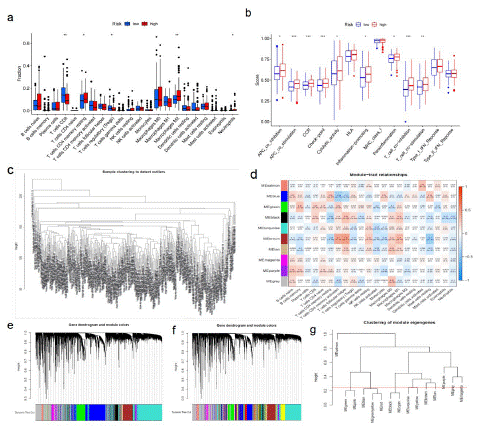
    Figure 5: Fatty acid metabolism model in immunotherapy.

(a)The immunity infiltration difference between high-risk score (red) and low-risk score(blue) (p value <0.05). (b)The known function associated with immunity regulation difference between patients with high-risk score and low-risk score, p value < 0.05. (c-g) CIBERSORT analysis showed that in BLCA, the correlation between the level of immune cell infiltration and DGEs.
Protein-Protein Interaction (PPI) Network of DEGs in the Low and High Risk Score Groups
The string online database was used to analyze the expression profile of DEG in the low-risk and high-risk scoring groups. The Protein-Protein Interaction (PPI) network was constructed using DEGs as shown in Figure 6a. The total genes in the network were selected, as shown in Figure 6b. By comparing the gene expression differences between normal and tumor, a total of 11 core genes in the network were selected: FN1, EGFR, COL1A2, ITGAM, DCN, ALB, COL3A1, ACTA2, TPM2, COL5A1, and CXCL12. The core genes at the center of the protein interaction network are FN1, COL1N3, COL1A2, and EGFR.
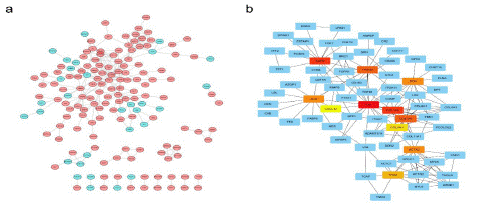
Figure 6: Protein-protein interaction (PPI) network of DEGs. (a) PPI network processed by Cytoscape. red: DEGs that expressed highly in the high-risk score group; blue: DEGs that expressed highly in the low-risk score group. (b) Top 10 hub genes selected by cytoscape.
Analysis of Single Gene Prognosis and Clinicopathological Characteristics
We conducted a single gene survival analysis of BLCA patients. The analysis showed that the survival rates of FN1 (p<0.001), ACTA2 (p=0.002), ALB (p=0.019), COL1A2 (p=0.002), COL3A1 (p=0.004), COL5A1 (p=0.002), CXCL12 (p=0.004), DCN (p=0.008), EGFR (p<0.001), and TPM2 (p=0.014) high expression groups were lower than those of low expression groups (Figure S2a-i). The level of single gene expression was significantly negatively correlated with the survival prognosis of BLCA patients. In addition, the above genes were analyzed for clinical characteristics (age, gender, classification, clinical stage, TNM stage). The analysis found that the expression of ACTA2 (p=0.003), COL1A2 (p=0.043), COL3A1 (p=0.036), COL5A1 (p=0.044), CXCL12 (p=0.00011), DCN (p=0.019), FN1 (p=0.047), TPM2 (p=0.014) increased with age (Figure S3a-h). Among them, the expression of ACTA2, COL1A2, COL3A1, COL5A1, CXCL12, DCN, FN1, TPM2 is positively correlated with the stage (FigS4a-h) and grade (FigS5a-h) of BLCA. It is proved that the expression of ACTA2, COL1A2, COL3A1, COL5A1, CXCL12, DCN, FN1, TPM2 is associated with poor prognosis.
Correlation between FN1 and Prognosis of BLCA
Through bioinformatics analysis, FN1 is related to the clinicopathological characteristics and prognosis of BLCA. Through extensive cancer analysis found that FN1 is high expression of urinary epithelial tumors (Figure S 6i). In BNCORI database, 411 cases of BLCA and 19 cases of para-carcinoma tissue were selected for comparative verification. The expression of FN1 in BLCA tissues was higher than that in para-carcinoma tissue (p<0.05; Figure 7a). Via online bioinformatics analysis (http://www.genecards.org/)showed that FN1 expressed in bladder cancer risk (p<0.05; Figure 7b). The biological information analysis showed that FN1 in the TCGA database correlation with prognosis of bladder cancer OS performance, the conclusion in GSE13507 data (Figure 7c). Although there was no significant difference in gender-related risk scores (p=0.17; Figure S 6d), higher risk scores were associated with higher age (>65;p=0.047; Figure 7d), high grade(p=4.2e-10; Figure 7e), late pathological stage (p=0.047; Figure S6f), AJCC-T (tumor invasion) stage(p<0.05; Figure S6e), AJCC-M (distal metastasis) (p=0.026; Figure 7f), AJCC-N (lymph metastasis) (p<0.05; Figure 7g). Compared with the low-risk scoring group, the patients in the high-risk scoring group had a poor prognosis (p<0.001; Figure S2c). Because the expression of FN1 is related to the poor prognosis of BLCA, we discussed the relationship between the expression of FN1 and clinical drug sensitivity. "TIMER2.0" was used to analyze the relationship between FN1 expression and axitinib or cisplatin sensitivity. It was found that the sensitivity of axitinib (p=0.063; Figure S6g) or cisplatin (p=0.073; Figure S6h) for clinical treatment decreased with the increase of FN1 expression in BLCA tissue. To validate the bioinformatic analysis, we obtained RNA in BLCA and adjacent tissues of patients from 50 pairs of sample tissues obtained clinically, and carried out reverse transcription. Real time quantitative PCR was used to verify the change of FN1 mRNA expression in BLCA and adjacent tissues, we were surprised to find that FN1 expression in BLCA tissues was higher than that in adjacent tissues (p<0.0001; Figure 7i). Bioinformatics analysis (https://www.proteinatlas.org/) indicated that low expression of FN1 in immunohistochemical sections of low-grade bladder cancer (Figure 7j; Figure S6j). High expression of FN1 in immunohistochemical, by contrast, sections of high-grade bladder cancer (Figure 7k; Figure S6j).
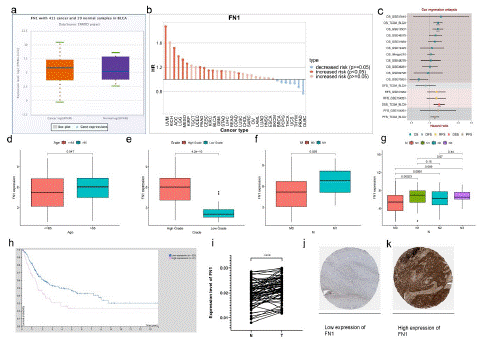
    Figure 7: Clinical characteristics of FN1 expression.

(a) ENROCI analyzed the expression of FN1 in bladder cancer tissues compared with paracancerous tissue.(b) FN1 expression increased the risk of bladder cancer (p< 0.05). (c) Cox regression analysis of FN1 expression and prognosis of bladder cancer (p<0.05). (d-g) The relationship of FN1 expression and clinicopathological features, including age (d), grade (e), AGCC-M (f), and AGCC-N (g). (h) Survival of bladder cancer patients with low and high expression of FN1(p<0.05). (i) Expression of FNI in bladder cancer and paracancerous tissue. (j) Low expression of FN1 in immunohistochemical sections of low-grade bladder cancer. (k) High expression of FN1 in immunohistochemical sections of high-grade bladder cancer.
The Change of FN1 Expression Affects BLCA Cells
We have established a BLCA cell line with FN1 overexpression and knockdown, In BLCA cells transfected with si-FN1, the efficiency of q-PCR verification showed that the mRNA expression of FN1 decreased, including T24 cell line was knocked out to 10% to 25% (Figure 8a, Figure S6b) and BIU87 to 43% to 46% (Figure 8b, Figure S6b). We further overexpressed FN1 in T24 (Figure 8c, Figure S6b) and BIU87 (Figure 8d, Figure S6b) cells. The efficiency of overexpression and knockout was verified at mRNA levels, so we chose T24 for analysis. Colony formation experiments revealed that FN1 silencing could suppress the colony formation of T24 cells (Figure 8e). In the migration experiment, the silencing of FN1 inhibited cell migration, whereas the invasion of bladder cancer cells was enhanced (Figure 8f). In wound healing test, the silencing of FN1 inhibited the healing of cell scratches, whereas the healing of cell scratches was enhanced when FN1 was highly expressed (Figure 8g). The verification of cell proliferation experiment shows that FN1 silencing inhibits the proliferation of T24 cells, and conversely, FN1 overexpression promotes cell proliferation and colony formation (Figure 8h).
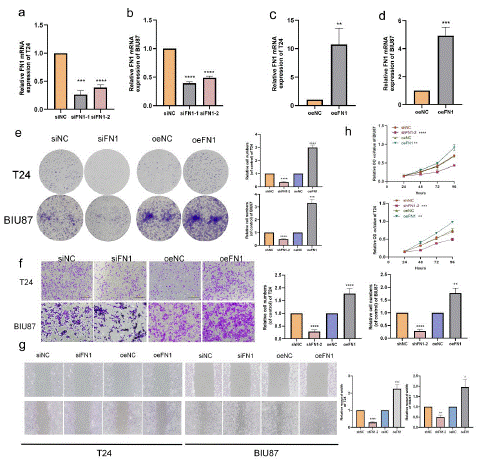
    Figure 8: FN1 promotes BLCA cell migration and invasion.

(a) FN1 mRNA expression were decreased in T24 (b) FN1 mRNA expression were decreased in BIU87 (c) FN1 mRNA expression in T24 cells increased. (d) FN1 mRNA expression in BIU87 cells increased. (e) Cloning assay showed that FN1 knockdown inhibited the proliferation of T24 cells, and FN1 overexpression promoted the proliferation of T24 cells. (f) Transwell migration assay and invasion assay showed that FN1 knockdown inhibited the migration and invasion of T24 cells. (g) Wound healing assay showed that FN1 knockdown inhibited the migration of T24 cells; FN1 overexpression promotes T24 cell migration. (h) Cell proliferation experiment showed that FN1 knockdown inhibited the proliferation of T24 cells; FN1 overexpression promotes the proliferation of T24 cells.
The Relationship between FN1 Expression and Immune Invasion in BLCA
FN1 expression is associated with poor prognosis. Using the median expression value of FN1 as the cut-off value to explore the specific difference of TME immune cell infiltration between patients with high and low expression of FN1. Compared with patients with low expression of FN1, tumors with high expression of FN1 have significantly less infiltration of Tregs (Figure 9a). In addition to only a few significantly increased immune infiltrating cells: B cells naive, B cells memory, Plasma cells, and Macrophages-M2. K–M survival analyses showed that patients with higher M2 macrophage infiltration had poor survival [14]. Most of the immune cell infiltration is negatively related to FN1 expression, especially the CD8+T cells with tumor cell killing function that we are concerned about.
TIMER2.0 correlation analysis showed that the infiltration level of CD8+T cells was negatively correlated with the expression of FN1 (Figure 9b-d). The above evidence shows that FN1 is related to the different distribution of immune cells, especially the CD8+T cells in BLCA (Figure 9e). To test this hypothesis, we analyzed the correlation between CD8+T cell division and its key markers PD-L1 (CD274, Figure 9f) [15-19], CTLA4 [20,21] (Figure 9g) and FN1 respectively. Finally, we conclude that the expression level of FN1 is negatively correlated with the infiltration level of CD8+T cells, and positively correlated with the expression levels of PD-L1(Figure 9h) and CTLA4 (Figure 9i). We have reason to believe that the high expression of FN1 is related to the immune escape of BLCA cells (Figure S6a). Online biogenic analysis showed that FN1 expression was inversely proportionFigure al to that in bladder cancer tumor tissue infiltrated by CD8+T cells in the database GSE19750 (Cor=-0.079,p=5.9e-01, Figure 9j). The above conclusions were repeated in the database GSE33371 (Cor=-0.190,p=1.7e-01, Figure 9k).
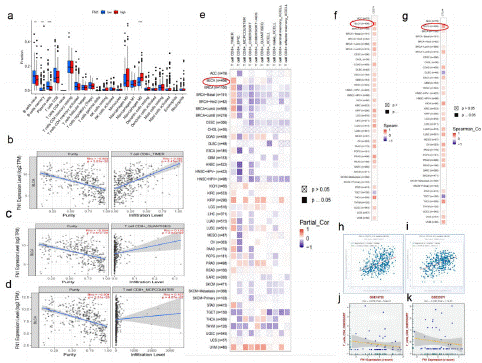
    Figure 9: Expression of FN1 in BLCA tissues and FN1’s correlation with immune.

(a) FN1 expression and immune cell infiltration in bladder cancer tissue. blue: low expression; red: high expression. (b) Correlation between FN1 expression and CD8+T cells in bladder cancer tissues. (c) Correlation between FN1 expression and quantiseq of CD8+T+ cells in bladder cancer tissues. (d) Correlation between FN1 expression and mcpcounter of CD8+T cells in bladder cancer tissues (e) TIMER2.0 verified the correlation between FN1 expression and CD8+T cell infiltration in different tumor tissues, including 408 cases of bladder cancer. (f) TIMER2.0 verified the co expression of FN1 and CD274 in different tumor tissues, including 408 cases of bladder cancer. (g) TIMER2.0 verified the co expression of FN1 and CTLA4 in different tumor tissues, including 408 cases of bladder cancer. (h) ENCORI verification: the co expression of FN1 and CD274 in 411 cases of bladder cancer tumor tissue was correlated. (i) ENCORI verification: the co expression of FN1 and CTLA4 in 411 cases of bladder cancer tumor tissue was correlated. (j) GSE19750: FN1 expression and immune cell infiltration in BLCA tissue. (k) GSE33371: FN1 expression and immune cell infiltration in BLCA tissue.
The Interaction between FN1 and IL6-JAK-STAT3 Pathway Predicted Susceptibility to BLCA Immunotherapy
Bioinformatics analysis (https://rookieutopia.com/) indicated that the correlation between FN1 and IL6-JAK-STAT3 pathway (p<0.05, Figure 10a). GSEA enrichment analysis of single gene pathway revealed that high expression of FN1 was accompanied by activation of IL6-JAK-STAT3 pathway (Figure 10b). Bioinformatics analysis (https://rookieutopia.com/) indicated that the expression level of FN1 in BLCA tissues was positively correlated with that of IL6 (Figure 10 d; S6c). These data suggest that FN1 may play its role by interacting with the IL6-JAK-STAT3 pathway in BLCA. We verified in high or low expression FN1 cell lines and found that the activity of the IL6-STAT3 pathway was decreased when the expression level of FN1 was low. On the contrary, the pathway was activated (Figure 10c). In addition, we verified the effect of IL6 secretion in the supernatant of FN1 knockdown and overexpressed cell lines by ELISA, and found that knockdown of FN1 inhibited IL6 secretion (Figure 10e). In addition, previous studies have verified that activation of the IL6-JAK-STAT3 pathway promotes the expression of PD-L1 in BLCA. Therefore, western blotting experiments were conducted in IL6-JAK-STAT3 pathway activated cell lines, and it was confirmed that with the over expression of FN1, the expression of PD-L1 was increased. Conversely, the expression level of PD-L1 will decrease (Figure 10c). Therefore, it is reasonable to speculate that FN1 is co-correlated with PD-L1 expression through IL6-JAK-STAT3 pathway in BLCA.
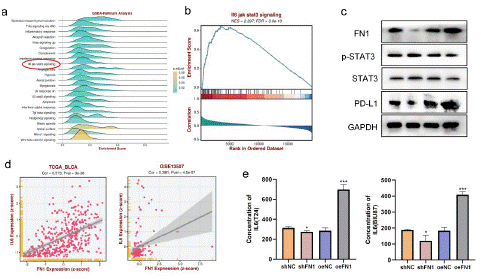
    Figure 10: FN1 regulates the correlation of PD-L1 expression through the IL6-STAT3 pathway

(a)-(b) In bladder cancer, GSEA database predicted the correlation between FN1 expression and IL6-JAK-STAT3 pathway. (c) Correlation between FN1 expression and the degree of activation of IL6-JAK-STAT3 pathway in bladder cancer tissues. (d) Correlation between FN1 expression and IL6 expression in bladder cancer tissues. (e) The expression of FN1 was positively correlated with the secretion of IL6 in bladder cancer.in BLCA tissue.
Discussion
BLCA is estimated to cause 500000 new cases and 200000 deaths worldwide [22]. The majority of newly diagnosed patients with BLCA are male, which is considered to be related to an increased rate of smoking and occupational exposure. It represents a series of diseases. According to the degree of invasion, it can be divided into muscle invasive and non muscle invasive bladder cancer. The two types of bladder cancer have different treatment methods. At present, the understanding of the potential biology of bladder cancer has fundamentally changed the diagnosis methods and management recommendations of the disease [23].
The reprogramming of cell metabolism is crucial in the development of tumors [24,25]. The special environment of the tumor has once again overturned our previous understanding of normal cell metabolism. For example, the hypoxia microenvironment of tumors causes the accumulation of lactic acid, which changes the traditional metabolic mode of cells in the past [26,27]. Current research shows that the tumor microenvironment under hypoxia is closely related to tumor formation, development and therapeutic resistance [28].The change of cell metabolic activity is an important sign of cancer [29]. For example, up-regulation of glycolysis is one of the physiological characteristics of human malignant tumors [30]. The interaction between tumor cells and immune cells within the tumor microenvironment has also undergone subtle changes due to the change of tumor metabolism [31]. At present, immunotherapy is gradually widely used in the clinical application of BLCA [32], and immunotherapy also plays an important role in the treatment of BLCA. However, some patients are not completely satisfied with the response to the current immunotherapy. It is very significant to find appropriate targets to enhance the response of BLCA to immunotherapy. Although most studies have proved the role of fatty acid metabolism in cancer [12,33-37], the role of multiple genes related to fatty acid metabolism is still unclear. To explore the role of different fatty acid metabolism genes in BLCA is helpful to understand the role of fatty acid metabolism in the progress of BLCA, to guide effective treatment strategies.
In this study, we used univariate Cox regression analysis to establish a prognostic risk score model in TCGA cohort and GEO cohort, who includes fatty acid metabolism related genes differentially, expressed in tumor and normal BLCA tissue samples. Prognostic risk score model is used to predict OS of BLCA patients in the training set, to better understand the role of these genes in BLCA. The survival rate of BLCA patients in low-risk scoring group and high-risk scoring group was different. The same results were reported in the trial data set, indicating that the prognostic risk scoring model can screen patients with low survival rates.
This confirmed the necessity of establishing a fatty acid metabolism gene model in the clinical prognosis of patients. In multivariate analysis, the prognostic risk score model is an independent prognostic factor. In addition, by combining some selected clinicopathological features in the risk assessment nomogram, the predictive potential of the prognostic risk scoring model is further improved. Because there are significant differences between low-risk and high-risk scoring groups, we further explored the different genes in the two groups and finally found that FN1 plays an important role. FN1 mRNA expression was not only positively correlated with clinical stage, but also with poor prognosis. There was a significant correlation between the high expression of FN1 and the low survival rate. Then we found that FN1 promoted the growth, proliferation, and migration of BLCA tumor cells.
Although immunotherapy is widely used in the clinical treatment of BLCA at present [38,39], some patients are suitable for immunotherapy (immunocheckpoint blocking (PD-L1 and CTLA4)) [20], but some patients with BLCA are not suitable. Therefore, it is essential to distinguish patients suitable for immunotherapy in clinical practice [40]. Patients with high-risk scores are rich in suppressive immune cells, including Tregs and MDSCs, and immune inflammatory cells. In addition, we explored the correlation between FN1 expression and the immune microenvironment. It was also found that the high expression of FN1 was positively correlated with the blocking of immune checkpoints, which convinced us that the expression of FN1 was positively correlated with immune escape during the treatment of BLCA.
This indicates that BLCA patients with high FN1 expression are suitable for immunotherapy. In addition, bioinformatics analysis revealed the correlation between the expression of FN1 and the IL6-JAK-STAT3 pathway. Then we experimentally verified that the expression of FN1 would promote the activation of this pathway in bladder cancer tissues. According to previous studies, activation of this pathway will promote the expression of immune checkpoint: PD-L1. Therefore, we speculate that the expression of FN1 is related to the escape of PD-L1 mediated immunotherapy for bladder cancer, which will be further studied and explored in the later stage.
Nevertheless, it should be noted that the detailed mechanism of FN1 in the progression of BLCA and its correlation with immune escape needs to be further explored. Hence, FN1 is expected to become a new target in the treatment of BLCA.
Conclusion
In conclusion, our bioinformatics data show that FN1 is upregulated in BLCA as an independent risk factor. Its expression is related to BLCA grading and staging, interacts with a variety of proteins and genes, involves a variety of pathways and immune activities, and ultimately leads to poor prognosis. Our research further proves that FN1 plays a carcinogenic role, accelerates the growth of tumor cells, and enhances the invasion and migration of BLCA. FN1 could activate IL6- JAK - STAT3 pathway, promote PD - L1 expression, which will serve as a bladder cancer immune escape potential factors. Therefore, FN1 may be the oncogene of BLCA. It can also be used as a biomarker for the diagnosis and treatment of BLCA.
Data Availability
The original contributions presented in the study are included in the article/Supplementary Material. Further inquiries can be directed to the corresponding author.
Ethical Approval
Informed consent was obtained from all participants. All experimental protocol were approved by the Institutional Research Ethics Committee of The First people’s Hospital of Yancheng. All methods of this study were carried out in accordance with the Declaration of Helsinki.
Conflicts of Interest
The authors declare that they have no conflicts of interest.
Author’s Contributions
JH, YX conceived of the study and QS carried out its design. KXB and KZ wrote the main manuscript text. JYT and ZLD prepared figures. JH, YX and QS reviewed the manuscript. All authors reviewed the manuscript.
Funding Statement
This work was supported by the National Natural Science Foundation of China (81902570), Outstanding Young Doctor Training Program of Jiangsu Province Hospital of Chinese Medicine (2023QB0131) the scientific research fund of Jiangsu Province Hospital of Chinese Medicine (Y22055).
Acknowledgments
We acknowledge and appreciate the help in the plot from Figure Ya.
References
- Lenis AT, Lec PM, Chamie K, Mshs MD. Bladder cancer: a review. JAMA. 2020; 324: 1980-91.
- Dobruch J, Oszczudlowski M. Bladder cancer: current challenges and future directions. Medicina (Kaunas). 2021; 57.
- Qi Y, Tang D. Commentary: bladder cancer. Curr Urol. 2021; 15: 1.
- Seidl C. Targets for therapy of bladder cancer. Semin Nucl Med. 2020; 50: 162-70.
- Martínez-Reyes I, Chandel NS. Cancer metabolism: looking forward. Nat Rev Cancer. 2021; 21: 669-80.
- Currie E, Schulze A, Zechner R, Walther TC, Farese RV. Cellular fatty acid metabolism and cancer. Cell Metab. 2013; 18: 153-61.
- Carracedo A, Cantley LC, Pandolfi PP. Cancer metabolism: fatty acid oxidation in the limelight. Nat Rev Cancer. 2013; 13: 227-32.
- Calder PC. Functional roles of fatty acids and their effects on human health. JPEN J Parenter Enter Nutr. 2015; 39: 18S-32S.
- Röhrig F, Schulze A. The multifaceted roles of fatty acid synthesis in cancer. Nat Rev Cancer. 2016; 16: 732-49.
- Yang C, et al. Androgen receptor-mediated CD8(+) T cell stemness programs drive sex differences in antitumor immunity. Immunity. 2022; 55: 1268-1283.e9.
- McLane LM, Abdel-Hakeem MS, Wherry EJ. CD8 T cell exhaustion during chronic viral infection and cancer. Annu Rev Immunol. 2019; 37: 457-95.
- Zhang Y, et al. Enhancing CD8(+) T cell fatty acid catabolism within a metabolically challenging tumor microenvironment increases the efficacy of melanoma immunotherapy. Cancer Cell. 2017; 32: 377-391.e9.
- Hossain MA, Liu G, Dai B, Si Y, Yang Q, Wazir J, et al. Reinvigorating exhausted CD8(+) cytotoxic T lymphocytes in the tumor microenvironment and current strategies in cancer immunotherapy. Med Res Rev. 2021; 41: 156-201.
- Martínez VG, Rubio C, Martínez-Fernández M, Segovia C, López-Calderón F, Garín MI, et al. BMP4 induces M2 macrophage polarization and favors tumor progression in bladder cancer. Clin Cancer Res. 2017; 23: 7388-99.
- Ohaegbulam KC, Assal A, Lazar-Molnar E, Yao Y, Zang X. Human cancer immunotherapy with antibodies to the PD-1 and PD-L1 pathway. Trends Mol Med. 2015; 21: 24-33.
- Cha JH, Chan LC, Li CW, Hsu JL, Hung MC. Mechanisms controlling PD-L1 expression in cancer. Mol Cell. 2019; 76: 359-70.
- Jiang Y, Chen M, Nie H, Yuan Y. PD-1 and PD-L1 in cancer immunotherapy: clinical implications and future considerations. Hum Vaccin Immunother. 2019; 15: 1111-22.
- Patel SP, Kurzrock R. R. Kurzrock, PD-L1 expression as a predictive biomarker in cancer immunotherapy. Mol Cancer Ther. 2015; 14: 847-56.
- Ai L, Xu A, Xu J. Roles of PD-1/PD-L1 pathway: signaling, cancer, and beyond. Adv Exp Med Biol. 2020; 1248: 33-59.
- Rouanne M, Roumiguié M, Houédé N, Masson-Lecomte A, Colin P, Pignot G, et al. Development of immunotherapy in bladder cancer: present and future on targeting PD(L)1 and CTLA-4 pathways. World J Urol. 2018; 36: 1727-40.
- Jing W, Wang G, Cui Z, Xiong G, Jiang X, Li Y, et al. FGFR3 destabilizes PD-L1 via NEDD4 to control T-cell-mediated bladder cancer immune surveillance. Cancer Res. 2022; 82: 114-29.
- Richters A, Aben KKH, Kiemeney LALM. The global burden of urinary bladder cancer: an update. World J Urol. 2020; 38: 1895-904.
- Siegel RL, Miller KD, Jemal A. Cancer statistics, 2020. CA Cancer J Clin. 2020; 70: 7-30.
- Vander HM, DeBerardinis RJ. Understanding the intersections between metabolism and cancer. Biol Cell. 2017; 168: 657-69.
- DeBerardinis RJ, Chandel NS. Fundamentals of cancer metabolism. Sci Adv. 2016; 2: e1600200.
- Zhang L, Wang S, Wang Y, Zhao W, Zhang Y, Zhang N, et al. Effects of hypoxia in intestinal tumors on immune cell behavior in the tumor microenvironment. Front Immunol. 2021; 12: 645320.
- Jing X, Yang F, Shao C, Wei K, Xie M, Shen H, et al. Role of hypoxia in cancer therapy by regulating the tumor microenvironment. Mol Cancer. 2019; 18: 157.
- Parker TM, Gupta K, Palma AM, Yekelchyk M, Fisher PB, Grossman SR, et al. Cell competition in intratumoral and tumor microenvironment interactions. EMBO J. 2021; 40: e107271.
- La Vecchia S, Sebastián C. Metabolic pathways regulating colorectal cancer initiation and progression. Semin Cell Dev Biol. 2020; 98: 63-70.
- Ganapathy-Kanniappan S, Geschwind JF. Tumor glycolysis as a target for cancer therapy: progress and prospects. Mol Cancer. 2013; 12: 152.
- Kishton RJ, Sukumar M, Restifo NP. Metabolic regulation of T cell longevity and function in tumor immunotherapy. Cell Metab. 2017; 26: 94-109.
- Witjes JA, Bruins HM, Cathomas R, Compérat EM, Cowan NC, Gakis G, et al. European Association of Urology guidelines on muscle-invasive and metastatic bladder cancer: summary of the 2020 guidelines. Eur Urol. 2021; 79: 82-104.
- Veglia F, Tyurin VA, Blasi M, De Leo A, Kossenkov AV, Donthireddy L, et al. Fatty acid transport protein 2 reprograms neutrophils in cancer. Nature. 2019; 569: 73-8.
- Niu J, Sun Y, Chen B, Zheng B, Jarugumilli GK, Walker SR, et al. Fatty acids and cancer-amplified ZDHHC19 promote STAT3 activation through S-palmitoylation. Nature. 2019; 573: 139-43.
- Lim SA, Wei J, Nguyen TM, Shi H, Su W, Palacios G, et al. Lipid signalling enforces functional specialization of Treg cells in tumours. Nature. 2021; 591: 306-11.
- Tang Y, Tian W, Xie J, Zou Y, Wang Z, Li N, et al. Prognosis and dissection of immunosuppressive microenvironment in breast cancer based on fatty acid metabolism-related signature. Front Immunol. 2022; 13: 843515.
- Niu J, Sun Y, Chen B, Zheng B, Jarugumilli GK, Walker SR, et al. Retraction Note: fatty acids and cancer-amplified ZDHHC19 promote STAT3 activation through S-palmitoylation. Nature. 2020; 583: 154.
- Roviello G, Catalano M, Santi R, Palmieri VE, Vannini G, Galli IC, et al. Immune checkpoint inhibitors in urothelial bladder cancer: state of the art and future perspectives. Cancers (Basel). 2021; 13.
- Kim IH, Lee HJ. Perioperative systemic treatment for muscle-invasive bladder cancer: current evidence and future perspectives. Int J Mol Sci. 2021; 22.
- Samuel M, Gabrielsson S. Personalized medicine and back-allogeneic exosomes for cancer immunotherapy. J Intern Med. 2021; 289: 138-46.